
Abstract
A field lab-on-a-chip system was constructed to detect mouse immunoglobulin G (mIgG; model protein target) and Escherichia coli (E. coli; model microorganism target) by using light scattering detection of particle immunoagglutination. The antibodies to these targets were conjugated to the submicron particles by covalent binding, and their long-term stability was evaluated. Antibody-conjugated particles were able to be stored in a 4 °C refrigerator for at least 4 weeks and to be lyophilized as a powder form for the storage in room temperature. The optimum antibody coverage on the particles was 50% for mIgG and 100% for E. coli in terms of assay sensitivity and long-term storage of reagents. Lab-on-a-chip device was fabricated from acrylic plate using an industrial-grade milling machine eliminating the need for photolithography and internal or external pumping. An automatic sampling system was constructed using drip emitters, such that the system can be connected to a pressurized water pipe for detecting E. coli. The automatic sampling system generated the same volume of droplets (70 μL) regardless of pressure. The developed system was successfully tested for E. coli presence in field water samples. The system can potentially be connected to pressurized pipe networks for drinking, processing, irrigation, and wastewater.
Introduction
The demand for detecting waterborne pathogens has been increasing because of the growing number of Escherichia coli (E. coli, especially O157:H7) and Salmonella typhimurium outbreaks in fresh produce and drinking water 1 –3 . The number of E. coli O157:H7 outbreaks in United States, for example, has grown rapidly in the past 4 years: fresh spinach in 2006; Taco Bell (yellow onion) in 2006; ground beef in 2007, 2008, and 2009; and cookie dough in 2008. 4 Several biosensor technology methods for detecting waterborne pathogens have been attempted in recent years, 5 –8 although their use for field assays still seems to be in their preliminary stages. Clearly, real-time and on-the-scene methods of pathogen detection are needed to keep the water and produce supplies safe for human consumption. Waterborne pathogens can often survive for long periods of time on produce under various conditions. 9 –15 Sinclair et al. 16 also reported an epidemiological approach to monitoring sewer systems (and thus open channels) for early detection of pathogens that might be used as biological weapons, thereby allowing pathogen shedding before a community-level epidemic can begin. Therefore, it would seem advantageous to deploy inexpensive and rapid-detection biosensors, or a sensor network, in the pressurized distribution pipes, open irrigation channels, or downstream of food washing facilities.
Our group has previously demonstrated the use of antibody-conjugated submicron particles (which are core-shell structured or highly carboxylated) and a lab-on-a-chip device to detect pathogens. 15,17 –19 A couple of issues still remained to be resolved to use that system for field E. coli assays. Can we store the antibody-conjugated particles (“reagents”for field testers) at room temperature (e.g., in a lyophilized powder form)/ Alternatively, can we store them in a regular refrigerator (4 °C) for a long period of time, such as 1 or 2 months/ Can we achieve microfludic flow in a simpler way, without using electroactuation (e.g., electroosmotic flow) or a syringe pump/ More importantly, can we have an automatic sampling system from a pressurized water pipe for drinking, processing, irrigation, and wastewater, without any human labor/
Almost no study has been available addressing the previously mentioned issues for lab-on-a-chip pathogen sensor. The purposes of this work are to estimate how long the antibody-conjugated particles can be stored and to develop a simple automatic sampling system that does not require internal or external pumping (e.g., use of electroosmotic flow or a syringe pump), such that the proposed lab-on-a-chip system can be implemented for field E. coli assays in pressurized water systems in an unmanned manner.
Materials and Method
Antigens, Antibodies, and Particles
The target antigens were mouse immunoglobulin G (mIgG; model protein target) and E. coli (model microorganism target). mIgG was purchased from Sigma—Aldrich (catalog no. I5381, St. Louis, MO), which was serially diluted from 1 pg mL−1 to 1 mg mL−1 with 50 mM phosphate buffered saline (PBS; pH 7.4; Sigma—Aldrich). E. coli K12 lyophilized cell powder was also purchased from Sigma-Aldrich (catalog no. EC1), which was cultured in brain—heart infusion broth (Remel, Lenexa, KS) at 37 °C for 24 h. This fully cultured E. coli solution was serially diluted with 50 mM PBS (pH 7.4). The colony-forming unit (CFU) of each serial dilution was evaluated for test by placing 10μL of the dilution on an agar plate (Fisher scientific, Pittsburgh, PA) and incubating it at 37 °C for 24 h.
Anti-mIgG was purchased from Sigma—Aldrich (catalog no. M8642). Anti-E. coli was purchased from Meridian Life Sciences (catalog no. B47385G, Saco, ME). Both antibodies were conjugated to the 920-nm highly carboxylated polystyrene particles (10.3 Å 2 parking area per surface carboxyl group; Bangs Laboratories, Fishers, IN) by covalent binding. The binding procedure is described in the following. 20 First, the particles were washed twice with an activation buffer, 50-mM 2-(N-morpholino)ethanesulfonic acid (pH 6.0; catalog no. M3671, Sigma—Aldrich). A centrifuge was used for all washing processes, for 15 min and at 9900 rpm. Then, the particles were mixed with water-soluble carbodiimide (WSC; catalog no. 03449, Sigma—Aldrich) at room temperature (23–25 °C). After mixing with WSC, the particles were washed twice with coupling buffer, PBS (pH 7.4), followed by adding the particle suspension into an antibody solution. The particle suspension with antibodies was gently mixed overnight with a rocking shaker in a 4 °C refrigerator. After mixing with antibodies, the suspension was washed three times with PBS, followed by mixing with a quenching solution, 40 mM of hydroxylamine solution (catalog no. 379921, Sigma—Aldrich). Finally, the particles were stored in a storage buffer, which is made of 98.95% of PBS, 1% of 400μg mL−1 bovine serum albumin (catalog no. P5619, Sigma—Aldrich), and 0.05% of 0.01 mM sodium azide (catalog no. S2271, Fisher Scientific). The surface coverage of antibodies was set to 33%, 50%, or 100% on the surface of the particles, as controlled by the initial concentrations of anti-body solutions. Refer to Bangs 21 , for further information. A half of the antibody-conjugated particle suspension was stored in a 4 °C refrigerator, whereas the other half was lyophilized with a vacuum lyophilizer, which consisted of a centrifuge from Savant (Holbrook, NY), a refrigerated trap from Jouan (Winchester, VA), and a vacuum pump from Leybold (Cologne, Germany). After lyophilization, the resulting powders were stored at room temperature (23–25 °C). Therefore, 12 different types of antibody-conjugated particles were prepared: antibodies to mIgG or E. coli; 33%, 50%, or 100% antibody coverage, and liquid suspension or lyophilized powder (2 × 3 × 2 combinations = 12).
Light Scattering Detection
The experimental setup for light scattering detection is largely identical to our previous work. 17,18 Figure 1 shows the fiber arrangements only. The USB4000 miniature spectrometer, model LS-450 LED light source and fiber optic cables (Ocean Optics, Dunedin, FL) are arranged in what is known as“proximity”fiber arrangement. The optical fiber was connected to an LS-450 light source (Ocean Optics) with a 375-nm light-emitting diode (LED). Another optical fiber (Ocean Optics) was placed on top of the device at a 45° angle to collect the scattered light from the agglutination of targets and antibody-conjugated particles while avoiding any of the direct incident light from the source. The detector fiber was connected to a miniature spectrometer (USB4000, Ocean Optics) that was connected to a computer. SpectraSuite software (Ocean Optics) was used to identify the signal intensity at 375 nm. Integration time was set to 5 ms.
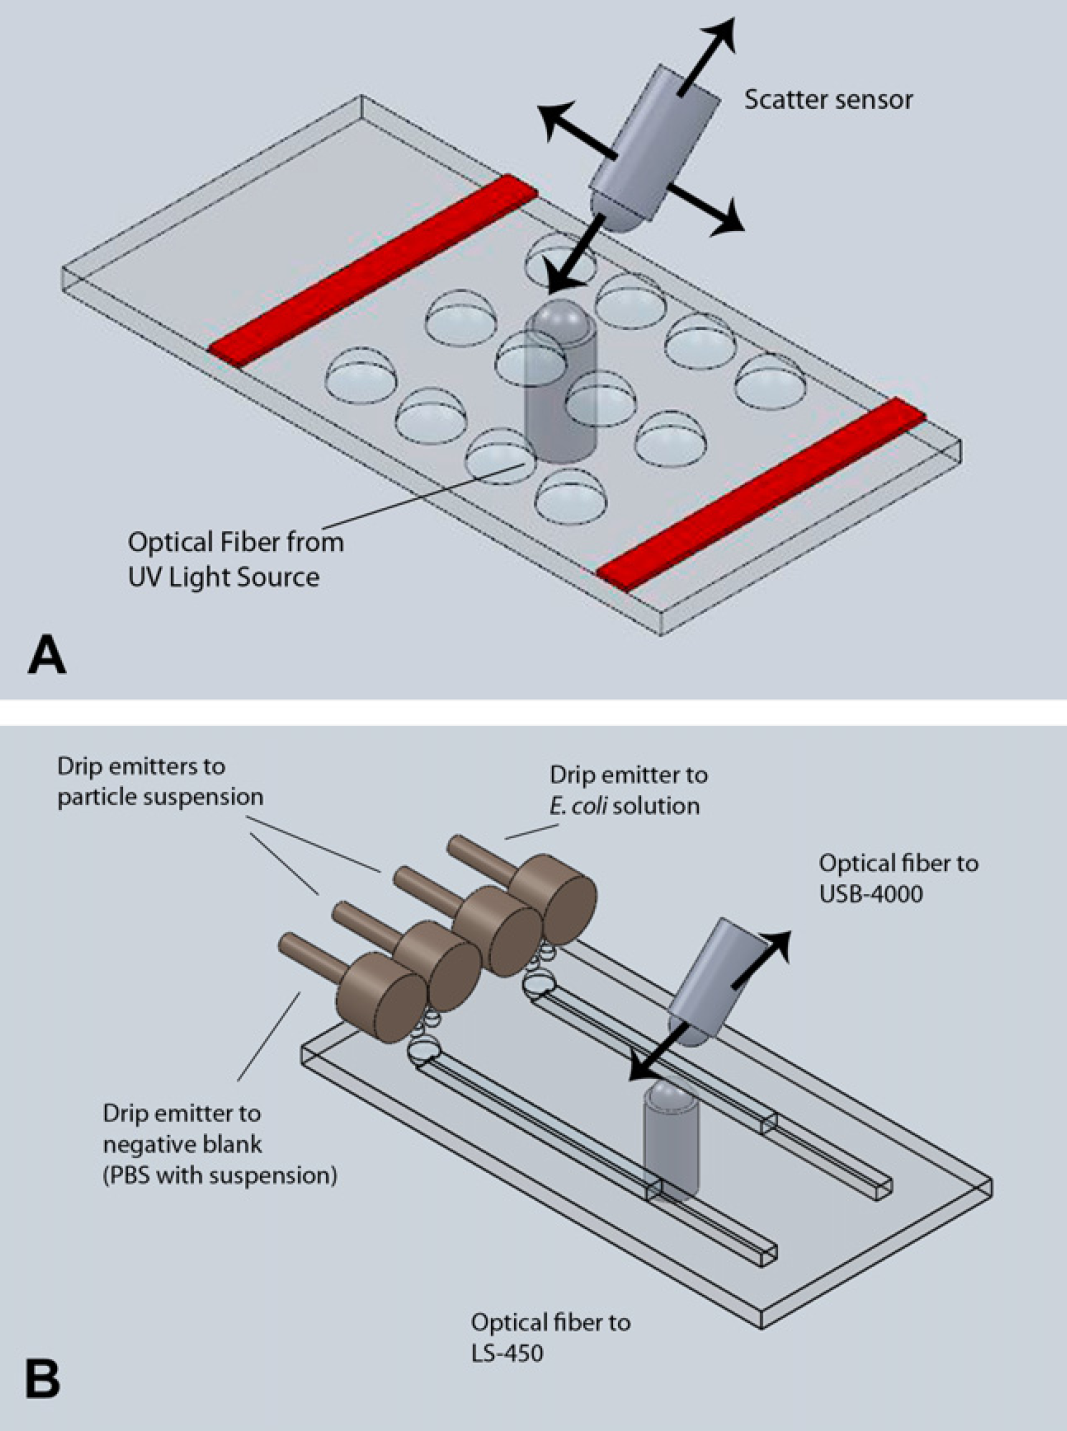
A multiwell slide (A) and a lab-on-a-chip (B) used in this study. Bottom optical fiber delivers light from an LED light source (LS-450), and top optical fiber collects scattered light at forward 45° and delivers to a miniature spectrometer (USB-4000). Optical fibers are microcallipered by two sets of micropositioning stages: x-, y- and z-movements for the bottom and x-, y-, z- and angular movements for the top. Refer to Heinze et al. 18 for more details. The lab-on-a-chip schematic (B) also shows four drip emitters, two each per channel, which dispense the droplets of target solution (serial dilutions of E. coli or field water samples) and antibody-conjugated particle suspension.
In-house fabricated multiwell slide was used with the previously described light scattering detection system before lab-on-a-chip experiments to optimize experimental conditions. For each test, 7μL of target solution and 7μL of antibody-conjugated particle suspension were placed on each well of a slide to be passively mixed with each other (by molecular diffusion). The light scattering signals were collected immediately after two droplets were placed on each well, as shown in Figure 1A.
For the long-term storage test of particle suspension, suspensions were stored in a 4 °C refrigerator. Aliquots were taken from the stock suspension after 1, 7, 14, and 28 days, and subsequent particle immunoagglutination assays were performed in a multiwell slide that was sitting on a proximity fiber setup. To check the feasibility of lyophilizing particle suspension (for long-term storage at room temperature), the lyophilized powder was made from antibody-conjugated particle suspension, resuspended back into PBS, and the previously mentioned particle immunoagglutination assays were performed in the same manner.
All light scattering data were normalized by dividing it with that of a negative control, that is, 50-mM PBS with antibody-conjugated particles.
Fabrication of Lab-on-a-Chip
The lab-on-a-chip was fabricated from an acrylic plastic plate (80 × 30 mm of a rectangular shape) on an industrial-grade milling machine (FTV-2S, Lagun, Spain) with a turntable-style clamp. The channels were milled using a 1/32 in. drill bit. Each channel was drilled 50-mm long and 7.5 mm from the long edges of the chip. The channels were drilled 1-mm deep leaving 1.15 mm of acrylic plastic that blocks the viewing of the samples during testing. The process of cutting the channels was done very slowly, taking about 2 h per chip. Cutting oil was applied often to ensure that the bottom of the channels were as transparent as possible. Then, bur cutters (sphere-shaped cutters) were used to cut out the top part of the channels. The chip surface that was cut away to get the chip to the correct thickness was polished and buffered to make it as transparent as possible, as shown in Figure 1B.
Automatic Sampling System
The automatic sampling system was constructed as shown in Figure 2. Centrifuge tubes of 50 mL were used as the chambers for serially diluted positive target solutions (with a negative control) and antibody-conjugated particle suspensions. Two holes were drilled through the top of each chamber. Two Tygon tubes were then inserted with one extending to the bottom of the chamber for liquid outlet, whereas the other only extended a short distance as a pressurized air inlet. These were sealed by using a hot melt glue gun (MT300; Arrow Fastner, Saddle Brook, NJ) to prevent them from shifting their position while under pressure. The adjustable drip emitter (catalog no. 160144; Antelco Corporation, Longwood, FL) was connected to the end of the each tube as a liquid outlet. These drip emitters are originally designed to generate the flow rate of 1–10 gallons per hour (GPH) or 4–40 L h−1. By blocking most of its outlets using a hot melt glue gun and leaving just one, we attempted to reduce the flow rate by one-tenth or less. Both drip emitters were glued together using the same hot glue. Pressurized air was supplied to both chambers to make the liquid flow through the tubes toward the drip emitters. Supplied pressure was estimated by a pressure meter (catalog no. 63–1113, Radioshack, Fort Worth, TX). Flow rate and the volume of droplets were estimated by a digital balance (AR2141; Ohaus Corporation, Pine Brook, NJ).

A schematic illustration (A) and an actual photograph (B) of an automatic sampling system, shown together with the lab-on-a-chip and light scattering detection system.
Light scattering detections were also made for the E. coli tests on a lab-on-a-chip device. The optical fibers were positioned at the center of the fluidic channel within a chip.
Unlike our previous works, 17,18 a view cell was not used to prevent the formation of air bubbles. Two droplets (target solution and particle suspension) were dispensed separately from two drip emitters but fell directly to the same inlet of a fluidic channel where passive mixing was initiated (by molecular diffusion), as shown in Figure 1B. Merged liquids traveled through the fluidic channel via capillary force, as the channel is not strongly hydrophobic (polymethyl methacrylate) and smooth (polished). Again, all light scattering data from lab-on-a-chip experiments were normalized with that of a negative control and PBS + antibody-conjugated particles.
Field Water Testing
The developed system was also tested for field water samples. Water samples were taken from the following sources: (1) a water faucet in a research laboratory; (2) a toilet in the same building after flushing; (3) a fountain at a university campus; (4) a pond with live fishes, with a circulation system; and (5) a pond with live fishes, without a circulation system. All sources are located in Tucson, AZ. All samples were taken in late November 2009. Additionally, sample number 4 was further incubated at 37 °C for 24 h without adding any substrates (this was sample #6). These samples were tested for E. coli in the same manner, as previously described.
Results and Discussion
Figure 3 shows the normalized light scattering intensity for detecting mIgG in a multiwell slide. All scattered intensities for various dilutions of mIgG solutions were divided by a negative control (i.e., PBS + antibody-conjugated particles). Therefore, all signals significantly higher than 1.0 can be considered as positive. Surface coverage of antibodies on particles (hereafter“antibody coverage”) was set to 33% (a), 50% (b), or 100% (c), respectively. Storage time of antibody-conjugated particle suspension (hereafter“storage time”) varied by 1 day (filled square and solid line), 7 days (open triangle and solid line), 14 days (filled square and dashed line), or 28 days (open triangle and dashed line). No significant difference was found between 33% and 50% antibody coverage (although stronger signals were occasionally observed with 33% antibody coverage at mIgG concentrations around 1μg/mL), whereas stronger signals were observed for 100% coverage. The 100% coverage is not the most favorable, as the signals fluctuated with storage time, indicating that the particles may not be stable for certain cases. The average standard deviations (averaged greater than mIgG concentrations and storage time) were 0.10 for 33% antibody coverage, 0.06 for 50% antibody coverage, and 0.18 for 100% antibody coverage. As the average positive signals are circa 1.2 (= I/I0, normalized light intensity), the average standard deviation for 100% antibody coverage, 0.18, is not acceptable. The 50% coverage showed the smallest fluctuation over storage time, indicating that the antibody-conjugated particles can be used for at least 4 weeks. The lowest concentrations that are statistically different from the blank (I/I0 = 1.0) with 95% confidence interval were 10 pg mL−1 for 33% and 50% antibody coverage, and 100 pg mL−1 for 100%. (Two-sigma bounds were used in evaluating the lower detection limit; refer to Heinze et al. 18 , for more details.) All of the above indicates that 50% coverage works the best in terms of assay sensitivity and long-term storage of particle suspension.

The normalized light scattering intensities (I/I0), plotted against the mIgG concentrations. Antibody coverage = 33% (A), 50% (B), or 100% (C). Storage time = 1 day (filled square, solid line), 7 days (open triangle, solid line), 14 days (filled square, dashed line), or 28 days (filled triangle, dashed line). Each curve represents an average of three different experiments. Standard deviations were averaged over mIgG concentrations and shown in the legend.
Identical sets of experiments were repeated for E. coli detection and the results are shown in Figure 4. The linear range of E. coli assay is much broader than that of mIgG, as the signals never level off. E. coli itself is much bigger in size than mIgG, therefore allowing it to make much larger agglutinated clumps, which leads to a broader linear range. Unlike the mIgG assays, the signals were stronger for 33%, 50%, and 100% antibody coverage, in that order, which can easily be explained by the size difference of targets. More epitopes exists in E. coli than mIgG, which may trigger the“prozone effect” 22,23 when there are too many antibodies on particle surfaces. The average standard deviations were 0.23 for 33%, 0.16 for 50%, and 0.14 for 100% antibody coverage. The lower limits of detection were 100 CFU mL−1 for 33% antibody coverage and 10 CFU mL−1 for 50% and 100% with 95% confidence interval. These results indicate that antibody coverage should be optimized based on the target and its size.
Figure 5 shows the normalized light scattering intensities for detecting mIgG (a) and E. coli (b) on a multiwell slide, before and after lyophilization. For both cases, no significant difference was observed before and after lyophilization. The small decrease (3–10%) after lyophilization can be attributed to the slight denaturation of antibodies during the lyophilization process.

The normalized light scattering intensities (I/I0), plotted against the E. coli concentrations. Antibody coverage = 33% (A), 50% (B), or 100% (C). Storage time = 1 day (filled square, solid line), 7 days (open triangle, solid line), 14 days (filled square, dashed line), or 28 days (filled triangle, dashed line). Each curve represents an average of three different experiments. Standard deviations were averaged over E. coli concentrations and shown in the legend.

The normalized light scattering intensities (I/I0), plotted against the mIgG (A) and (B) E. coli concentrations, before (filled square) and after (open triangle) lyophilization. (C) shows E. coli results in a lab-on-a-chip platform. Antibody coverage = 50% for mIgG and 100% for E. coli. Storage time = 7 days. Each curve represents an average of three different experiments. Standard deviations were averaged over mIgG or E. coli concentrations and shown in the legend.
Using the previously mentioned parameters, we attempted to detect E. coli in a field lab-on-a chip device with an automatic sampling system. The surface coverage was 100% and storage time was 7 days. This result was shown together with that in a multiwell slide, as shown in Figure 5C. Both results are identical to each other, indicating that the long-term storage of reagent can easily be implemented in a field lab-on-a-chip system.
The performance of the automatic sampling system was also evaluated. Flow rate from the drip emitters could greatly be reduced to 0.1–0.5 GPH or 0.4−2.0 Lh−1, from the high supplied pressure of 3–6 pound per square in. or 21–41 kPa. The average volume of the generated droplets was 70μL with the standard deviation of 7μL, indicating very reproducible generation of droplets. As the water supply for drinking or irrigation water system is maintained by a pressurized flow, the automatic sampling system can be installed directly to a water pipe with a solenoid valve. High pressure in water pipe will not be applied directly to a lab-on-a-chip by using drip emitters that is exposed to atmospheric pressure. As the droplet size of the system is almost constant regardless of pressure, this system can be applied to many water pipe systems without adjusting or complementing the supplied pressure.
Effect of temperature was also studied for E. coli assays, by varying the ambient temperature from 20, 23 to 26 °C. Results are shown in Figure 6. Lower light scattering intensities were observed with increasing ambient temperature, although these results cannot be considered as significant difference. As the optical transducers are relatively independent of environmental temperature, especially for the narrow temperature range tested in this study, this temperature dependence may be related to the mobility of E. coli and the particles. As the higher temperature makes both E. coli and the antibody-conjugated particles to move faster and in a greater extent, the chances for antigen—antibody binding (and thus immunoagglutination) may become lower.

Effect of ambient temperature in E. coli assays. The normalized light scattering intensities (I/I0) plotted against the E. coli concentrations at 20 °C (open square), 23 °C (gray diamond), and 26 °C (filled triangle). Antibody coverage = 100%.
The developed system was also tested for the field water samples described in Materials and Methods section. Samples #1—#5 were tested as-is, without any attempts of filtering, concentrating, and/or culturing. Results are shown in Figure 7. Water samples taken from a laboratory faucet, a toilet, and a fountain showed the normalized light scattering intensity (I/I0) that are statistically indifferent from that of blank (p > 0.05), whereas the samples from fish ponds showed significant presence of E. coli (p <0.05)
To quantify the amount of E. coli in each sample, a standard curve was constructed (available in the supplementary information)—a plot of I/I0 against the log CFU mL−1 of E. coli that were freshly cultured in laboratory. The equation of a linear trend line was I/I0 = 0.039 log (E. coli CFU mL−1) + 1.08. Using this equation, the CFUs of E. coli was estimated for samples #1—#5. Less than 1 CFU mL−1 was obtained for the first three samples, which are consistent with the above statistical analysis. Around 9.7 and 330 CFU mL−1 were respectively obtained for the fish ponds with and without a circulation system (#4 and #5), indicating that the circulation system apparently affected the quantity of E. coli presence. As 9.7 CFU mL−1 seemed quite low, a further experiment was needed to exclude the possibility of false-positive reading. Sample #4 (9.7 CFU mL−1) was incubated at 37 °C for 24 h without adding any additional substrates, and tested with the same system, which is labeled sample #6 in Figure 7. The estimated CFU was 6.8 × 10⁶ CFU mL−1, indicating the positive presence of E. coli, and subsequently eliminating the possibility of false-positive reading for sample #4 (9.7 CFU mL−1).

E. coli assays for field water samples. Each bar represents an average of three different experiments. Error bars are standard deviations. The CFU per unit volume (CFU mL−1) were estimated from a standard curve: I/I0 = 0.039 log (E. coli CFU mL−1) + 1.08, available in the supplementary information.
Conclusion
We have demonstrated that the antibody-conjugated particles can be stored in a 4 °C refrigerator for at least 4 weeks and even as a powder form in room temperature on lyophilization. The optimum antibody coverage on surface should be determined by the type and the size of the target. We also fabricated a lab-on-a-chip device that does not require photolithography and internal or external pumping (electroactuation or syringe pumping). This chip was then integrated with an automatic sampling system using drip emitters, which generated the same volume of droplets (70μL) regardless of pressure. The developed system was successfully tested for E. coli presence in field water samples. The proposed system has a strong potential to be connected to a pressurized water system and used for field assays of waterborne pathogens. The system can also be used to construct a sensor network system over a wide variety of water distribution system, including those for drinking, processing, irrigation, and wastewater.
Acknowledgments
The authors thank Mr. Brian C. Heinze for his discussion on light scattering detection and Mr. Charlie De Fer for his help in using a milling machine, both in Department of Agricultural and Biosystems Engineering at the University of Arizona. The authors also thank Dr. Jae-Young Song at National Veterinary Research and Quarantine Service (NVRQS), South Korea, for helpful discussion on this project. Funding for this research was provided by NVRQS, award no. C-AD14-2006-11-00.
Competing Interests Statement: The authors certify that they have no relevant financial interests in this manuscript.
Supplementary Information
Supplementary data associated with this article can be found, in the online version, at 10.1016/j.jala.2010.01.011