
Abstract
Screening biological readouts in cell culture are increasing in frequency and throughput. In such assays, cell types may be rare and reagents or compounds may be expensive often resulting in a reduced number of conditions and/or replicates. “Tubeless” microfluidics offers a method to reduce this burden, as has been previously shown. In addition the In-Cell Western (ICW) has recently been adapted to microfluidic cultures allowing high throughput analysis of immunocytochemistry in microfluidic channels. Combining automated liquid handling in tubeless microfluidics with the ICW provides rapid and quantitative high throughput cell-based screens. Here, we validate this platform using three parameters: operational robustness (pipetting reliability), cell seeding consistency, and cell staining consistency (both nuclear and antibody). Integration of liquid handling with microfluidics was found to be more than 97% operationally robust. Cell seeding consistency between each microchannel and within each microchannel was found to be within a standard deviation of less than 5% and 6%, respectively. Finally, through optimization of liquid handling steps, uniformity among all the channels was found for both nuclear and antibody staining. These results lay the foundation to perform most standard ICW assays using automated tubeless microfluidics.
Keywords
Introduction
As high-throughput screening (HTS) is increasingly being applied to cell-based screens, the need for optimization of individual assays is important. 1,3 The demand for higher throughput has increased the number of wells per plate and significantly reduced well size. This miniaturization has led to reduced reagent volumes and increased surface-area-to-volume ratio of the wells, exacerbating evaporation and edge effects that increase background and reduce signal-to-noise ratios. 4,5 Additionally, the small well volumes can be problematic for washing and volume replacement.
Microfluidic techniques are emerging as a possible way to address these issues, yet most systems require extensive and specialized tubing, connectors, equipment, and expertise; thus, making these systems difficult to integrate with existing infrastructure. 6,7 Tubeless microfluidics operated via passive pumping offers the ability to perform fluid manipulation with a single pipette, multichannel pipette, or automated liquid handler (ALH), thereby, easily interfacing with the existing infrastructure of biology and HTS laboratories while retaining unique microfluidic functionality such as laminar flow (Fig. 1). In short, tubeless microfluidic devices consist of a channel region of various geometries (here a straight channel) with two or more ports connecting the channel to the atmosphere (here two ports at either end of the channel were used). The fluid contents of the channel can be replaced using passive pumping that operates via surface tension differences among droplets of different size on the ports. Pumping will occur point to point from the placement of a small drop (typically 1–5 μL) to an existing larger drop (i.e., 5–15 μL) (Fig. 1D). Previously, we have demonstrated the principle of tubeless microfluidics and have shown improved treatment performance and washing over traditional well plates. 1,8 –10
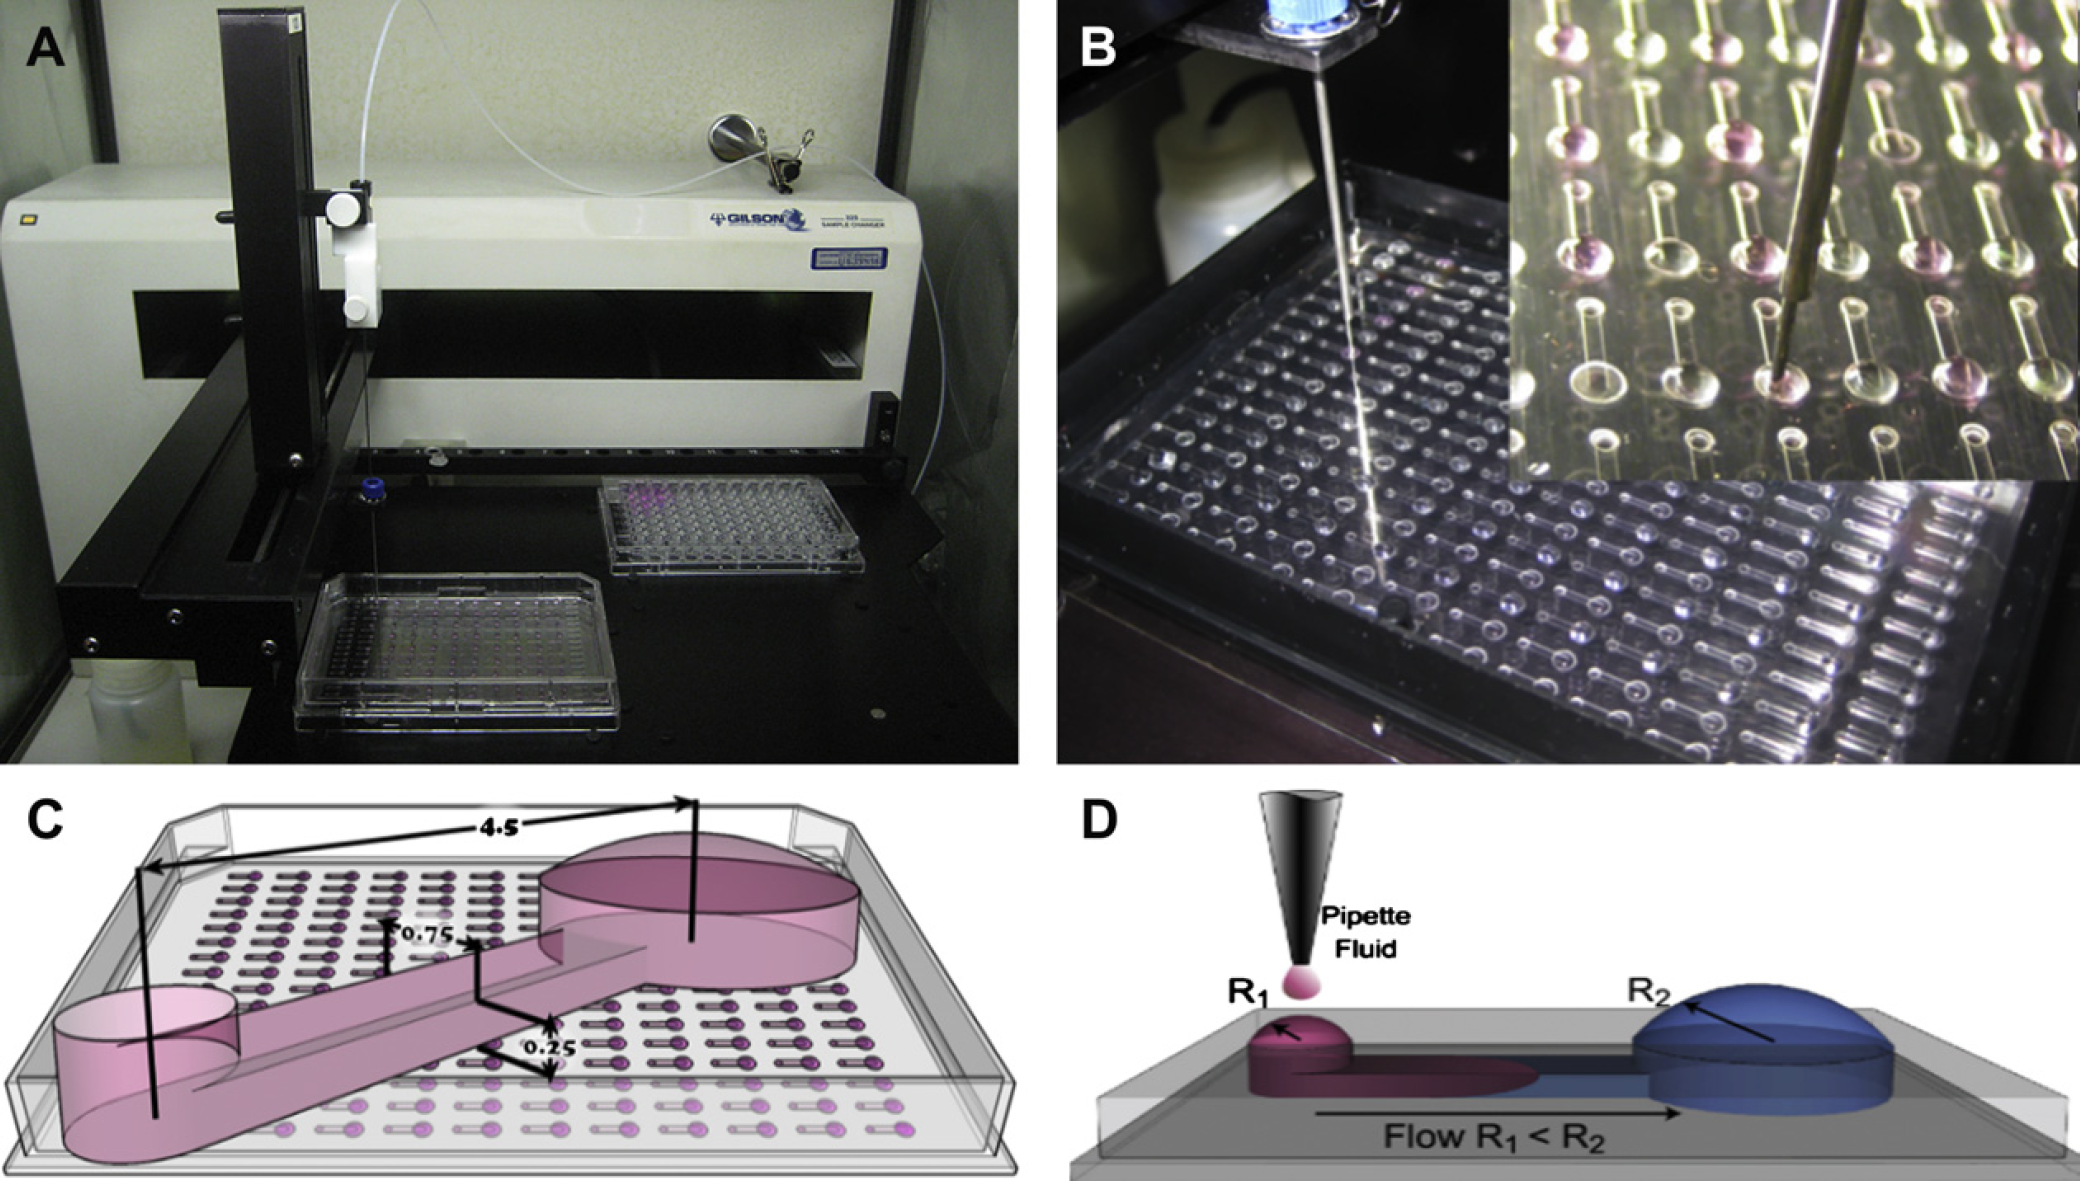
A) The automated liquid handler (ALH) used showing the microchannels (front left) and 96-well plate reservoir (back right). (B) The ALH dispensing output drops to the microchannels. (C) Schematic of the array with one channel superimposed showing dimensions (4.5 L × 0.75 W × 0.25 H [mm]). (D) Schematic of passive pumping.
To date, despite the advancement of microfluidics, few have been integrated with the current state of the art in laboratory automation. Although some work has been done to integrate the analysis of microfluidic culture with plate readers or other analysis tools, 2,11,12 other microfluidic high-throughput assays require specialized equipment not typically found in biology laboratories such as arrays of microwells separated by pump-actuated valves, flow-based systems, and droplet-based systems. 7 The need for simple integration with liquid handling is clear. One such system designed for analysis, integrated their gravity-driven flow device containing eight chambers with a total volume of 30 L per chamber/reservoir with automated liquid handling for performing enzyme-linked immunosorbent assay on chip. 13
Here, we validate the tubeless microfluidic platform for performing complete, reliable, and repeatable cell-based biological assays, from culture to analysis, using automated liquid handling and automated analysis. Fluidic manipulation in the microchannel array (containing 192 channels) was performed using a single-pipette ALH (Fig. 1). Three criteria were examined. First, robustness of fluid handling and manipulation for each operation (dispensing and aspirating) on every channel was studied for failures. Second, cell seeding in an array was imaged for consistency in cell number. Third, all steps in a typical cell biology endpoint assay (fixing and staining) was performed by the ALH and verified via automated In-Cell Western (ICW) analysis and optimized to minimize error.
Materials and Methods
Microchannel Array Fabrication
Microchannels with channel dimensions of 5.75 L × 0.75 W × 0.25 H (mm) and a volume ∼1 μL were fabricated in polydimethysiloxane (PDMS) from an SU-8 master mold using standard multilayer rapid prototyping techniques. 14,15 Microchannel ports were spaced 4.5 mm center to center to conform to a 384-well plate standard with the input port diameter of 0.75 mm and output port diameter of 1.5 mm (size difference facilitates passive pumping). Channels were removed from the master mold, autoclaved, and laid into an OmniTray (Nunc, Rochester, NY). The channels were initially filled with Dulbecco's Modified Eagle's Medium (DMEM, Gibco, Grand Island, NY) via vacuum filling. 1
Cell Culture
Cells were cultured in flasks before use in the microchannels. A normal murine mammary gland epithelial cell line (NMuMG, ATCC) was maintained in culture medium (CM): DMEM, with 10% fetal bovine serum, and 10 μg/mL insulin. Before use in the microchannels, the NMuMGs were trypsinized, counted, spun down at 1000 rpm for 5 min (5417C, Eppendorf), and resuspended to a final concentration of 1.7 million cells/mL (yielding a cell seeding surface density of ∼400 cells/mm2).
Liquid Handling
For each experiment, the following preparation steps were taken. The ALH was sterilized in a hood under ultraviolet (UV) for 20 min, at the same time, the tip (stainless steel) and tubing (fluorinated ethylene propylene—nonreactive and UV resistant) were rinsed with 70% EtOH by the ALH before working with live cells. A 96-well plate was prepared with three wells containing CM and two wells with cell suspension (maintained on the ALH via a micro stir bar). 3,16 A rigid circular transparency film with a central hole for the ALH tip was used as a cover for the microchannel plate to limit evaporation while on the ALH.
Every fluidic manipulation to the microchannels was performed with a single-pipette ALH (223 sample changer and 402 syringe pump with a 250-μL syringe, Gilson, Middleton, WI). Fluidic manipulations are summarized in Figure 2. For cell seeding, the ALH first dispenses 4 μL of CM to the output of every channel to act as a reservoir drop for passive pumping. Then the placement, by the ALH, of a 2-μL drop of cell suspension to the input of the channel results in the replacement of the channel contents via passive pumping, thereby seeding cells. 8 Lastly, the ALH aspirates 2 μL from the output to maintain the 4-μL output drop size. The micro-channel plate was then placed in a BioAssay dish (corning) containing phosphate-buffered saline (PBS) to limit evaporation and osmolarity shifts and then incubated at 37 °C with 5% CO2 (CM was replaced every 24 h using the ALH).
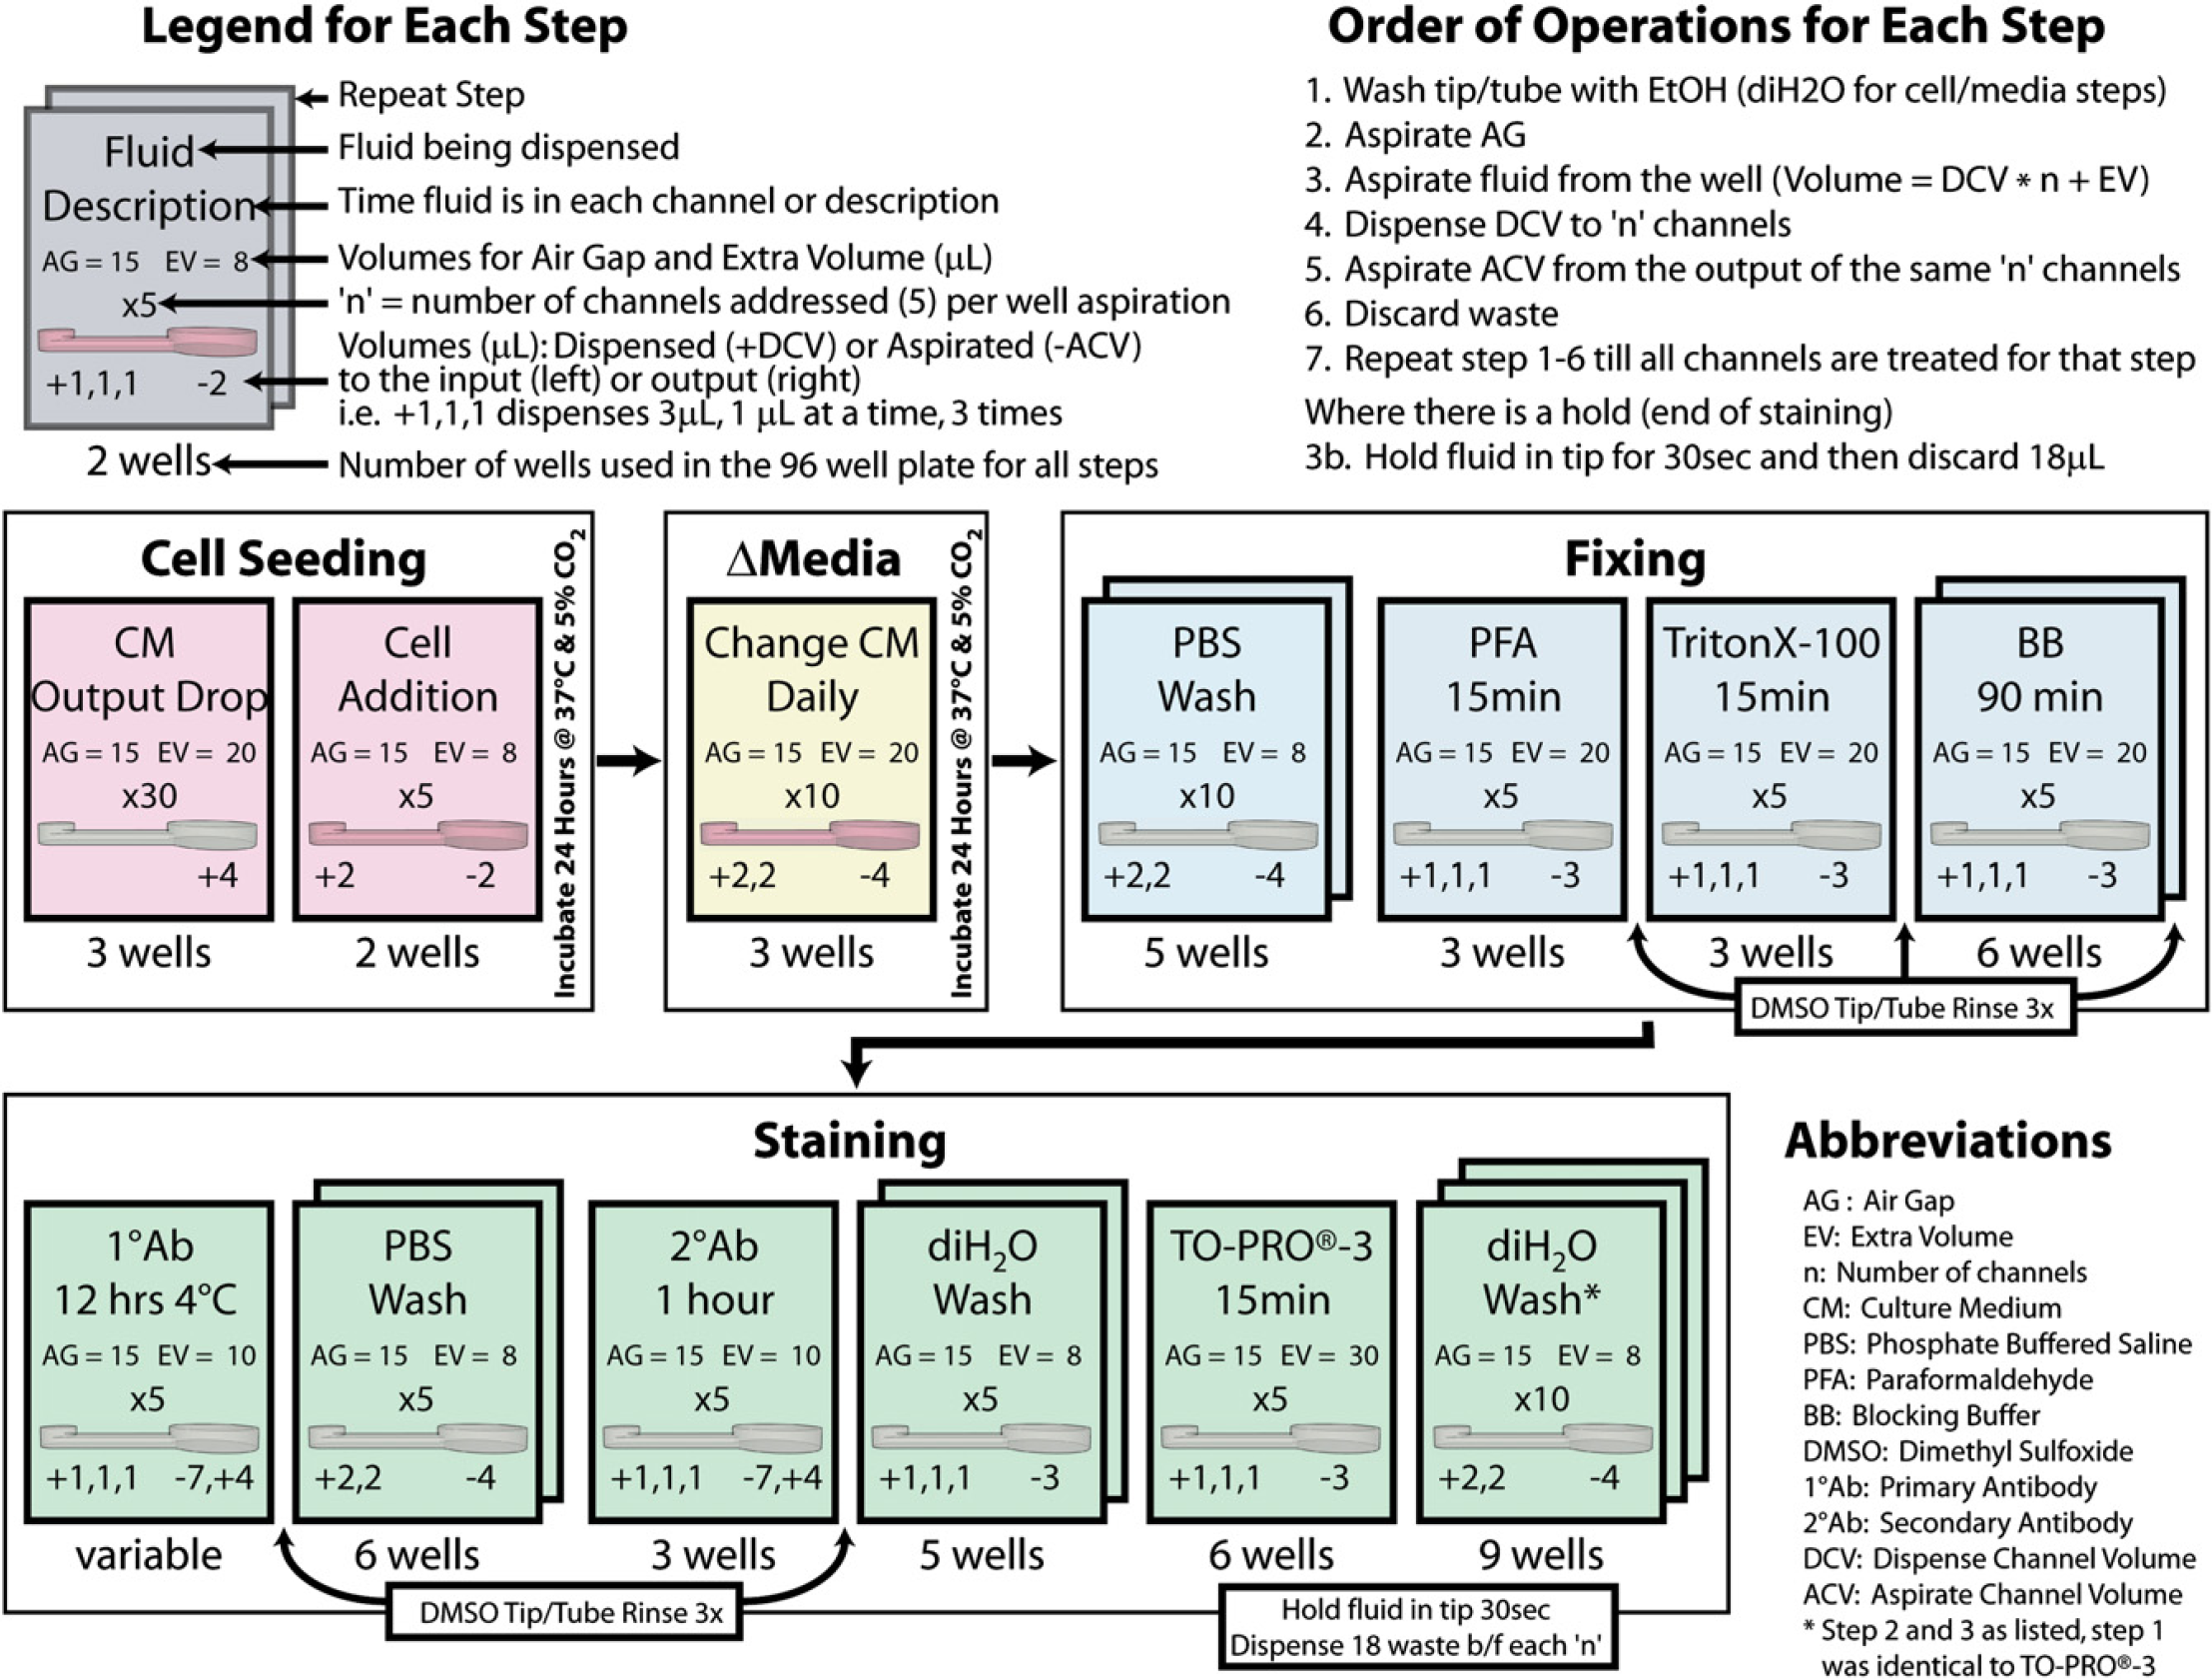
Flow diagram depicting the sequence of robotic manipulations during the entirety of an experiment.
Endpoint staining was also performed via the ALH. The following is summarized in Figure 2. The duration of each step is ∼12 min. Cells were washed twice with PBS, fixed via 4% paraformaldehyde (PFA), permeablized via 0.1% Triton X-100, washed twice with blocking buffer (BB, LiCOR, Lincoln, NE), (where antibody staining was done: incubated overnight at 4 °C with primary antibody, washed twice with PBS, and incubated for 60 min with secondary antibody), washed twice with diH2O, stained with 1:500 dilution TO-PRO-3 (a cyanine nucleic acid dye) in 0.1% Tween-20 (Sigma) in PBS for nuclear stain, and then washed twice with diH2O. For all staining experiments, 90 micro-channels were used, 10 of which were controls (no-cell and no primary antibody).
The custom method designed using the ALH program (Trilution 1.2, Gilson) has three key parameters that play a critical role in the cell-based assay characterization in the microchannel array: (1) “air gap (AG),” (2) “extra volume (EV),” and (3) “number of channels.” The first two parameters, the AG and EV, are standard variables for dispensing with this system. Before obtaining the solution to be dispensed, the ALH will aspirate an AG that separates the fluid (diH2O or EtOH) always in the tube from the solution to be dispensed (AG too large: results in inaccurate pumping because of compression of the air and AG too small: may result in mixing between the solutions in the tube). Next, the ALH aspirates fluid from a well. The volume it aspirates is the volume required for dispensing a specific volume a given number of times plus an EV. As the ALH pump has an accuracy of ±0.5%, the EV insures that each dispense will contain the solution. The third parameter, a custom variable was created, “number of channels” (n), which determines how many channels will be treated sequentially from one well aspiration. The range used was 1–15, where for a value of five (denoted: x5), the ALH will aspirate the AG, aspirate from the 96-well plate the volume needed for five channels plus the EV, dispense to each of the five channel inputs, immediately go back and aspirate that same volume from the five channel's output, and then run a tip wash sequence (drain the volume/air in the tip and aspirating/dispensing 70% EtOH through the entire tube/tip). The process then starts over for the next five channels, until all channels are treated. This sequence minimizes cell settling in the tip/tube, ensures that during fixing and staining each channel has been treated for the same amount of time when different conditions are used, and minimizes diffusion from the output back into the channel.
Data Acquisition and Analysis
Relative cell number analysis was done using two methods, phase contrast imaging and ICW infrared (IR) scanning (Odyssey, LiCOR). Phase contrast images provided a standard for comparing the results from the IR scanned nuclear intensity for validation purposes. Three images were taken along the length of the microchannel at 10x magnification. A custom NIH-ImageJ (v1.4, http://rsbweb.nih.gov/ij/) macro was designed to seamlessly stitch the batch of images for each microchannel. A second macro cropped each image such that only the channel region remained. Two methods were used to quantify “cell number” per channel: manual and automated. Manual cell counts provided exact cell number per channel. These counts were obtained from the stitched/cropped images with assistance from a custom ImageJ macro that cycles though the images drawing a grid on each, similar to a hemocytometer. Automated cell counting was also done using fixed cells stained with 4′,6′-diamidino-2-phenylindole (DAPI) and a custom ImageJ macro. Automated cell confluence measurements were taken from analysis of phase images processed with a custom a MatLAB entropy filter to threshold the stitched/cropped images thus converting the area covered by cells to white and the area not occupied by cells to black. A custom ImageJ macro was then used to measure the cell confluence (area covered by the cells divided by the total area). All three methods of analysis (confluence, manual cell counts, and automated DAPI nuclei counts) correlated with each other when normalized; therefore, confluence measurements were used exclusively in later analysis for simplicity.
ICW IR scanning provides rapid automated analy-sis. 2,17,18 Here, nuclear staining using TO-PRO-3 (the 700 channel on the scanner) was compared with phase contrast cell number and confluence measurements. Cells were also stained for E-cadherin primary antibody (BD Biosciences, San Jose, CA) and a secondary antibody (Rockland Immunochemicals, Gilbertsville, PA) for the 800 channel on the scanner. No primary antibody controls provided a baseline for nonspecific secondary antibody staining. No cell controls were used for background subtraction. Intensities from the scanner channels were subtracted by their respective background levels. E-cadherin intensity per microchannel was then divided by nuclear intensity for that microchannel to obtain a relative E-cadherin level per cell. All analyses were conducted over the entire channel region.
Results and Discussion
Robustness and Cell Seeding Consistency
Reliability in performing general cell assays was assessed at each ALH pipetting step (as described above: cell seeding, medium changes, fixing, and staining) to the microchannels. During the entirety of the experiment, each channel was addressed for 35 individual operations (dispenses and aspirations typically 2–4 μL each). Each individual operation and all operations for a channel were evaluated as a success or failure. The standard used to be considered a success is as follows: (1) during dispensing and aspirating, the tip must not miss the port, (2) passive pumping must occur in the channel for dispenses, (3) aspirations must successfully remove fluid from the port, (4) droplets must not coalesce, (5) droplets cannot seep under the PDMS channels, and (6) droplets cannot stay on the tip. Early results revealed that precise device fabrication was critical. Problems such as clogged channel ports or delaminating of the PDMS around the edges led to most of the operational failures, yet a success rate of 93.75% over 960 channels was achieved. Nonfabrication failures typically occurred during dispensing and could be attributed to the droplet missing the port or output drops coalescing. This occurred as protein from the serum present in the medium adsorbs to the top surface of the PDMS microchannels reducing its hydrophobic nature and thereby causing the output drops to spread more across the surface. The larger output port design helps to alleviate this problem as the drop stays confined to the port area.
After fabrication improvements to reduce device failures, robustness increased to 97.28% of 810 channels and 99.92% of the 28,350 operations. The 1 in 36 channels that fail to produce a reliable result are attributed to the aforementioned spreading of droplets, here on the input port (thereby eliminating the radius of curvature difference needed between the input and output for passive pumping). In addition, some plates had significantly higher failure rates than others because each PDMS device is manually inserted into the Omnitray leading to variable alignment. When using commercially manufactured polystyrene (BellBrook Labs, Madison, WI) devices a success rate of 99.22% was achieved. Despite the presence of failures, the 50x reduction in volume used in tubeless micro-fluidics compared with 96-well plates (5 μL—channel plus output drop volume vs 250 μL—well volume) allows for an increased number of replicates and thus decreased variation while still consuming fewer reagents.
Cell culture assays are often cell density-dependent where cell—cell contacts may be necessary for cellular function. To ensure each channel was seeded within an acceptable error relative to each other, cell number per channel (counted manually) and confluence (area occupied by cells divided by total area calculated by automated analysis software) were measured. When seeding 48 channels sequentially (maximum number of channels at one time based on volume), the cell number per channel was not equal among the 48 channels, but a consistent trend was observed across the 48 channels with each experiment. Although the first five channels were uniform in cell number, the cell number began to increase for the next six channels and then slowly decrease again. This trend can be attributed to cell settling vertically in the long tip/probe compared with cell settling horizontally in the transfer tubing. For these, manual cell counts at 24 h correlated with automated confluence measurements when normalized to the maximum, therefore, future analysis used confluence measurements for simplicity. To minimize the error found in seeding 48 channels sequentially, channels were seeded five at a time to achieve an expected cell confluency of ∼30–35% (normal range for this particular cell type at this density—compared with flask culture) after 24 h. Measured cell confluence averaged 34.32% and was consistent in all of the channels having a standard deviation of 4.97% (replicates = 400 channels).
After obtaining uniform cell number in the channels, cell distribution was analyzed within the channels. Using the same confluence algorithm, each channel was divided into three rows and two columns. The rows, along the length of the channel, were to investigate effects because of the laminar flow profile. The columns, separating the input half from the output half, were to study the effect of cell settling during flow. The results from 400 channels (normalized for experimental variability) are summarized in Figure 3, where the average and standard deviation for each division is plotted and the divisions are depicted in an analyzed image. Although there is a slight trend that could be attributed to flow conditions, no significant difference was found among any of the divisions. The standard deviation in confluence of all the normalized divisions (2000 data points) was 5.91%, which inherently includes the 4.97% error from differences among channels. Therefore, cells are evenly distributed within the channel. These results validate the consistency of this platform for cell culture assays.
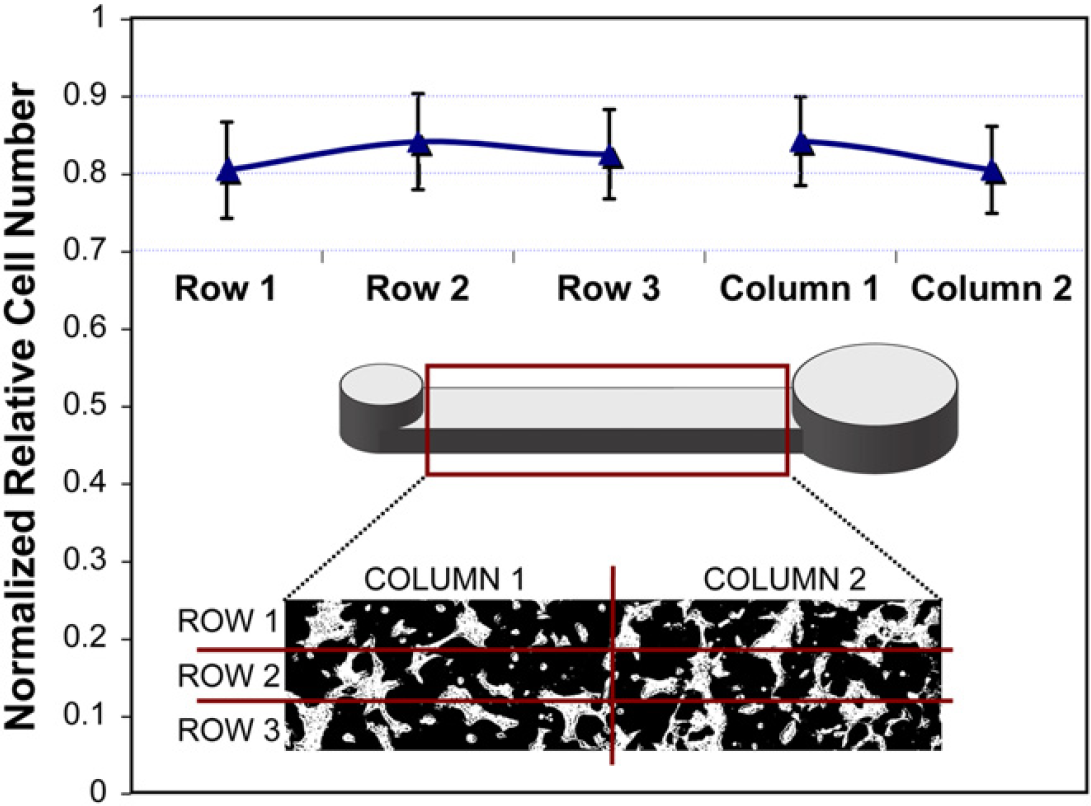
Cell distribution within the channel, each channel was divided into three rows and two columns. Confluence in each division was measured and normalized for five independent experiments (400 channels total), averaged, and the standard deviation was calculated. No significant difference was found among the divisions.
Cell Nuclear Staining Reliability and Optimization
Using an IR scanner, relative protein amounts per cell can be determined by dividing the intensity from antibody staining to a control for cell number, that is, actin or nuclear staining, in live or fixed cells while in microchannels. For this system to be reliable and accurate, staining needs to correlate to cell number across the plate of microchannels. Because of the small volume ∼1 μL of the microchannel, precisely timed and consistent volume replacement are required to ensure uniform concentration of solution in the channel and equal incubation times. To assess staining controls (nuclear stain), relative cell number per microchannel (cell confluence measurements from phase contrast images as validated in the previous section) was compared with the IR scanner TO-PRO-3 nuclear stain.
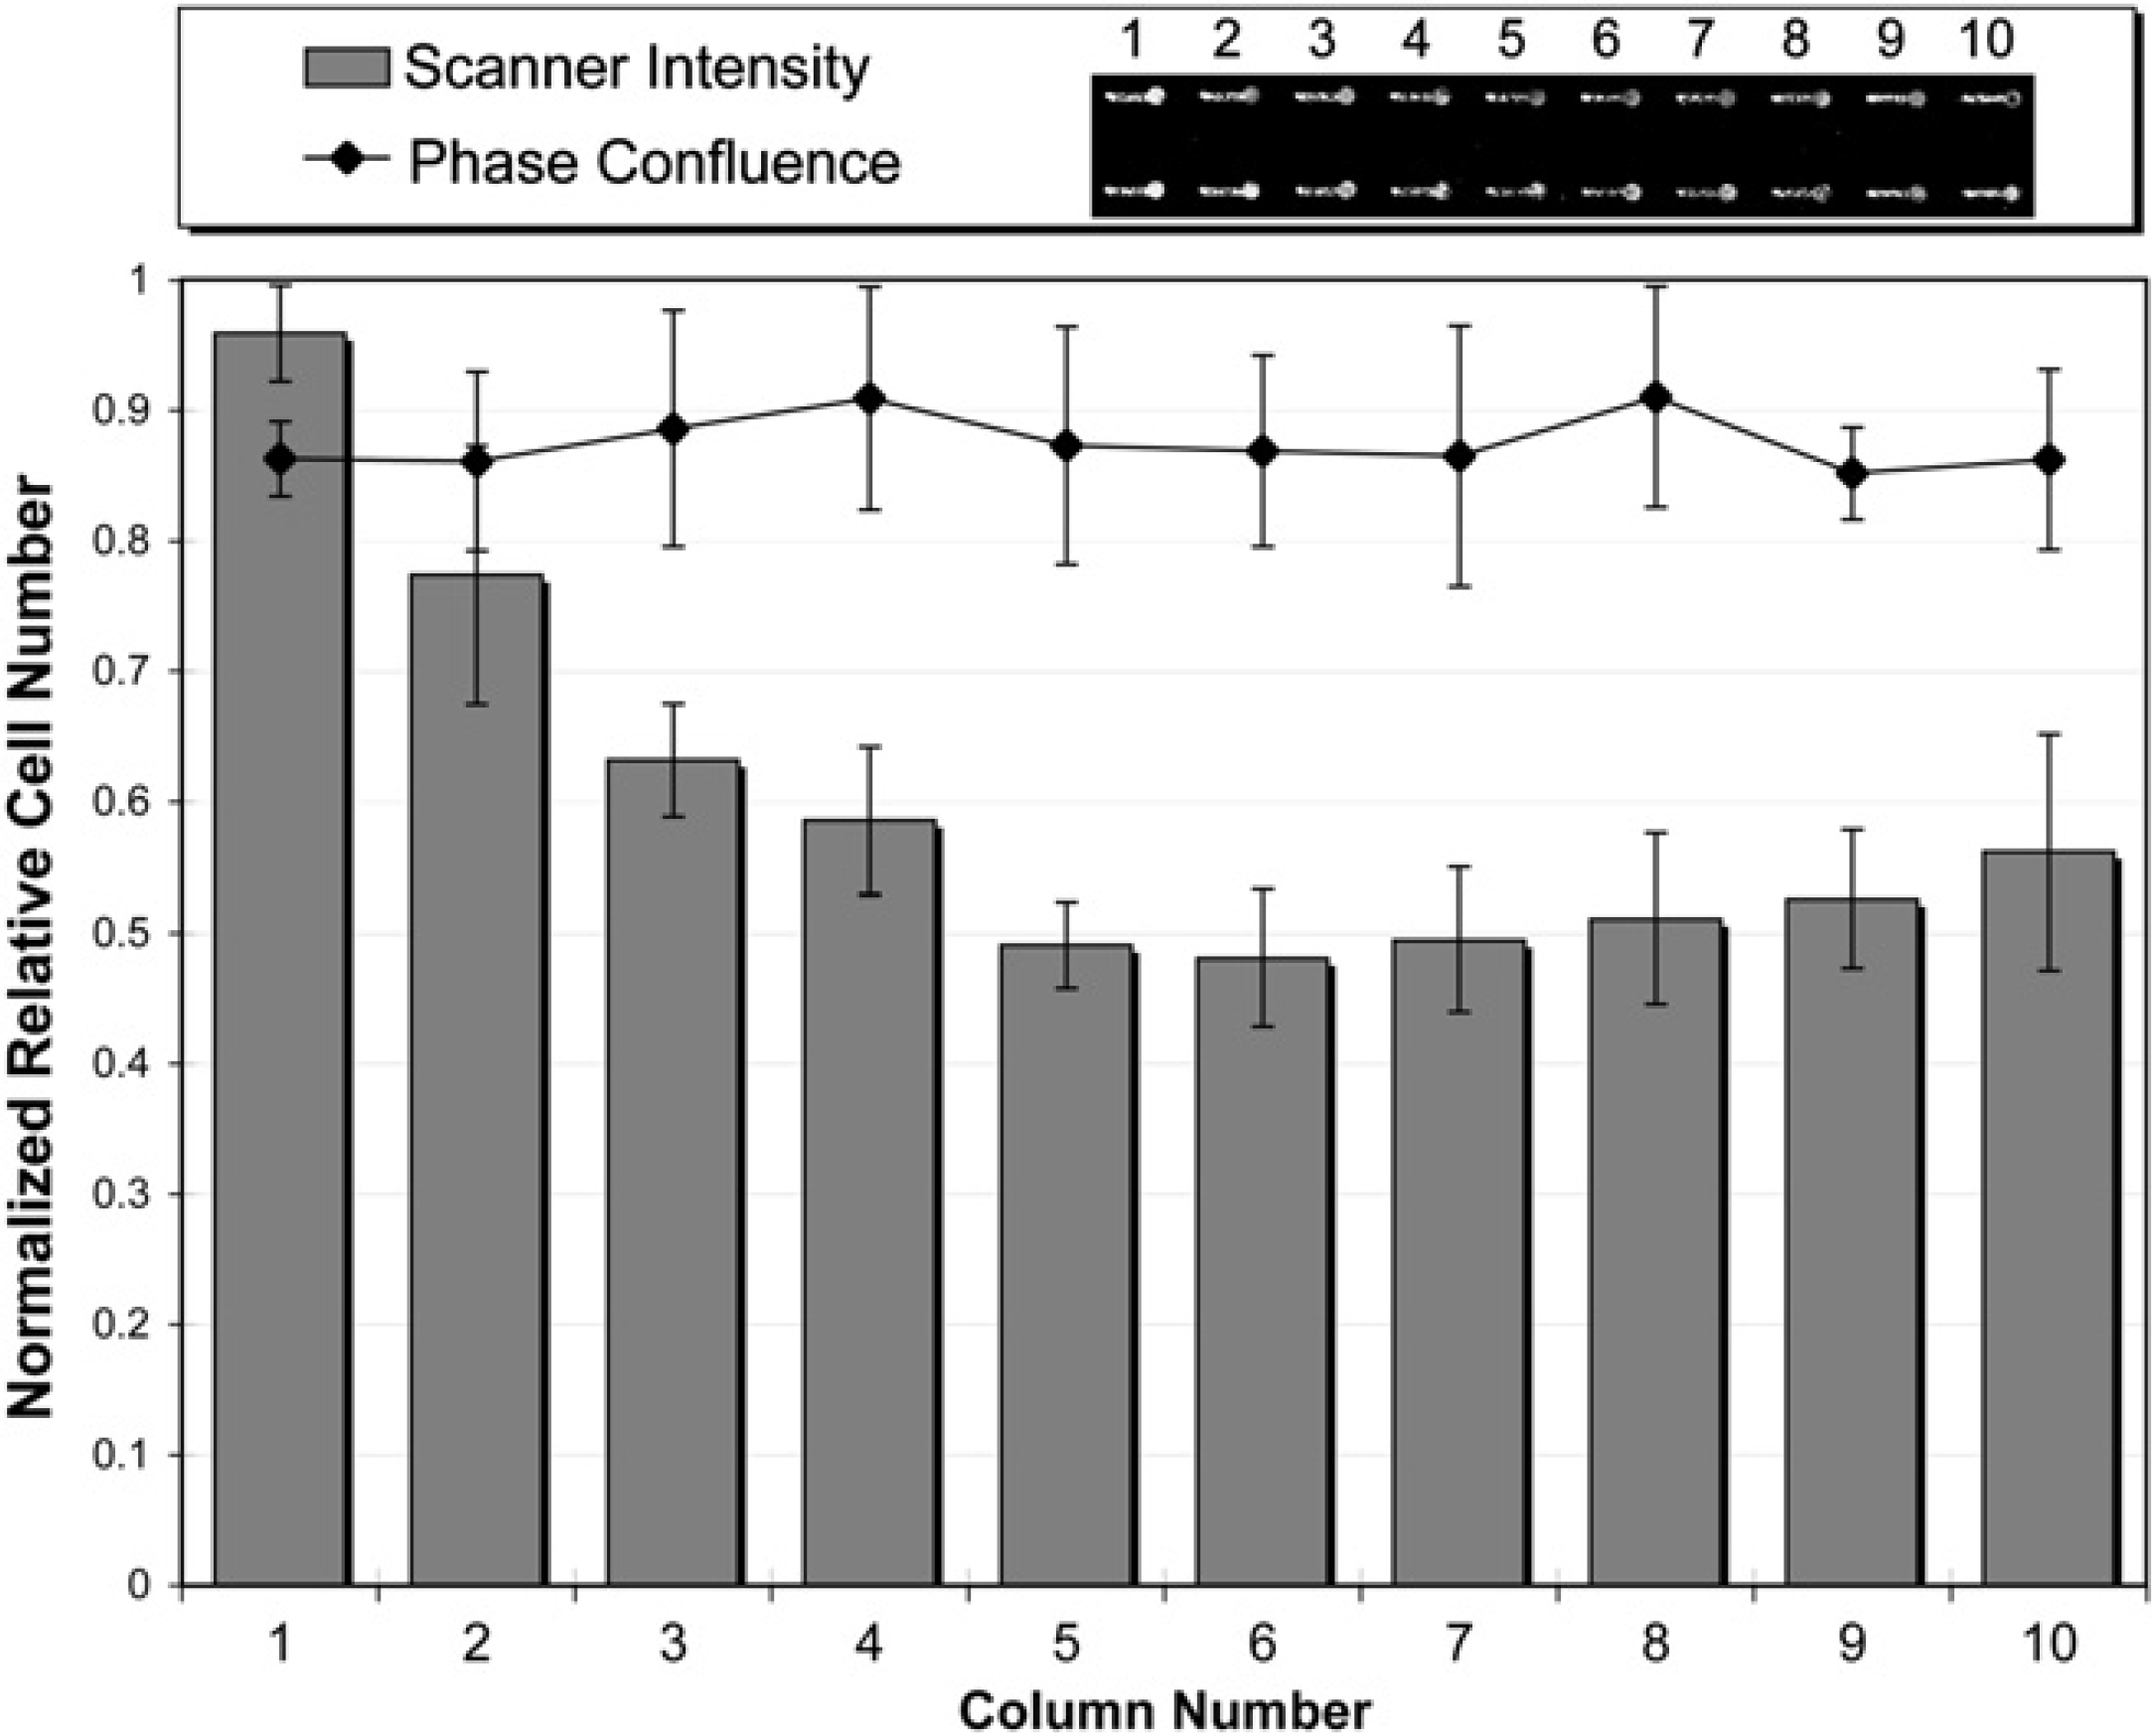
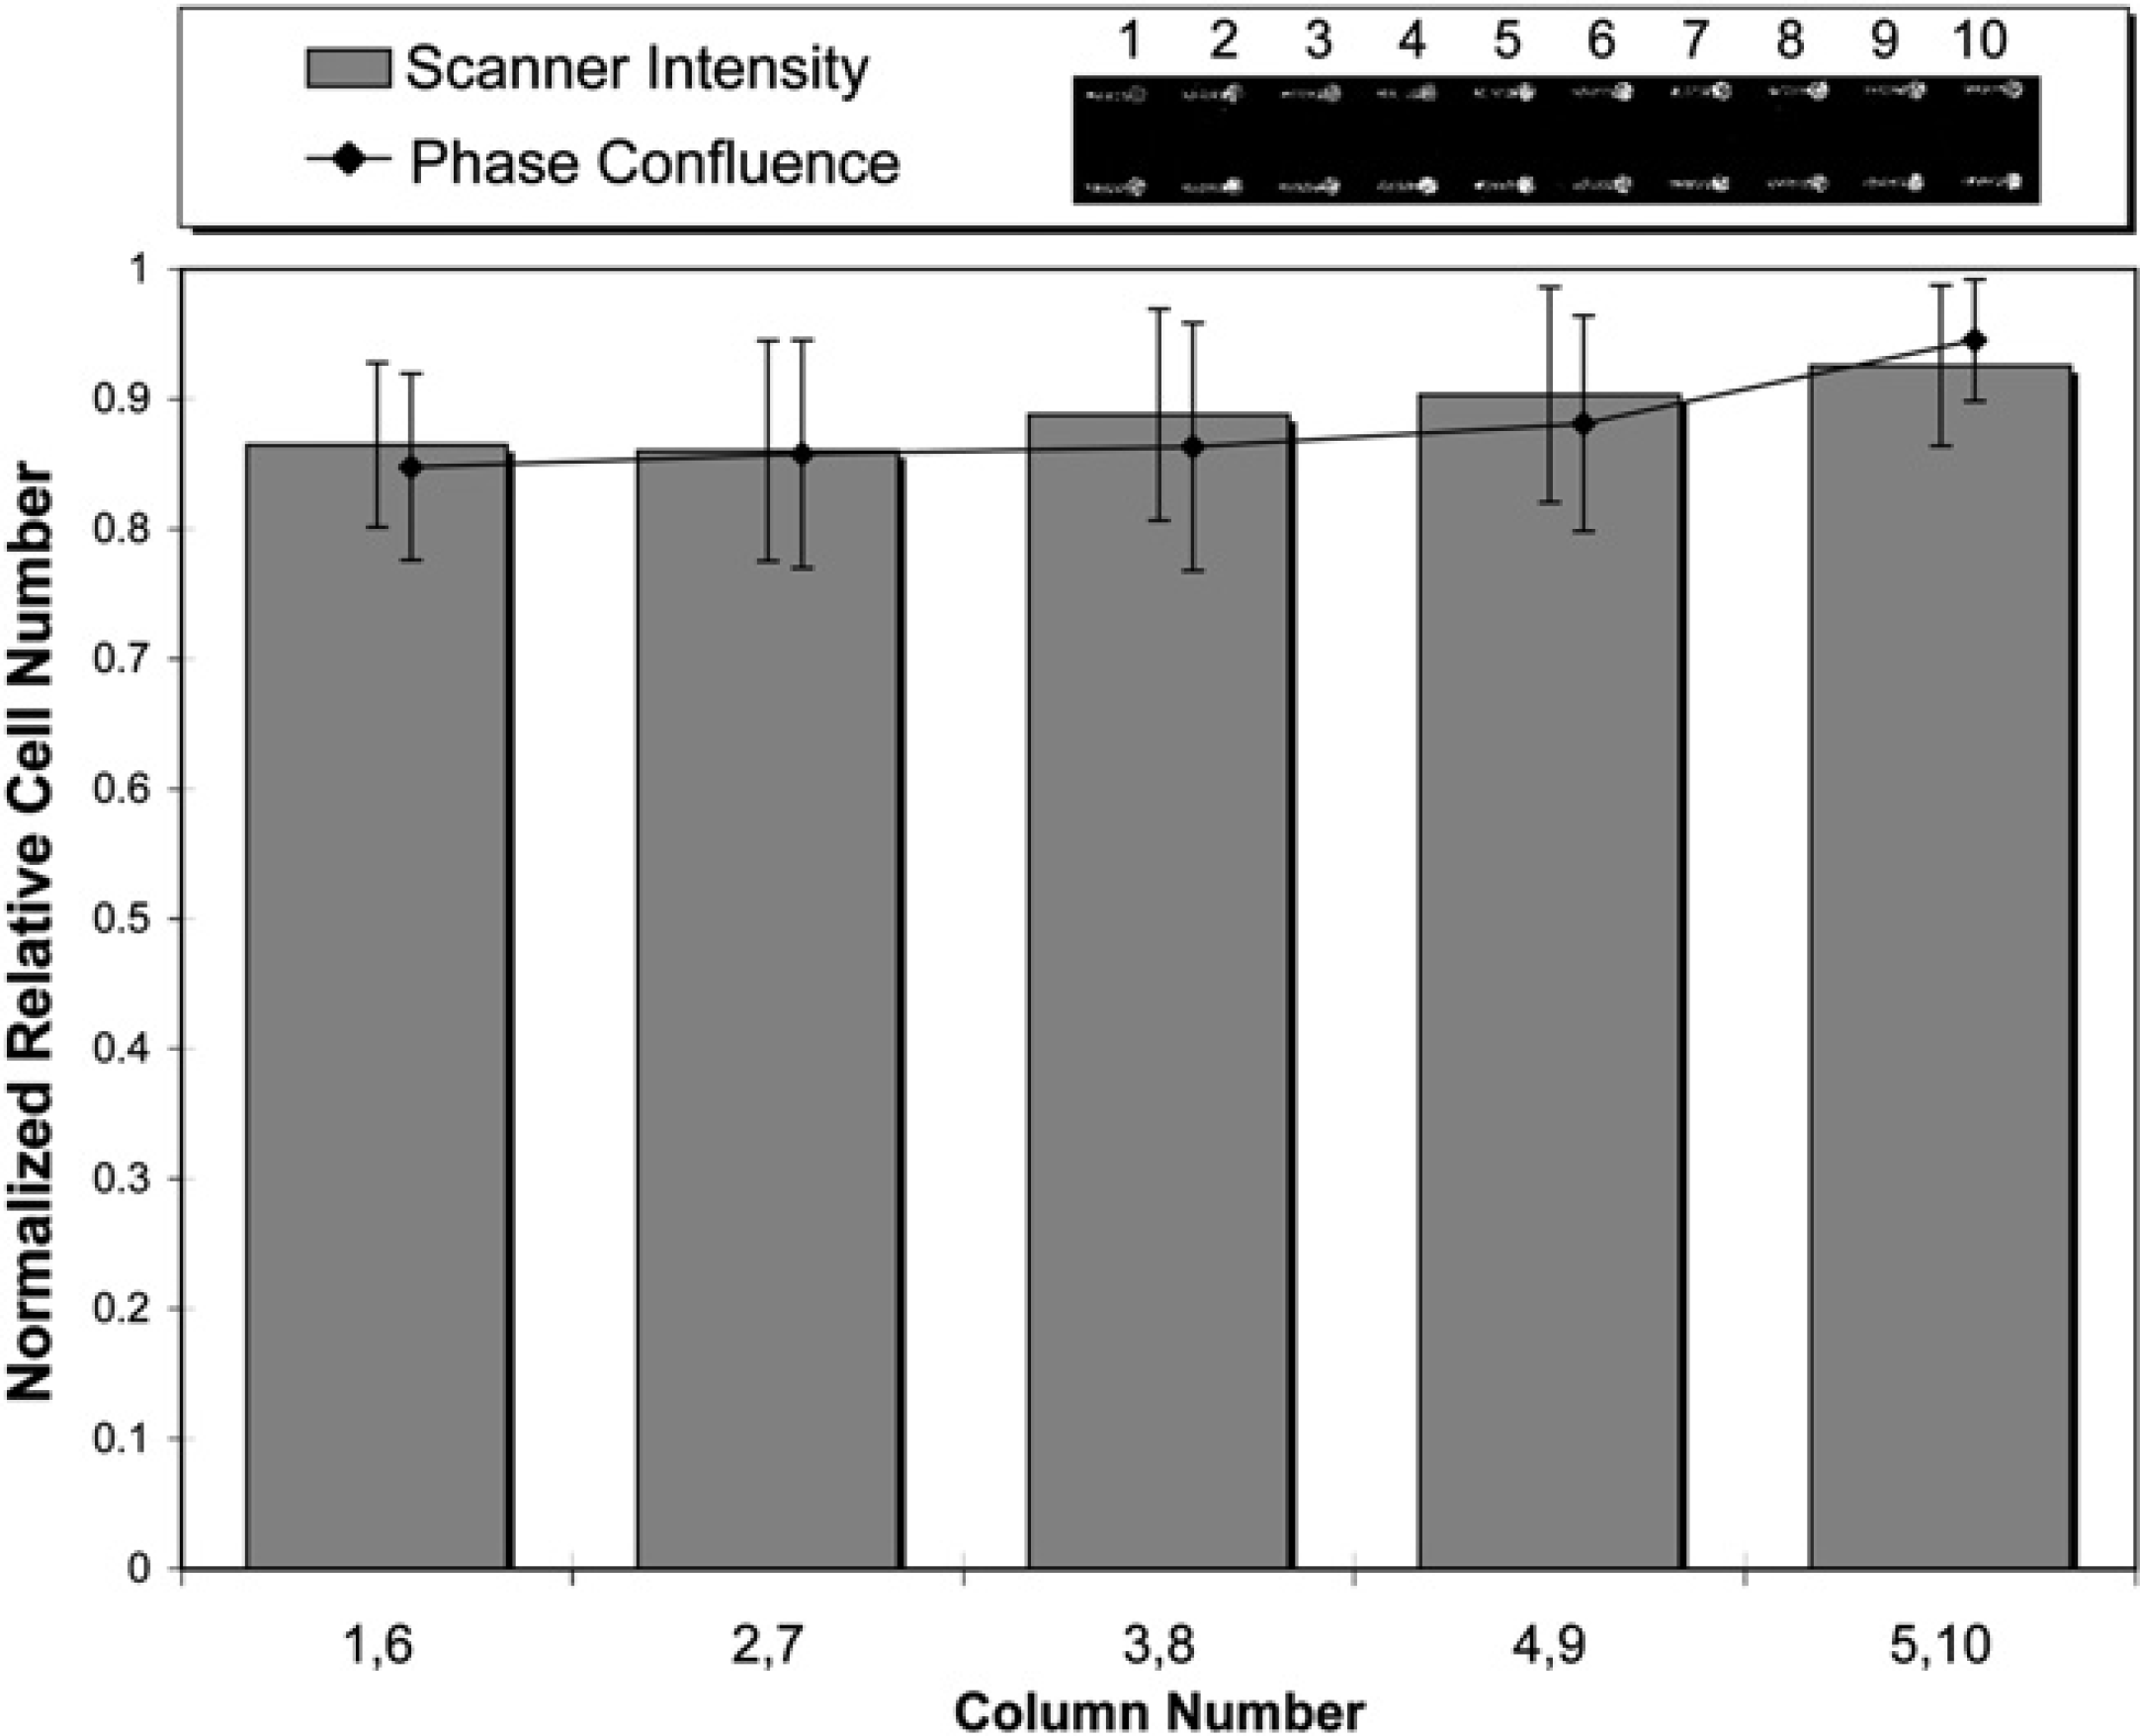
When the ALH conditions were programmed for a 10-μL AG, 7-μL EV, and × 10 number of channels, a decreasing cell number was observed on the scanner across each set of 10 channels, whereas cell number was consistent as determined by phase contrast (Fig. 4A). To ensure this was not an artefact of plate geometric inconsistency, the scanner was set to a variety of focus offsets above and below the expected focal plane of the plate. The same trend was observed, however, with a reduced intensity compared with the ideal focal plane. Repeating the same experiment with x5 number of channels, the same trend was observed with the same maximum and minimum intensities for channels 1–5 and 6–10, as were observed before for channels 1–10. Again, phase confluence measurements revealed consistent cell number among channels (Fig. 4B).
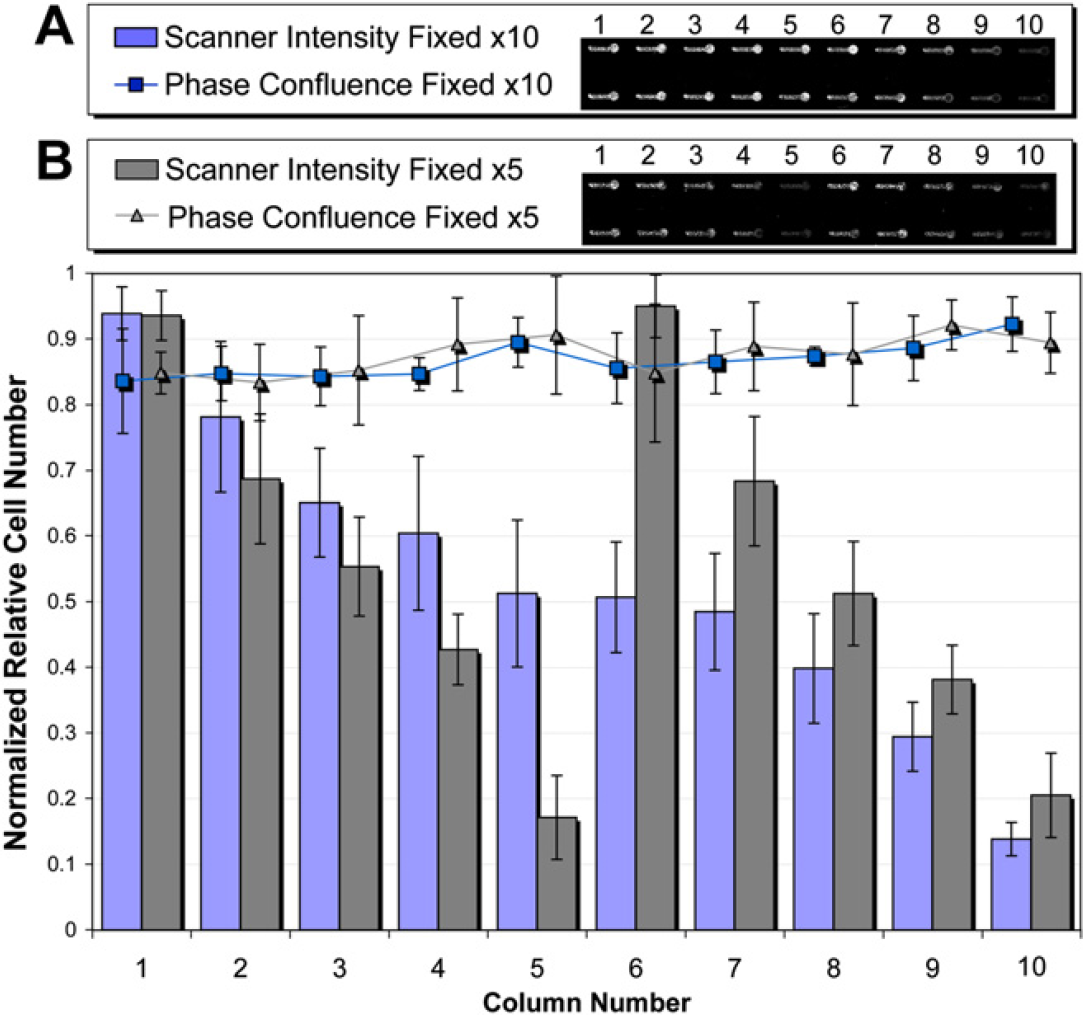
Cells were seeded x5 into 80 microchannels (8 rows and 10 columns), fixed, and stained x10 (A) and x5 (B) with an air gap of 20 μL and extra volume of 7 μL. Normalized relative cell numbers were calculated via nuclear scanner intensity TO-PRO-3 and phase contrast confluence measurements. The plot is a result from the average and standard deviation of each column of the microchannel array (8 replicates each). Two representative rows of channels were shown for both (A) where “number of channels” = x10 and (B) where “number of channels” = x5.
Because the same decreasing nuclear stain trend was found regardless of the “n” number channels, two possible hypotheses were tested: first, the concentration of the solution in the ALH pipette tip/tube was being diluted by the solution upstream of the AG (in at least the TO-PRO-3 portion of the staining) or second, the TO-PRO-3 was adsorbing to the pipette tip and/or tube, thus, decreasing its concentration over time.
On further examination of the AG during the TO-PRO-3 addition, there was a thin film of solution around the inside of the tube (not observed during cell seeding). This thin film caused fluid exchange during dispensing between the TO-PRO-3 and the EtOH in the tube, supporting the first hypothesis. To minimize error caused by this problem, two changes were made to the protocol. First, the EV was increased from 7 to 30 μL and second, three DMSO tip/tube washes were added after each solution was dispensed to the whole array during fixing/staining. The DMSO washes removed this thin film caused by the PFA, Triton X-100, or BB. The result, when n = x10 number of channels for fixing/staining (Fig. 5) showed no significant difference between columns 5 and 10 and, thus, an improvement over the previous method. However, there was still a decrease in staining in columns 1–5, suggesting that the second hypothesis, TO-PRO-3 adsorbing to the tip/tube, may also be a factor.
Cells were seeded x10 into 80 microchannels (8 rows of 10), fixed and stained x10 with an air gap of 15 μL, extra volume of 30 μL, and DMSO wash after PFA, Triton, and BB. Two rows of representative channels are shown. Values were calculated as described in Figure 4, Note, larger standard deviation in the phase confluence was due to the quality of the images. (replicates = minimum 5 for all points)
To test whether the TO-PRO-3 was adsorbed to the tip, the tip was primed with TO-PRO-3 and discarded before dispensing with the goal of obtaining the results from columns 6 to 10 in Figure 5. Priming was done by aspirating an additional 18 μL (>volume of the tip) of solution into the tip for every “n.” The priming volume was held in the tip for 30 s after which it was discarded and then the channels were filled as before. The results (Fig. 6) of the tip priming showed no significant difference between any of microchannels providing consistency in nuclear stain control. Although no direct evidence was found to verify that TO-PRO-3 adsorbed to the surface of the tip, the priming step consistently eliminated the error found previously.
Cells were seeded, fixed, and stained n = x5 into 80 microchannels (8 rows of 10), with an air gap of 15 μL, extra volume of 30 μL, and DMSO wash after paraformaldehyde, Triton, and blocking buffer. In addition, a priming step during nuclear staining was added before each n where 18 μL of TO-PRO-3 was held in the tip for 30 s then discarded before dispensing the channels. Columns from the same n iteration were averaged. No significant difference was found among any of the iterations (replicates = 16 per data point).
The above results were performed for a single cell concentration to assess that these results were consistent for a range of cell concentrations. Known variations in cell density were assessed with TO-PRO-3 on the IR scanner for linearity. Six cell seeding densities were seeded in 16 channels each, allowed to grow for 24 h, fixed, stained with TO-PRO-3, and scanned on the IR scanner. Linearity (R 2 = 0.9995) was found between cell seeding densities (15–480 cells/mm2) and IR intensity (Fig. 7).
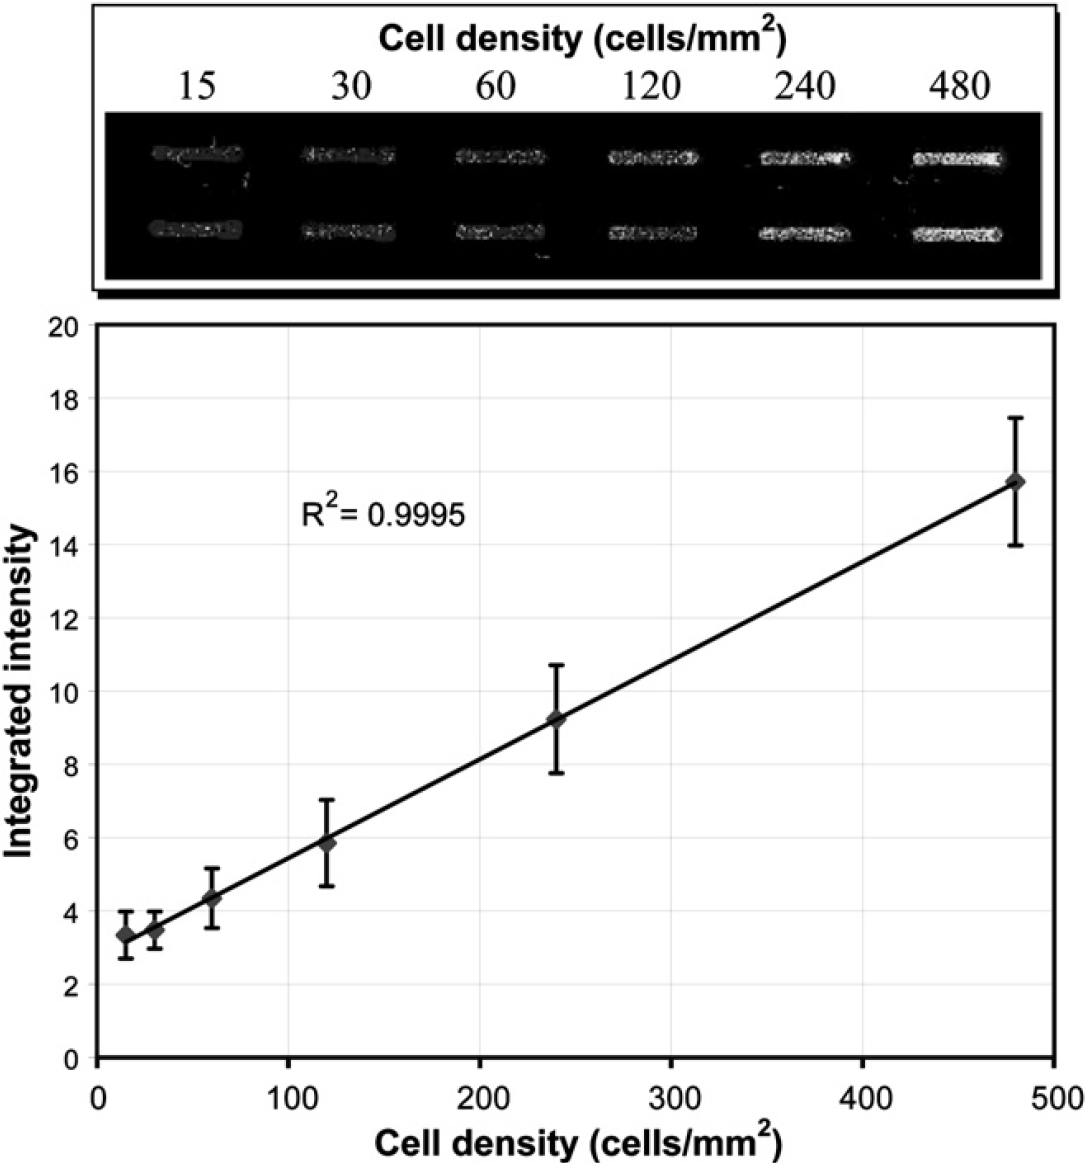
Linearity between cell seeding surface density and scanner intensity after 24 h of culture (replicates = minimum of 14 per data point, data courtesy of Xiaojing Su).
Antibody Staining Consistency
The above nuclear staining validation provides a means to normalize for cell number during a typical ICW analysis. Given the inconsistencies requiring optimization for nuclear stain, the final step to validating this technology is ensuring that antibody staining for ICWs is consistent across the plate as well. To do so, the same protocol as above was used with the addition of anti-E-cadherin primary antibody (NMuMG epithelial typically express large and consistent amounts of E-cadherin at the cell—cell junctions) and IR dye 800 secondary antibody. Across all microchannels, E-cadherin levels were found to be consistent as shown in Figure 8. For both the nuclear staining and antibody staining the parameter for number of channels (“n”) was set to five (Fig. 2). This means that the contents of every five microchannels for any step (cells, medium, or antibody) could come from a different source well without affecting the consistency found here.
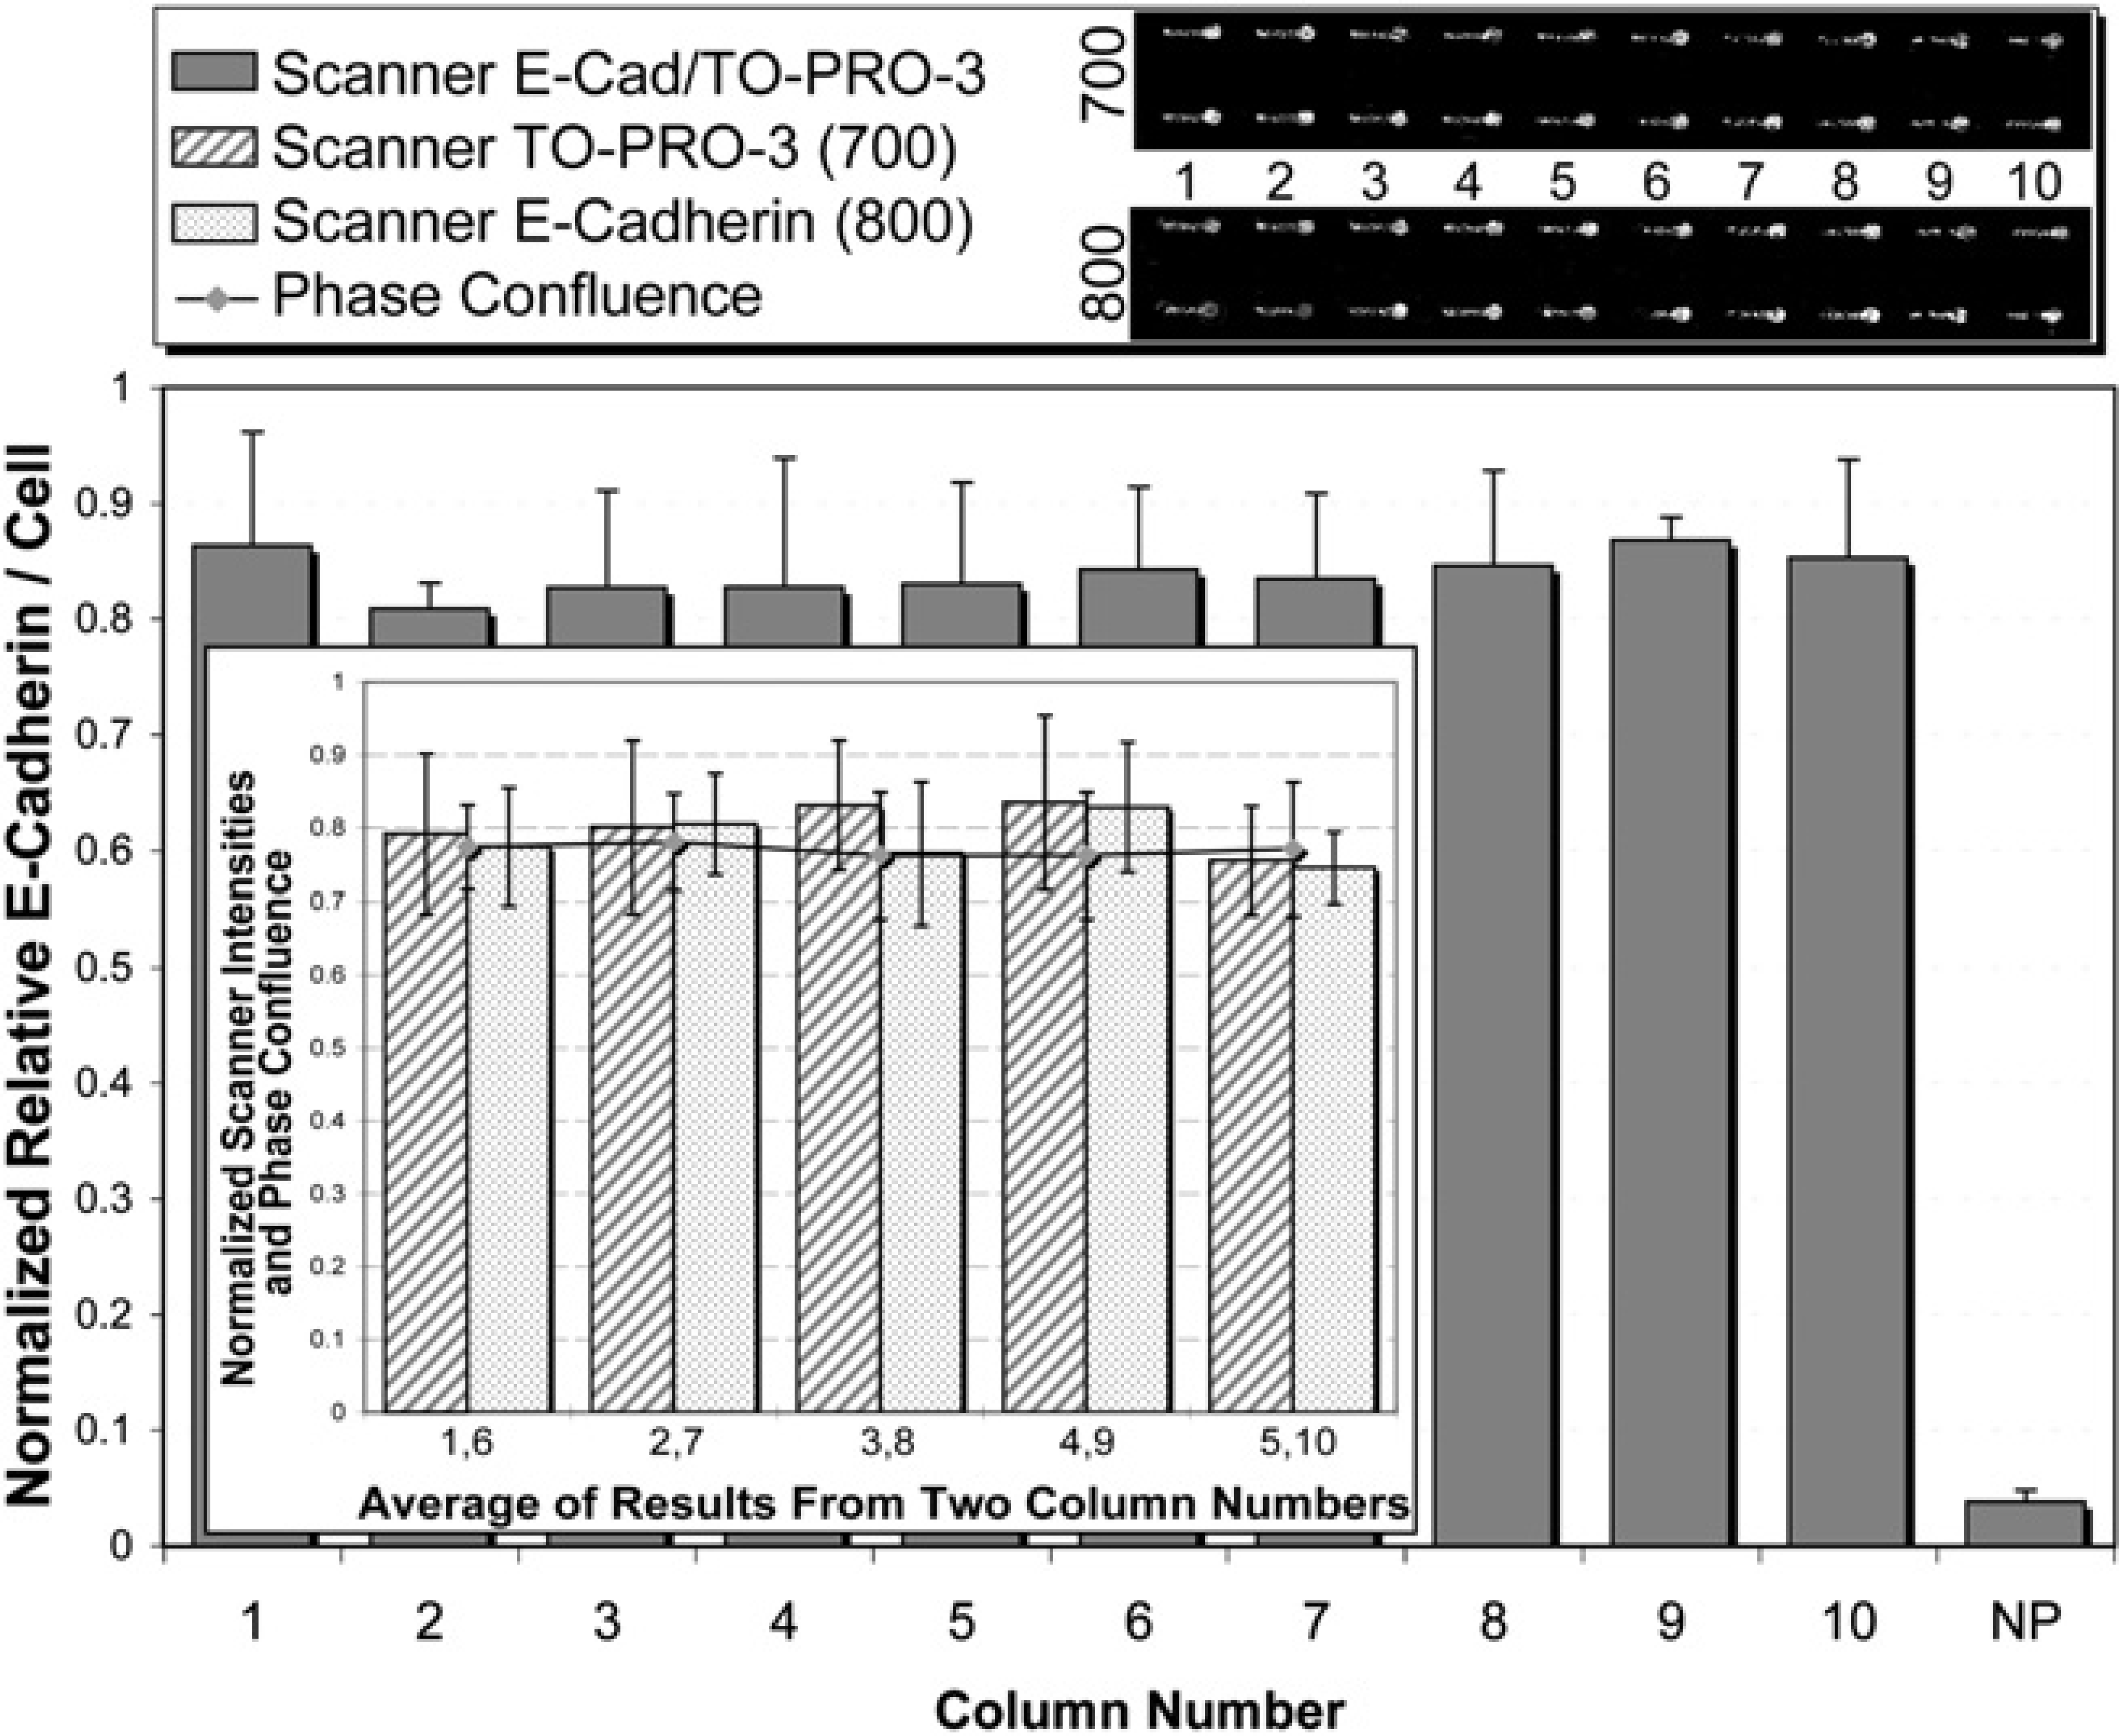
Infrared scanned relative E-cadherin levels per NMuMG cell showed consistency among all microchannels. The parameters used here are as pictured in Figure 2 where n = x5 for seeding, fixing, and staining.
Conclusion
With the growing use of high-throughput technologies, tube-less microfluidics can seamlessly interface with current state-of-the-art equipment providing the opportunity to perform new assays. Here, we have validated this technology showing robustness over 97%, consistency with cell confluence within 5% across the plate after 24 h, and uniformity in cell staining (nuclear and antibody) when performing standard biological readouts. Using this system, the unique capabilities of microfluidics (e.g., laminar flow, co-culture) can be performed in high throughput that could not previously be done in standard wells. In addition, with the reduced reagent volumes of the system (50 fold over 96-well plates) more relevant cell culture models can be used, such as primary cells or stem cells with reduced cell number (10 fold over 96-well plates).
Using the optimized parameters described here, 90 data points can be obtained on a single plate. The results indicate that the key parameter for consistency was the number of channels, “n”. The least variation among channels was found when “n” was set to five. As Figure 2 indicates, each step of the process is looped for every “n” channels; therefore, every five channels could represent a different experimental condition with five replicates per conditions totaling 18 different experiments on a plate (including controls). These could include different cell types, cell condition, that is, media compositions, or primary antibodies (assuming the antibody is specific and appropriate for ICW analysis) using the same program and order of operations without affecting the robustness or consistency. Certain reagents might have significantly different viscosity or surface tension and ultimately those will have to be optimized for passive pumping (polyethylene glycol-, collagen-, Matrigel-, and Triton-containing solutions have already been used successfully).
The ability to automate a complete biological cell-based assay in a microculture plate with such as vast parameter space yields a host of possible experimental designs. Such experiments could include a dose response to a specific factor administered during media replenishment (such as transforming growth factor-β in which E-cadherin levels would be a possible readout to quantify epithelial to mesenchymal transition), the response to various conditioned media, cyto-toxicity drug screening, or small molecule screening. The current limit on the number of end points is purely timing, based on speed of the current liquid handler. We expect similar results using all 192 channels on a multiprobe liquid handler.
Acknowledgments
The authors thank the entire MMB laboratory for their support, especially Jay Warrick for help with the entropy filter. D. J. Beebe has an ownership interest in BellBrook Labs, LLC that has licensed technology presented in this manuscript. This work was supported by the NIH K25-CA104162 and NIH R21-CA122672.
Competing Interests Statement: The authors certify that all financial and material support for this research and work are clearly identified in the manuscript.