
Abstract
This article is about how to improve the positional dispensing accuracy of low-volume (microliters) drops and to understand the factors affecting them. These same parameters can be investigated to reduce deleterious effects on dispensing performance. Many applications, such as those in immunoassay diagnostics, require accurate volumetric dispensing and are also less tolerant of other phenomena that cause the reagent to be located outside the target area of interest. In this article, we work with liquid inertia. This phenomenon is present in positional dispensing and affects its accuracy. The negative effect of liquid inertia is reduced by changing parameters such as pressure and the diameter of the involved conducts.
In dispensing equipment in which several channels, cannulas, or pipes are employed simultaneously, the process of measuring parameters is difficult when working with only a few microliters. Dispensing accuracy is obtained by using the gravimetric method, by dispensing a few microliters several times and calculating the mean value. The gravimetric method will be more or less accurate depending on the balance that is used to weight the dispensing volume.
Washing machines are pieces of dispensing equipment that are very important in the ultra-micro enzyme-linked immunosorbent assay (UMELISA) technique of ultra-microanalytical system (SUMA) technology because if the washing is not correctly performed, both the specificity and the reproducibility of the technique could be affected. If the washing is poor and inefficient, very high results will appear because the nonspecific immune reagent will remain bound to the solid phase by absorption. If the washing is very strong, it could take away the reagent bound to the solid phase, thus producing a reduction in the assay values. 1
The objective of this study was to enhance the accuracy in the positional dispensing for a volume of only a few microliters of liquid and understand some factors affecting it. Many applications, among which we find medical equipment for diagnostics, need accuracy and precision in the dispensing volume; in addition, they need accuracy in the position of the dispensing liquid on the UMELISA plate. These applications are less tolerant to splashing and other negative phenomena that take the reagent out from the target zone. 2 Improvement could be obtained by changing the parameters that have some effect on dispensing and its proper measurement. An automatic dispensing equipment, the MW 201 ( Fig. 1 ), was employed. The parameter used in the evaluation was the dispensing accuracy of each of the eight cannulas in the manifold ( Fig. 2a , 3 ). With this objective complemented, the buffer dispense in SUMA technology will be improved in the same way as the accuracy in the assay values.
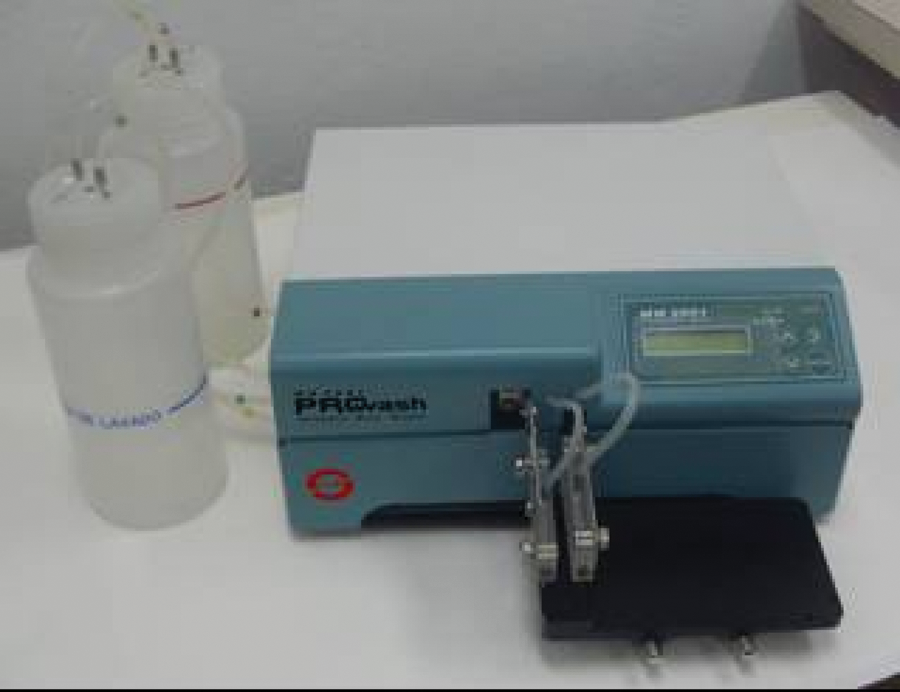
Washing machine MW 2001 Prowash.
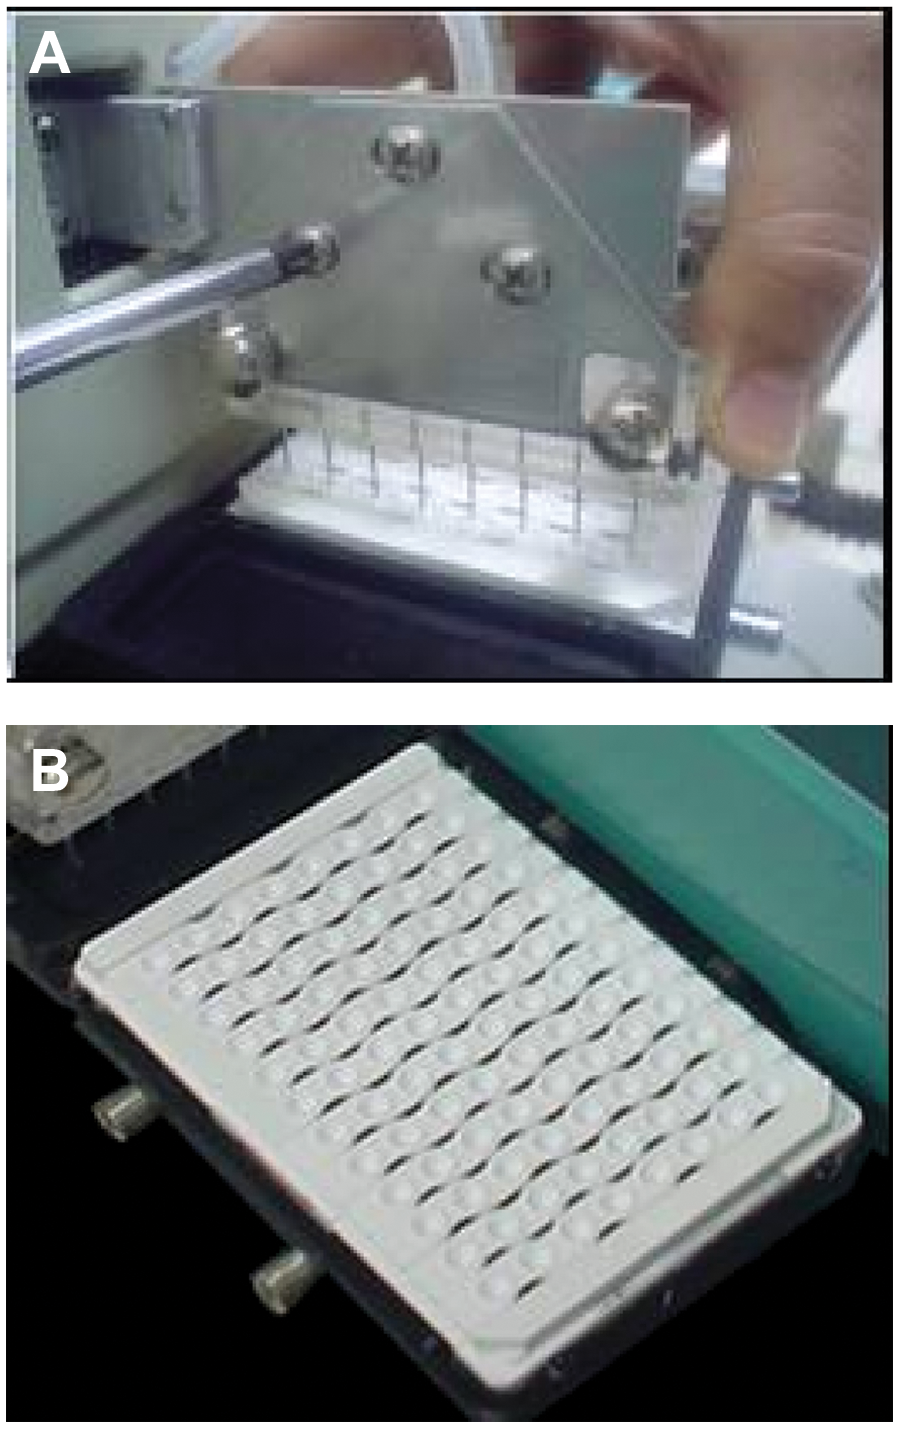
Eight-way manifold adjustment upon the plate used in the UMELISA technique (
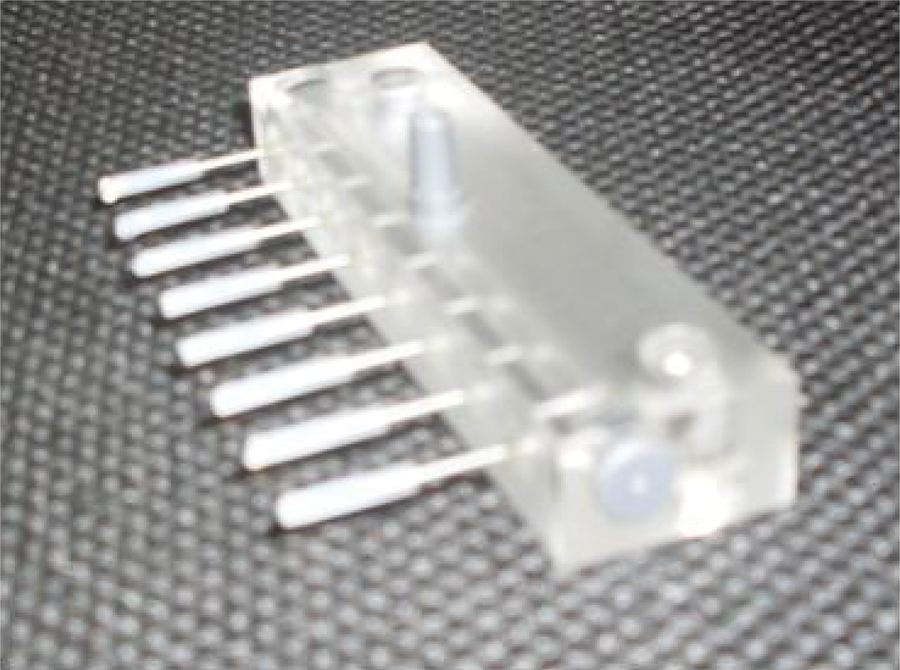
Eight-way manifold with transparent tips.
Materials and Methods
We tested the following variables:
Dispensing pressure Hose dimension (diameter) Dispensing volume accuracy in each manifold pipe
We used the following materials:
Dispensing equipment: washing machine MW 2001 Reagent: non-ionic detergent 0, 05% Tween 20 Distilled water 0.001 g to 220.0 g analytic balance 0.001 psi to 15.0 psi digital manometer Eight-way manifold with transparent tips Calibrated strips with 12 wells for each manifold cannula Microsoft Office Excel for the statistical analysis of the information recorded
Operation Principles of Dispensing in the Washing Machine MW 2001
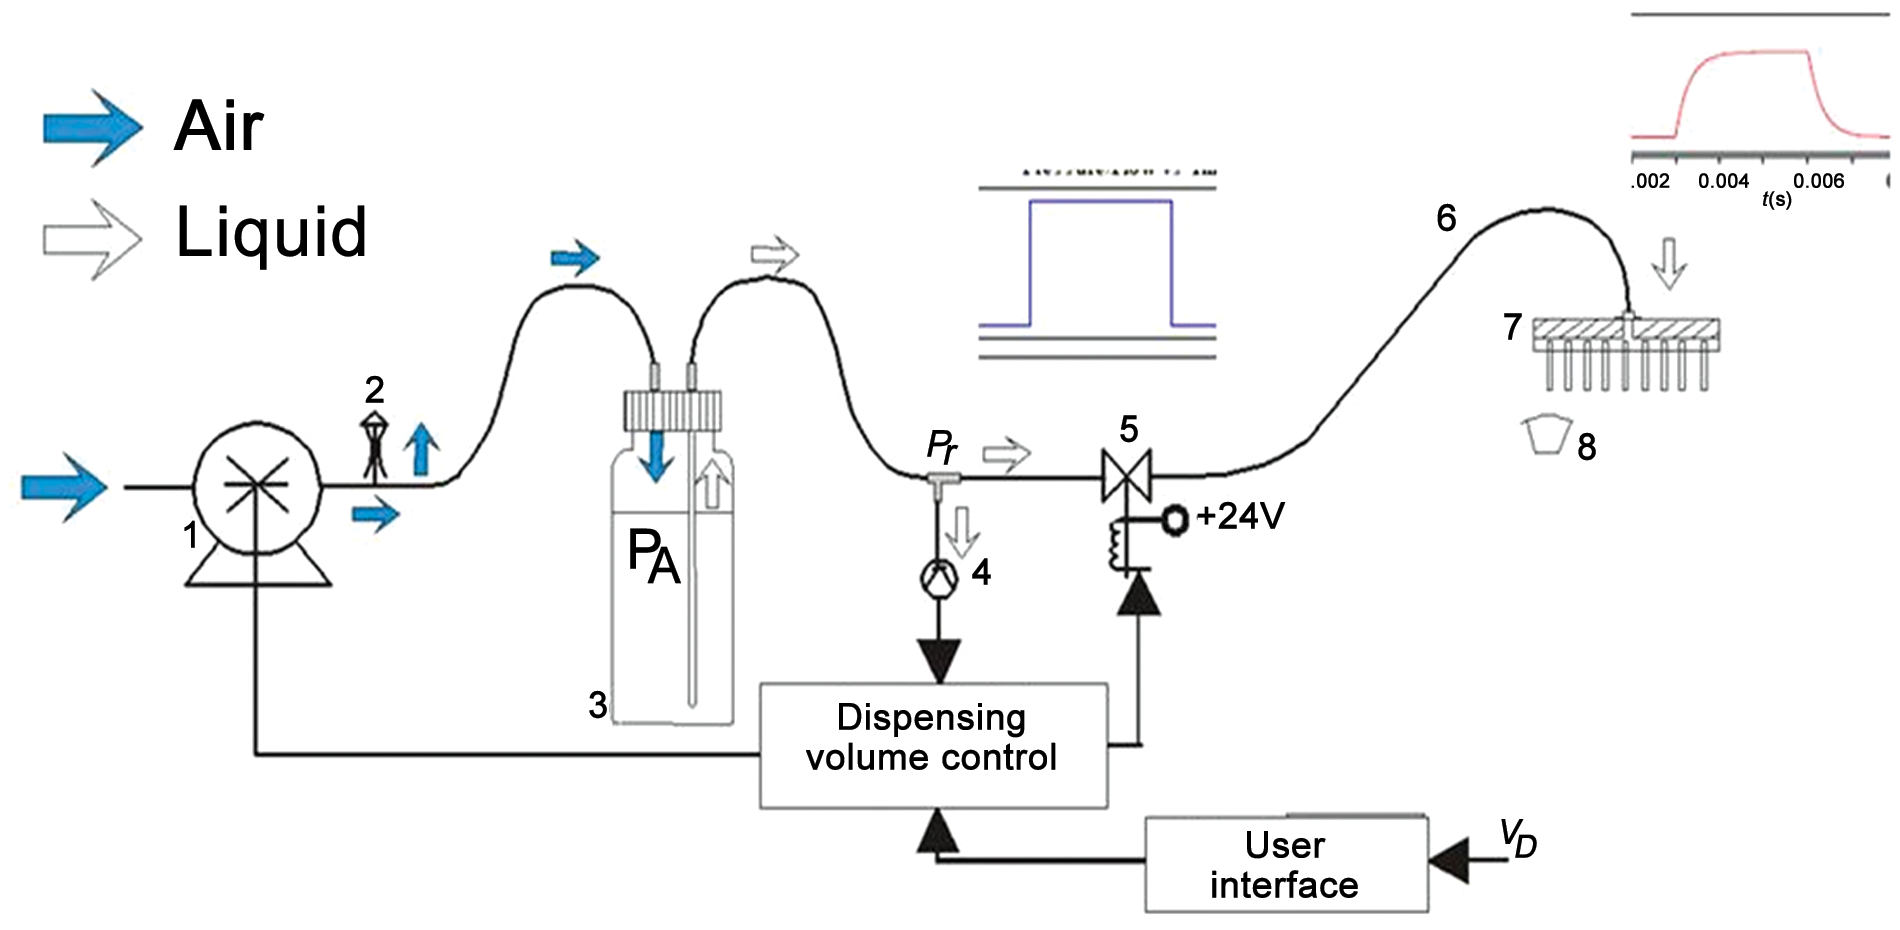
As shown in Figure 4 , The pump (1) pressurizes the vessel containing the washing solution (3). A portion of the pressure applied is released through the pressure vent (2). The dispensing volume control will cause pressure (PA) in flask (3) to change so that total pressure of liquid in the valve (PT), as recognized by the sensor (4), is adjusted in a range less than ±2% from the final value required. This value will depend on the programmed volume. The dispensing volume control will order the valve to open (5) at the demanded time for the programmed volume to be dispensed. The liquid then flows from the flask (3) through hoses (6) until the dispensing manifold (7), which will dispense the liquid uniformly into the reaction wells (8). 3
Control system for the dispensing volume.
Dispensing pressure
The dispensing pressure ( Fig. 3 ) makes the liquid flow through the solenoid valve (5 in Fig. 3 ) and through the cannulas in the dispensing manifold (7 in Fig. 3 ). The greater the backing pressure, the larger the volume dispensed within a given solenoid opening time. A higher pressure allows a cleaner cleavage of the reagent from the dispensing tips but could cause splashing or pressure backlash from the tips if it is too high. Dispensing conditions may be optimized by using several different parameters including changing the backing pressure. 4
The Fluid Inertia and the Backlash Pressure
Fluid inertia was watched by making an experiment using an eight-way manifold with transparent tips ( Fig. 4 ). One observation of interest was that by increasing the pressure from 5.86 × 10³ to 13.78 × 10³ Pa (0.80 to 2.00 psi), the air in the tips after the ejected drops was increasing as well. This produces, after dispensing a while, a bubble in one cannula of the manifold. This bubble then becomes more detrimental to the dispensing performance of the instrument.
The inertia in the flow is present after the end of the activation pulse (see the blue curve in Fig. 3 ) opening the solenoid valve (5 in Fig. 3 ). This results in—after the valve is closed—the liquid continuing to move for a while (see the red curve in Fig. 3 ) and an excessive dispensing volume of the liquid. Such additional ejected volume, now with the valve closed, produces a difference in pressure (which is not desirable because it is against the dispensing flow) that makes the liquid go into the tip. This phenomenon is called backlash pressure and is the origin of the air and the bubbles in the manifold tips.
Dispensing Volume Measurement
Gravimetric method
In this method, a volume of liquid, with a known density, is dispensed and weighed in a balance. Making the conversion from weight to volume, 5 the dispensing volume is obtained.
In our test, eight calibrated strips are used. Each strip has 12 reaction wells and together make an UMELISA plate with 96 (8 × 12) positions (see Fig. 2b ). By dispensing a volume of 30 µL (volume used in many assays) several times in each of the 12 wells and calculating the average, it is possible to obtain the mean value of the dispensing volume in each manifold way.
These measurements are made with distilled water and with non-ionic detergent 0.05% Tween 20. Tween 20 is the liquid used in UMELISA technique to wash the reaction plate. The distilled water is used in some manufacturing stages of the MW 2001.
Results and Discussion
How to Reduce the Inertia Effects?
Figure 5 shows a fluidic analysis using the analogy to electric circuits. The parameter represents, in electric circuits, a parameter that characterizes the step response to the pulse (brief change) of voltage. Then characterizes—in a fluidic network—the step response to the pressure jump. In the formula, L represents the fluid inertia and R represents the flow resistance in the hoses.
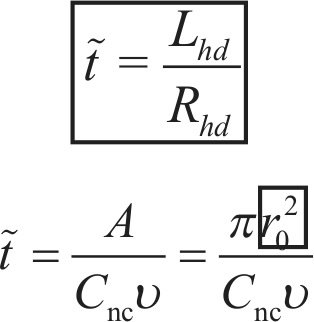
Formulas obtained from the “Fluidic Networks” chapter on the Website myfluidix.com by Dr. Jens Ducrée.
Other variables in Figure 5 are the kinematic viscosity (ν in Fig. 5 ), which is a combination viscosity/density (µ/ρ) of the liquid, the radius of the hose (r0) within the blue square in Figure 5 , and the numerical coefficient Cnc. The Cnc coefficient is a correction for flow resistance channel that depends on the shape of the cross section. In our case, it is constant and equal to 8π. 6
Because the analysis is made for a flexible tube (hose) and the liquids (water and Tween 20) are invariant, we chose to investigate a change in the radius of the hose.
The hose selected for this change was the connection between the valve and the dispensing manifold (see 6 in Fig. 4 ). Two practical radius values were chosen and were investigated versus a selected pressure range of dispensing according to the characteristics of the dispensing systems.
Modified equipment was employed with the following characteristics:
The diameter of the hose (6 in
Fig. 4
) was reduced from 3 to 2 mm. The 2 mm diameter was chosen from other possible reductions by practical considerations. Pressure range of dispensing 6.89 × 10³ Pa (1 psi) to 13.78 × 10³ Pa (2 psi) with intervals of 1.72 × 10³ Pa (0.25 psi).
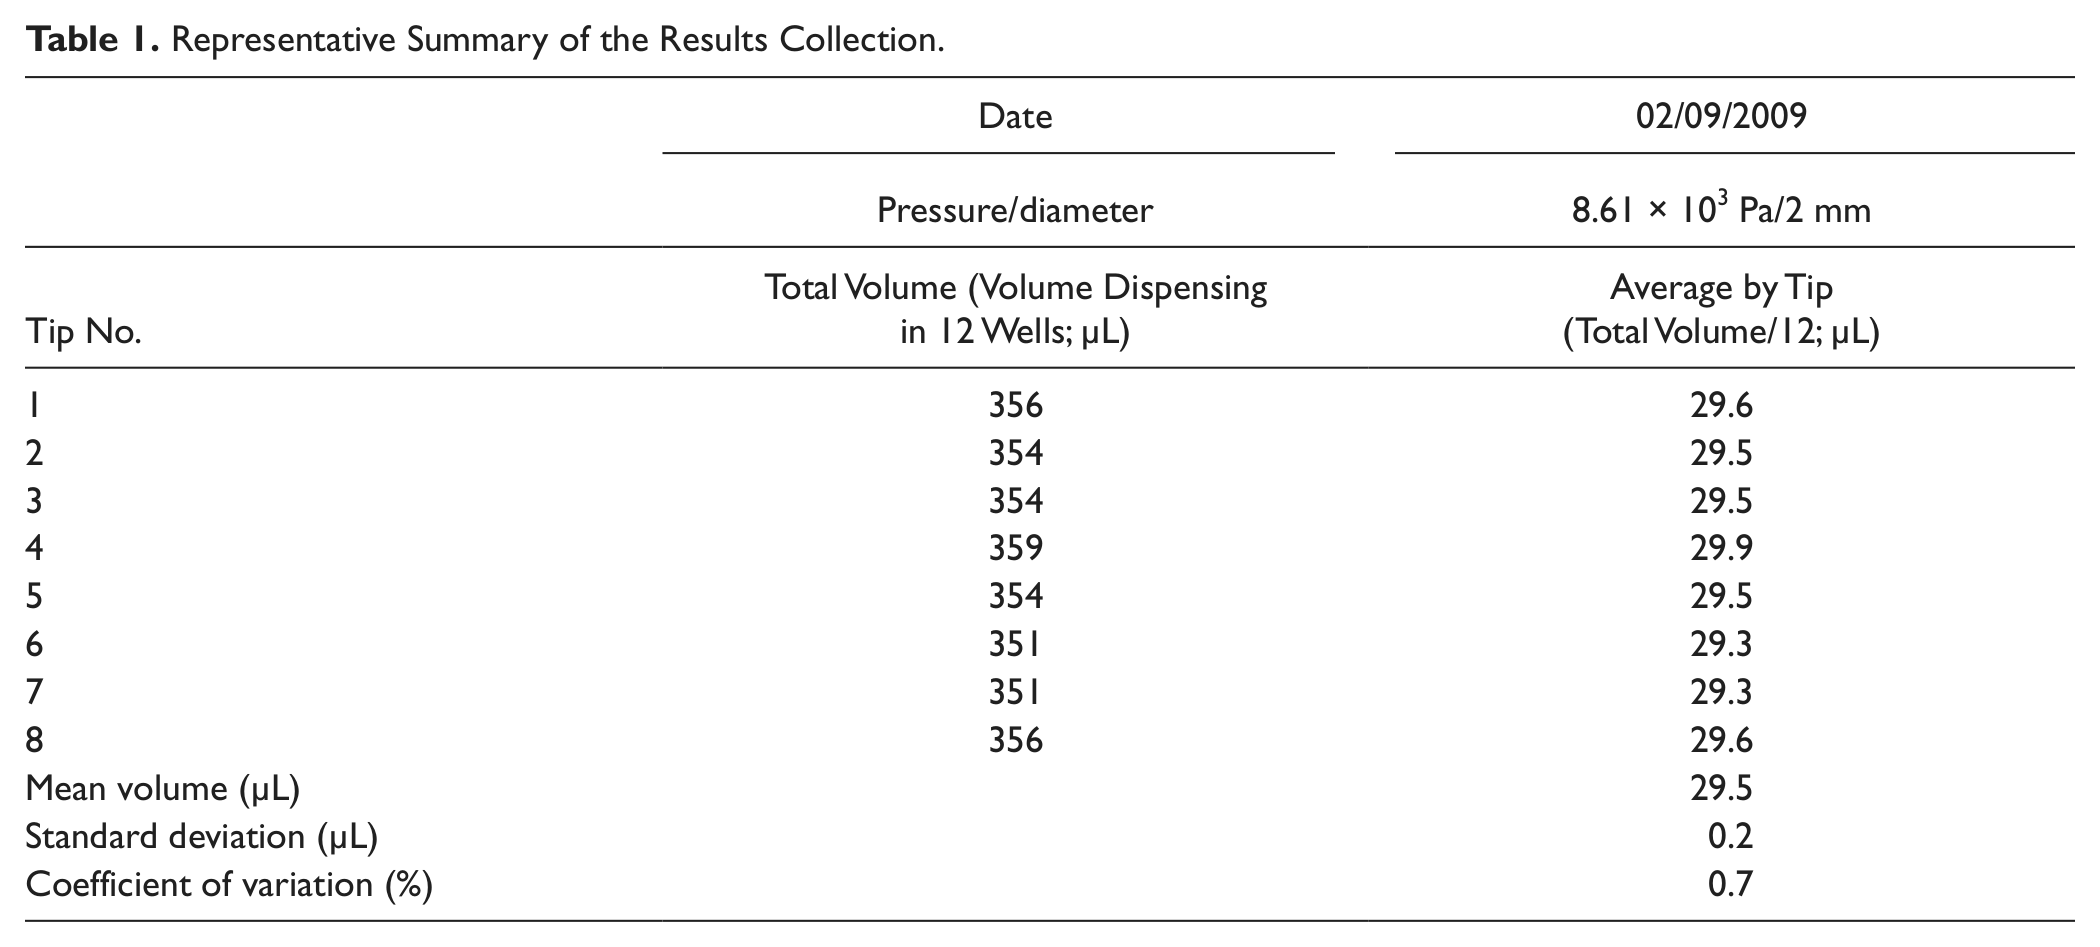
See Table 1 for a representative summary of the results collection. The results collection was similar before and after the modification. The same procedure was followed in the prototypes and in the zero production. In all of these phases, the stability in the improvement obtained was assessed.
Representative Summary of the Results Collection.
Figures 6 and 7 show some results for the two different diameters of the hose that have been used and for three different pressure values. The best dispensing performance was obtained with the hose with fewer diameters and for a pressure of about 6.89 × 10³ Pa (1.00 psi).
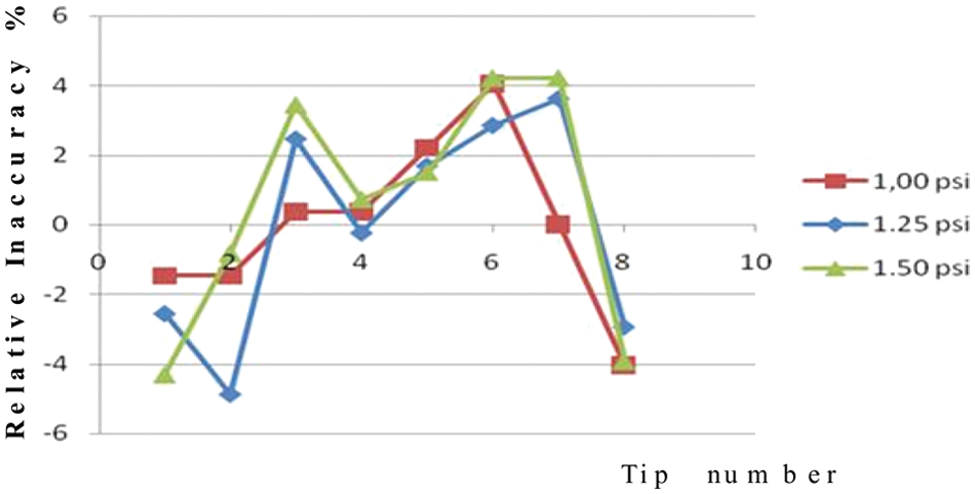
An example of dispensing performance for a hose with a 3 mm diameter. The x-axis shows the eight tips in the manifold, and the y-axis shows the relative inaccuracy. These profiles were similar using water and using detergent 0.05% Tween 20.
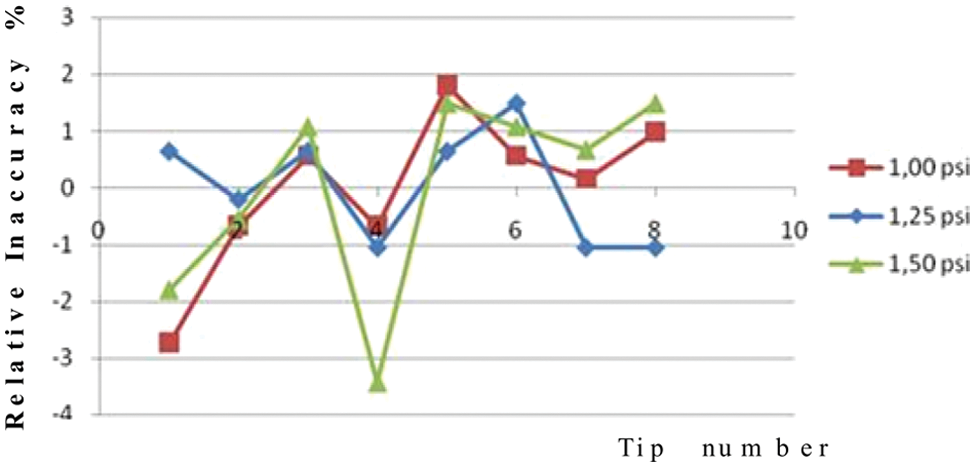
An example of dispensing performance for a hose with a 2 mm diameter. The x-axis shows the eight tips in the manifold, and the y-axis shows the relative inaccuracy. These profiles were similar using water and using detergent 0.05% Tween 20.
The y-axis in Figures 6 and 7 shows the relative inaccuracy value (equation 1) for each tip (1 to 8) in the manifold.
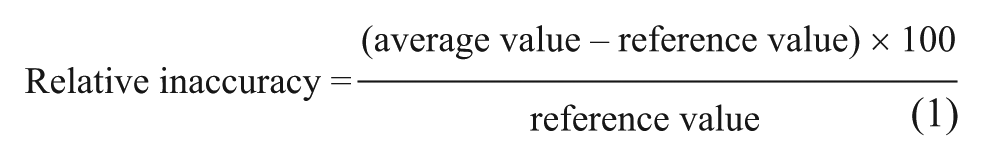
The reference value in equation 1 could be the real value or the expected value. 5 In our case, the expected value of 30 µL is not used; the real value is used instead. The real value is calculated as the mean volume of the eight tips in the manifold (see Table 1 ). This value always remained within the limits of the washing machine certification. 3
The conditions were modified to introduce this improvement in the washing machine production. The diameter of the hose (6 in Fig. 3 ) was reduced from 3 to 2 mm, and the dispensing pressure was fixed in 8.61 × 10³ Pa (1.25 psi) as working pressure in the UMELISA technique.
Application
Three prototypes were built and proved (prototyping) with these changes. After that, a zero production (early production) was performed. As result, there was a reduction in reprocessing actions originated by problems in the dispensing accuracy. We have made controls that give an improvement of about 70%.
Conclusions
We have been able to demonstrate the following:
The inertia phenomenon was present in the positional dispensing of low-volume (microliters) drops, and this affects the dispensing performance. Dispensing conditions may be improved by using several different parameters, including changing pressure and the hose diameter.
Results in prototyping and early production are a practical demonstration that this improvement in dispensing volume performance is reproducible.
Footnotes
Declaration of Conflicting Interests
The authors declared no potential conflicts of interest with respect to the research, authorship, and/or publication of this article.
Funding
The authors received no financial support for the research, authorship, and/or publication of this article.