
Abstract
We report the development of an automated genetic analyzer for human sample testing based on microfluidic rapid polymerase chain reaction (PCR) with high-resolution melting analysis (HRMA). The integrated DNA microfluidic cartridge was used on a platform designed with a robotic pipettor system that works by sequentially picking up different test solutions from a 384-well plate, mixing them in the tips, and delivering mixed fluids to the DNA cartridge. A novel image feedback flow control system based on a Canon 5D Mark II digital camera was developed for controlling fluid movement through a complex microfluidic branching network without the use of valves. The same camera was used for measuring the high-resolution melt curve of DNA amplicons that were generated in the microfluidic chip. Owing to fast heating and cooling as well as sensitive temperature measurement in the microfluidic channels, the time frame for PCR and HRMA was dramatically reduced from hours to minutes. Preliminary testing results demonstrated that rapid serial PCR and HRMA are possible while still achieving high data quality that is suitable for human sample testing.
Introduction
Microfluidic-based platforms that manipulate fluids within nanoliter to microliter volumes have been widely used in developing medical diagnostic systems to reduce diagnostic turnaround time, hands-on preparation, and reagent costs.1,2 Integration of DNA analysis in such systems, including sample preparation, PCR amplification, and amplicon detection in a microfluidic platform, has been shown to remarkably shorten the DNA analysis time to less than 45 min.3,4 Particularly, performing PCR amplification in a microfluidic channel can dramatically reduce thermal cycling time, from a few hours to less than 10 min.3–7 This technology offers the promise of a fast and low-cost solution for clinical diagnostics 8 and forensics.4,7 The detection of submicroliter volumes of PCR amplicons in the microfluidic chip usually requires high-resolution separation and expensive laser-induced fluorescence detection instrumentation, 9 which presents a bottleneck for system integration. High-resolution melting analysis (HRMA) is a simple and effective method for characterizing DNA amplified by the PCR. The method has been used in a variety of genetic applications, including single-nucleotide polymorphism (SNP) genotyping, methylation analysis, and mutation scanning.10–12 The outstanding features of HRMA, such as label-free detection, low cost, and ease of use, have made it an attractive method in DNA molecular diagnostics. The availability of nonspecific ds-DNA binding dyes such as LC Green and SYTO 9 has significantly improved HRMA sensitivity and stability and made it possible to distinguish a small difference in melting temperature (0.3 °C or less for A/T or G/C variants) between PCR amplicons that represent different genotypes.13,14 To achieve high accuracy and reliable genotyping, HRMA requires highly accurate temperature measurement and temperature uniformity among samples. However, current commercial PCR instruments typically have temperature accuracies that are ±0.25 °C or greater. 15 In addition, variations in the reaction chemistry (e.g., in salt concentration) also could cause a significant variation in the melting temperature. 16 This source of error can be exacerbated by bench-top manual pipetting and mixing that can introduce variations by human error. Commercial instruments with PCR and melting functions, such as LC480, Lightcycler, and Rotor-Gen Q, require an end user to invest in a separate liquid-handling system or rely on error-prone manual pipetting. To our knowledge, there is no HRMA instrument with a fully integrated automated liquid-handling system on the market. It is expected that an HRMA instrument integrated with an automatic liquid-handling system will improve the accuracy and stability of HRMA by minimizing human error.
Integration of PCR and HRMA on a microfluidic system can not only speed up detection time but also can improve the temperature measurement and temperature uniformity with advanced semiconductor fabrication technology. However, a robust “world-to-chip” interface is necessary to deliver reagents into a microfluidic chip. Although microfluidic systems have been developed since the 1990s, there is still a need for an effective and universal world-to-chip interface that is able to dynamically access different reagents. It is a notorious challenge for interface chip design, being difficult to make an interface without performance comprise. Many methods such as immobilization, direct pattern, spray deposition, and ink jet printing have been developed for integrating dry reagents in a microfluidic system.17,18 For liquid reagents, in most cases, they were either stored in reservoirs or wells on the chip17,19,20 or were stored in syringes with tubes connecting to the chip. 21 As an example, Liu et al 19 have developed a PDMS, valve-based world-to-chip interface that allows reagents to be stored in the wells on the chip and dispensed into functional channels with valve control. This system relies heavily on the use of vacuum pumps. In another case, Yang et al 20 developed a world-to-chip interface for digital microfluidics. The reagents were stored in the wells on the chip and were introduced into the channel by electrowetting. It is clear that the common drawback of these designs is that the reagents were constrained in the specific chip wells, containers, or syringes that made the platform lose the flexibility of freely accessing a variety of reagents as needed. To overcome this issue, Caliper Life Sciences22,23 developed a sipper-based chip that is able to access a series of samples easily from a 96- or 384-well plate. Storing the reagents in the well plate provides obvious value to clinical research in terms of flexibility of dynamically accessing reagents, cost-effectiveness, convenience for mass production, and quality control.
In this article, we present an integrated microfluidic-based rapid PCR-HRMA system useful for clinical research. An interface module and a PCR chip were assembled together to form a cartridge in which PCR and HRMA can be performed in sequence. Robotic liquid handlers can flexibly access a 384-well plate and deliver the samples to the microfluidic cartridge through the sippers that are connected to the channels. A prototype instrument ( Fig. 1 ) was built to facilitate automated genotyping of SNPs using this cartridge. The instrument uses a CMOS sensor in a Canon EOS 5D Mark II camera for fluorescence imaging of the liquids in the cartridge. The cartridge is introduced into the instrument manually using a tray and drawer system that, when pushed to close, locks the cartridge in place.
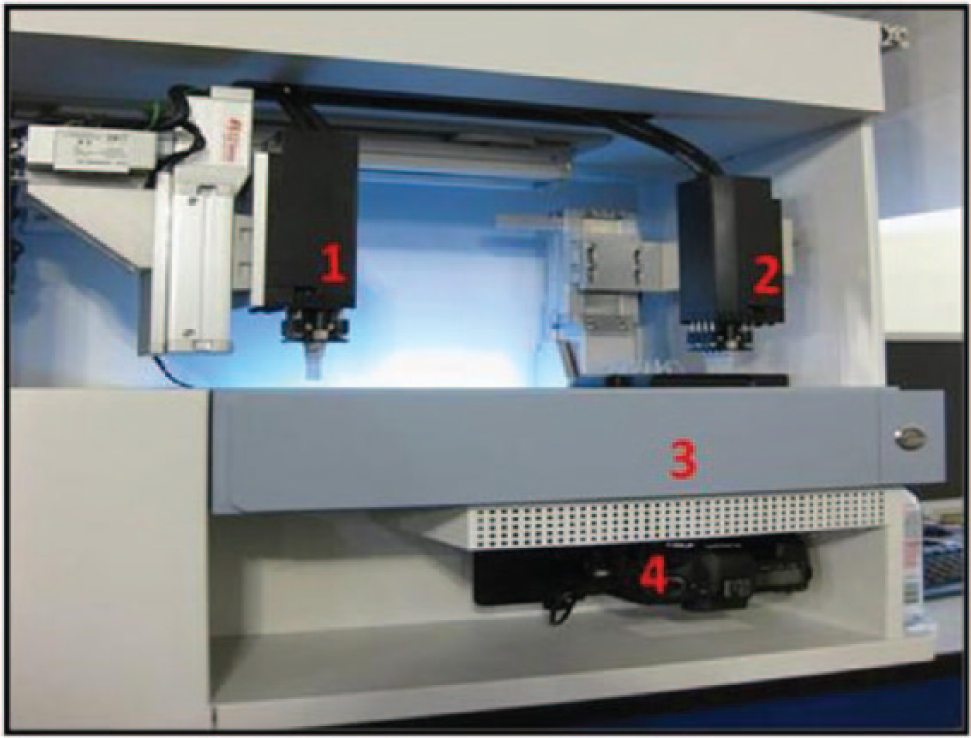
Image of automated DNA Genetic Analyzer prototype. 1, sample robotic pipettor; 2, tracking solution robotic pipettor; 3, cartridge tray; 4, Canon EOS 5D Mark II camera.
The cartridge accepts the solution through an array of sippers and delivers 80 nL of solution to the PCR chip using an image-based feedback flow control scheme guided by the movement of a tracking solution. An array of thin-film heaters and temperature sensors were fabricated under the PCR channels to enable rapid PCR in parallel channels and then endpoint detection using HRMA. Compared with traditional PCR instruments, the present system dramatically reduces the PCR/HRMA time from hours to minutes and allows for hands-off, automated sample operation. It also adds a unique feature of value for clinic research: allowing an end user to choose, through programming, multiple assays upfront or in real time, adding some assays during testing based on the previous test results, rather than waiting for all tests to be completed. Moreover, complete flexibility with regard to thermal cycling conditions is maintained as each assay can be run under its own optimized conditions. This platform format represents a significant shift from a batch mode platform and so is more geared to performing many tests on a single sample and allowing the ability to build complex test menus featuring dependencies or alter the latter test scheme based on results of the initial test scheme.
Materials and Methods
Microfluidic DNA Cartridge
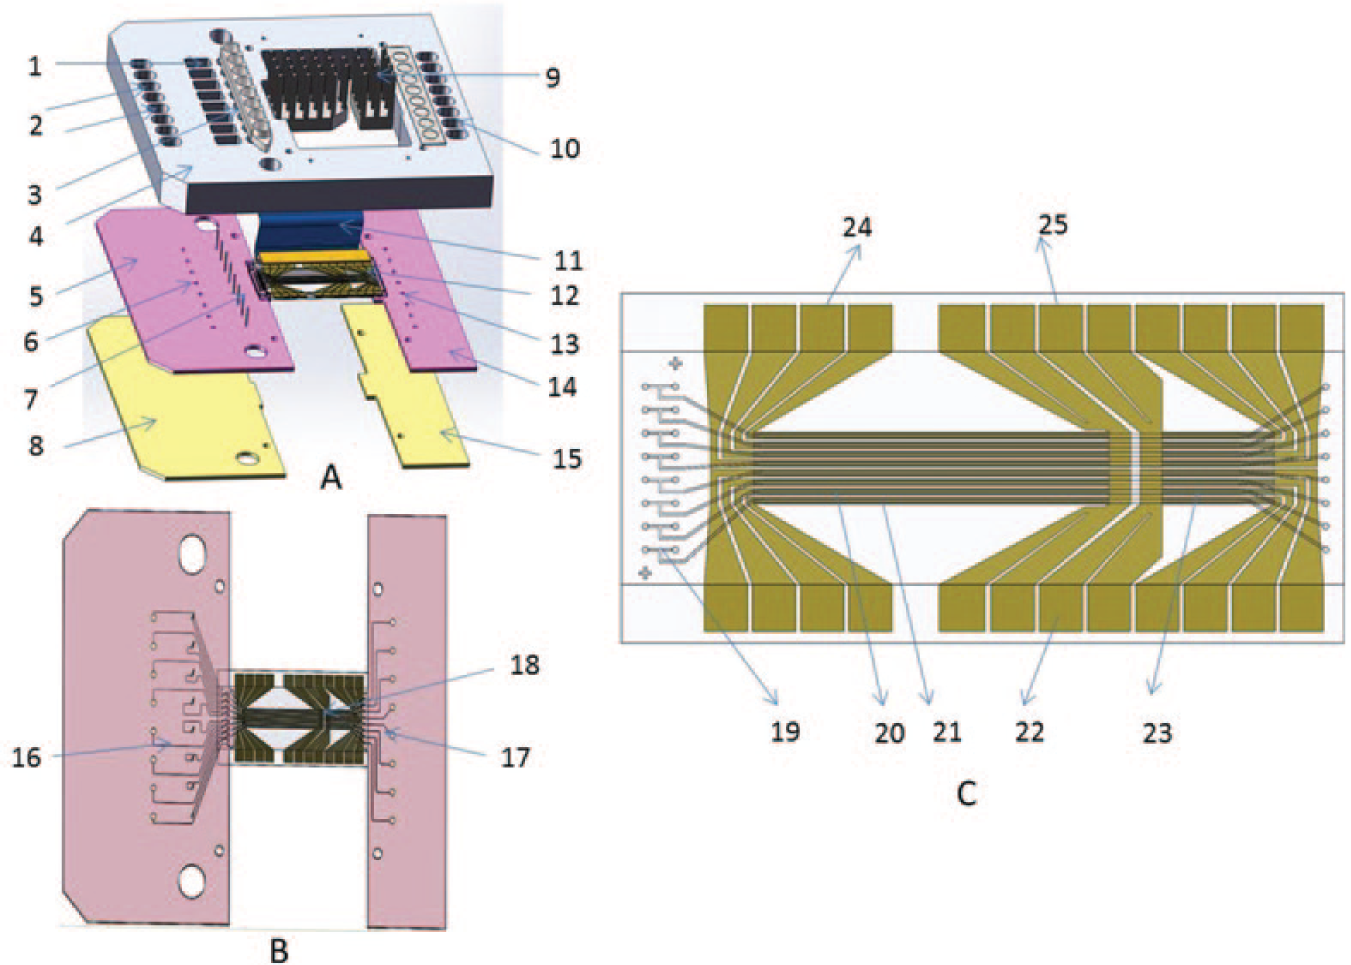
The microfluidic DNA cartridge ( Fig. 2 ) consisted of two main components: a fused silica PCR chip ( Fig. 2C ), with 8 microchannels in which PCR/HRMA fluorescent chemistry occurred, and an interface module used to continually deliver reagents from the automated pipetting system to the eight microchannels of the PCR chip and provide electrical power to resistive heating elements within the microchannels of the PCR chip. Details of the design and assembly methods for the cartridge are found in the supplementary materials.
(
Liquid flow through the cartridge was designed to occur in two distinct paths. First, liquid introduced via the capillary sippers flowed through the channels in the inlet portion of interface module, through the T-junction of the PCR chip, and terminated in the vent well in the interface module. This flow served to fill the T-junction of the PCR chip with pure fluid that could then be drawn into the PCR chip. The second flow path was from the T-junction in the PCR chip to the waste wells vial the waste holes in the outlet portion of the interface module. By first filling the T-junction with pure fluid and then drawing it into the PCR channels, the possibility of in-chip mixing between fluid deliveries was minimized.
The channel dimensions of the PCR chip were precisely fabricated on fused silica wafers by production technologies used for semiconductor devices and optical components. Thus, the dispersion and diffusion of fluid was accurately manipulated as laminar flow. As shown in Figure 3 , when a fluid flowed through the sipper into the interface module channel (red line), it filled the T-junction of the PCR chip (green line) through the connection holes. The fluid was then pulled into the PCR channel to create a discrete fluid segment (aka slug) in the PCR chip channel. The length of the slug in the channel was able to be precisely tailored by adjusting the pulling time and pressure. By alternating between the PCR solution and a tracking solution between PCR solutions in the interface module, a series of slugs were sequentially formed and flowed through the PCR chip.
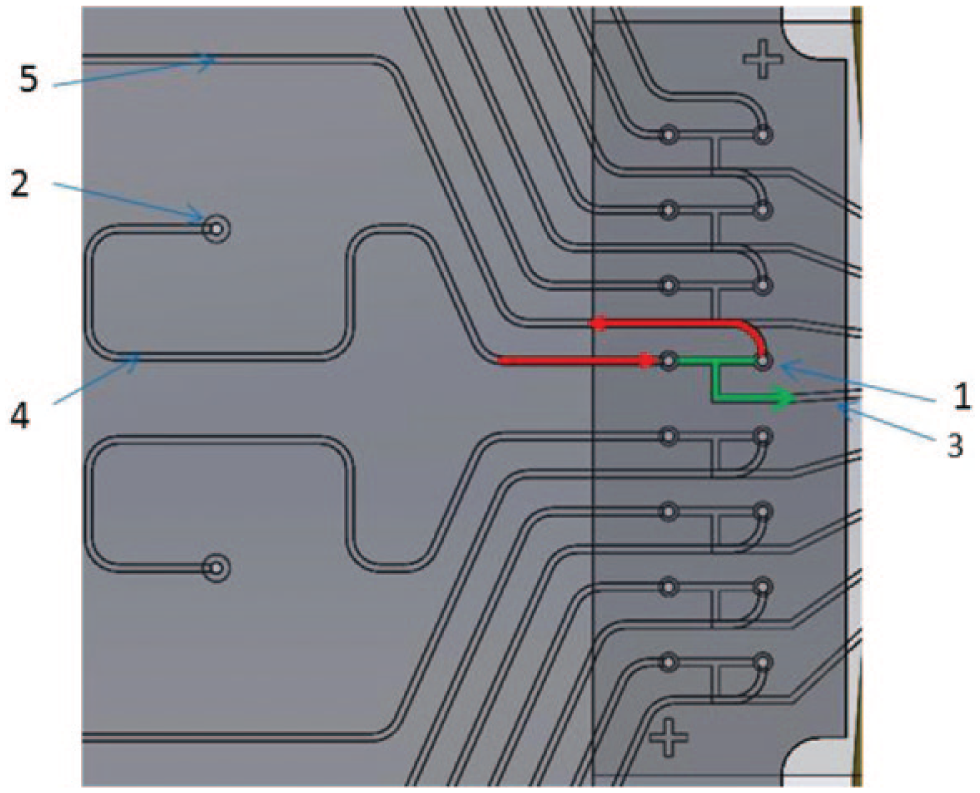
Scheme of flow path in the cartridge. 1, connection hole of interface module and PCR chip; 2, sipper holes; 3, channel in the PCR chip leading the slug into the PCR zone; 4, channel in the interface module for introducing the sample in the PCR chip; 5, channel in the interface module toward the vent well. Red line, flow path in the interface module; green line, flow path in the T- junction of PCR chip for creating the slug into PCR chip.
The PCR chip was designed with resistive platinum heaters embedded in the microfluidic channels to maximize heating rate and minimize power consumption. Miralles et al 24 reviewed the comparative advantages of external and integrated heating methods in microfluidic devices, with the advantage of integrated methods having faster heating rates and the main disadvantage being a higher degree of complexity in fabrication. In our design, we chose to integrate resistive electrical heaters within the microfluidic chip and passivate the heating elements such that there is no electrical contact between the metal heaters and the channel liquid. The heat required for thermal cycling (PCR and HRMA) was provided by a thin-film platinum resistor located in each of the micro channels and passivated by a thin (~3 µm thick) layer of SiO2. An array of thin-film platinum elements was created to heat the PCR solution rapidly in each channel. Temperatures were sensed by using the same platinum film resistors as resistive temperature detectors. Thin-film gold was deposited on the chip to create low-resistance connections between the heating elements and the outside edges of the chip. Electrical connections were made with flexible circuits to pass power to the gold leads of the PCR chip and also return temperature signals for thermal profile control. Heat sinks were attached with ultraviolet-activated adhesive to the PCR chip to speed up the cooling step of PCR. The temperature-sensing performance of the thin-film heaters was evaluated in unbonded PCR chips using an IR camera (SC6000, FLIR Systems Inc., Wilsonville, OR). For the bonded PCR chip, the sensors were typically calibrated in situ by performing melt point analysis of double-stranded DNA sequences of known melting temperatures. Typically, two DNA sequences with different melt transitions (e.g., 70 °C and 90 °C) were used to determine a linear calibration of the platinum elements. 25
Instrument
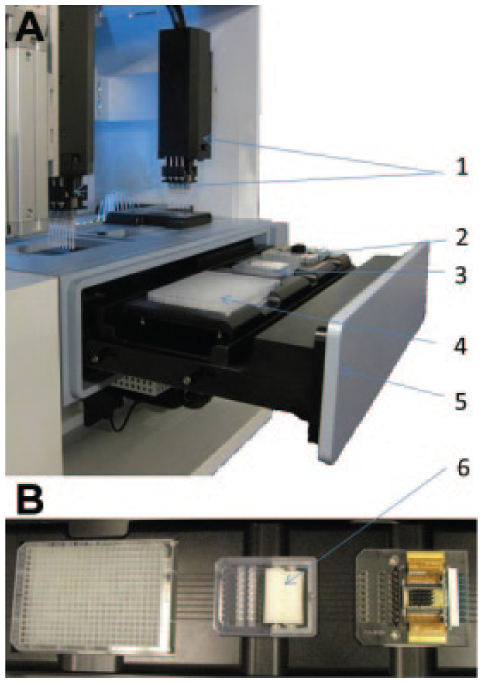
The automated rapid prototype instrument (shown in Fig. 1 ) was built to perform rapid PCR and HRMA using the microfluidic cartridge. As shown in Figure 4 , two robotic, eight-channel pipettors were used: one was used to pick up the PCR solution and the other a solution containing a fluorescent, tracking dye (Alexa Fluor 647, Life Technology, Grand Island, NY) used for optical PID control of peristaltic pumps, which controlled the fluid flow in the cartridge. The pipettors were attached to a robotic gantry (Oriental Motor, Torrance, CA) to move the pipettors between the well plate containing the PCR reagents and the cartridge. Syringe pumps (Tricontinent Scientific, Grass Valley, CA; not shown in Fig. 4 ) were connected via tubing to the robotic pipettors to draw liquids into and out of custom pipette tips (0.3 mm i.d. and 1.9 mm o.d. at the end of the tip). Sixteen independent peristaltic pumps (Watson-Marlow Pumps Group, Wilmington, MA) were applied at eight vent wells and eight waste wells to pull liquids into the interface module and the PCR chip, respectively. Figure 5 shows the process of fluid movement in a flow chart, and details of this process are described in the supplementary material. The optical system consisted of an array of light emitting diodes and a digital SLR camera with custom filters and modified firmware for fluorescence measurement ( Fig. 6 , with additional details in the supplementary material). Fluorescence images were acquired at ~30 Hz frame rate using the Live View function of the SLR camera. The RGB pixel readings were combined (with weight) to represent the fluorescence intensity levels.
(
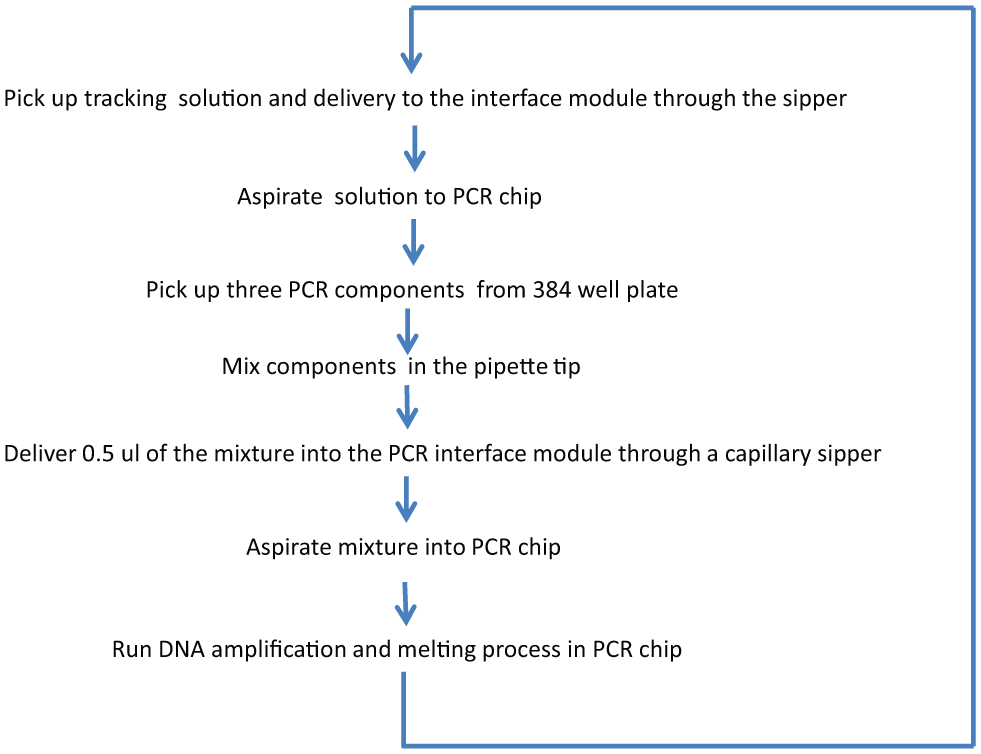
Flow diagram of the steps in the process as test fluids are moved through the system.
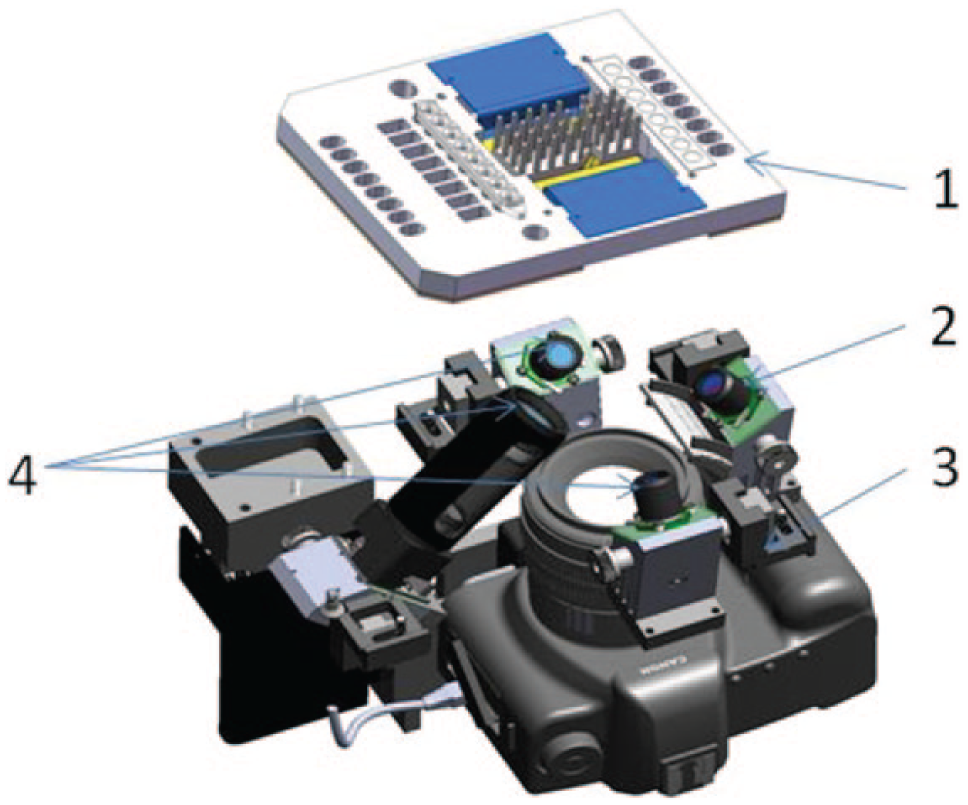
Illustration of image system. 1, DNA cartridge; 2, 629 nm red LED; 3, Canon EOS 5D Mark II camera; 4, 445 nm blue LEDs
The software for all mechanical and optical controls was programmed with Labview 8.6 (National Instruments, Austin, TX). A National Instruments 14-slot PXI chassis with a quad core PXI-8110 controller was used. Heater control used a set of four PXI-6289 multifunction data acquisition (DAQ) boards. Two PXI-6281 DAQ boards were used to control various sensors and actuators, whereas RS232 was used for pressure and syringe pump control. Details of the process for controlling flow in the cartridge are found in the supplementary material.
PCR/HRMA Testing
Chemistry was developed and optimized to achieve robust DNA amplification and HRMA in the PCR chip. Titanium TAQ Polymerase (Clonetech, Mountain View, CA) was used in all cases. PCR primers for selected targets were obtained from Integrated DNA Technologies (Coralville, IA). A universal PCR buffer was formulated as follows: pH 8.3, 20 mM Tris HCl, 30 mM KCl, 1 M Betaine, 2% DMSO, 0.04% Tween-20, and 0.05% bovine serum albumin. Both PCR and tracking solutions used the same buffer formulation. The PCR solution included 1X TAQ and 1X LCGreen+ as a DNA binding dye. The tracking solution included 35 mM Alexa 647. To demonstrate data quality of HRMA melting curves for this study, two PCR/HRMA assays were developed to detect particular mutations in the human cystic fibrosis transmembrane conductance regulator (CFTR) gene. One was a small amplicon melting assay whereby a 51 bp amplicon was generated overlaying a region containing an SNP (G542X G>T). Included in the reaction mixture were two complementary oligonucleotides that serve as an internal temperature control (ITC). The ITC melts at a higher temperature than the target amplicon and is used to normalize variation in melt curves between channels. Thirty-five PCR cycles of 10 s each were used to amplify the target DNA, and thermal melting was conducted at a rate of 0.5 °C/s. Relative fluorescence values in each channel were recorded to generate melting curves. Raw melt curves of relative fluorescence versus temperature were normalized, and the resulting curves were used to distinguish different melting profiles, indicating allele status as wild type (GG), homozygous mutant (TT), or heterozygous (GT). The other assay was a probe-melting assay in which an amplicon is generated overlaying a region containing a small deletion polymorphism (ΔI507, a deletion of ATC). In the probe-melting assay, an additional oligonucleotide that overlays the deletion is used as a probe to detect mutation status. Fifty PCR cycles of 10 s each were used to amplify the target DNA, and thermal melting was conducted at a rate of 0.5 °C/s. The resulting normalized melting curve contained two melting domains, the amplicon melting domain and the probe-melting domain at a lower temperature. The raw melting data were transformed to produce negative derivative curves (–dF/dT vs. T) to more easily interpret the probe-melting domain. In both assays, wild-type (normal) human genomic DNA samples were purified from cell lines purchased from Coriell (Camden, NJ). DNA containing mutations was constructed artificially by inserting the target sequence into a plasmid. 26 The heterozygous samples (containing both normal and mutant alleles) were produced by combining the construct DNA with the wild-type genomic DNA. 26 All samples were run simultaneously in separate channels and in duplicate. Thus, six of the eight channels were used to generate the test results.
Results and Discussion
The development of the systems began first with the development of the PCR chip, and the greatest challenge of the project was integration of the chip with instrumentation for delivering fluids and power to the chip. The interface module was developed to provide the necessary integration features, including the world-to-chip fluidic delivery system (pipets delivering beads of fluid to sippers), flow control within the cartridge (optical tracking of a dye interspersed between serial PCR reactions), and delivery of power to the chip (via flex circuits connecting the gold pads on the chip and the heater control system in the instrument).
Fluidic Performance
Custom polypropylene pipette tips were designed to have a large tip-end surface area (2.77 mm2), a specific requirement of the present world-to-chip interface that is contrary to typical designs for free bead dispensing. When the solution was dispensed from the tip, it formed a liquid droplet that covered the gap between the pipette tip and the sipper and immersed the top of the sipper in solution, as shown in Figure 7 . Surface tension at the pipette tip end kept the bead of solution around the top of the sipper from dropping off. The solution was successfully introduced into the channels by applying a negative pressure at the vent wells. As there is a large dead volume in the connection holes between the interface module and PCR chip, it took approximately 0.5 µL of solution to completely flush the previous solution out of the interface module. Following delivery to the cartridge, the tips were pulled away from the sippers with the remaining solution still attached to the tips and leaving the sippers free of solution due to the hydrophobic coating on the outside of the sippers and the large end surface area of the pipette tips. The remaining solution was then discarded by moving the tips to the cleaning station and touching a set of foam rollers housed there ( Fig. 4B ). We found that completely removing any excess fluid from the pipette tips was essential for preventing the bead of solution in subsequent deliveries from wicking up the outside of the tip, thus causing breakdown of the bead and failure to engage with the sipper.
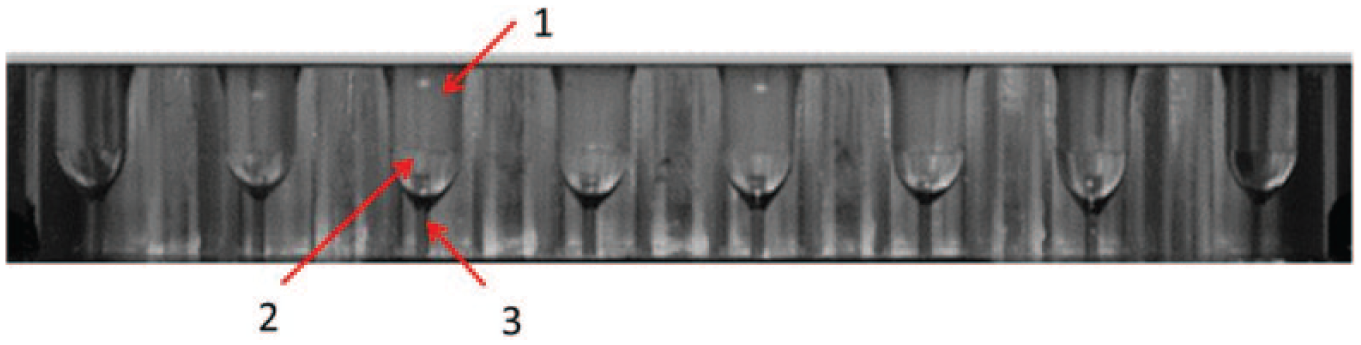
Cross-section view of delivery of sample droplets to the sippers. 1, pipette tip end; 2, bead of solution; 3, capillary sipper.
Another factor critical to successful flow in the cartridge was preventing air from entering the sipper when the pipette tip was withdrawn from the sipper. When an air plug was introduced into the sipper, the flow of liquids in the microfluidic system stopped, and the pressure differentials used in the system were incapable of removing the air plug. Therefore, it is imperative to eliminate the possibility of introduction of air plugs into the microfluidic system of the cartridge between deliveries of liquid to the sippers. This was accomplished by ensuring that the negative pressure applied to the vent well by the peristaltic pump was opposed by the force that holds the solution on the end of sipper due to the surface tension of the liquid at the orifice. When the forces are in equilibrium, we have threshold pressure:


where r is the sipper i.d., γ is the liquid/air surface tension, and the θ is the contact angle between the liquid and the tube material. For the PCR solution, the contact angle on the glass surface was measured to be 9°, and the surface tension was 0.0634 N/m. Thus, the P threshold on 100 µm i.d. fused silica capillary was calculated to be 0.36 psi. It indicates that a significant (>0.36 psi) pressure is required to aspirate a bubble for a sipper less than 100 µm in diameter. When the pressure is smaller than P threshold , it is difficult to pull air into the sipper because of the capillary force. This “soft valve” effect was confirmed by observing that the solution level in the sipper did not drop when little or no pressure was applied on the vent well. Thus, it is reasonable to set the negative pressure differential at the vent well less than 0.3 psi to avoid pulling air into the system. We found that the soft valve function at the sipper orifice sufficiently prevented air from being introduced. Occasionally, we observed tiny air bubbles flowing through the channels in the PCR chip, but these did not impede channel flow. Therefore, we believe that the current system design has successfully eliminated the impact of air plugs to the flow control.
To test the reliability of the liquid delivery technique using the bead formation technique, we developed a system whereby the pipet tip and sipper interface could be monitored by video while the solution was repeatedly aspirated from the well plates, mixed in the tip, and delivered to sippers. In 20 different cartridges, with more than 9000 beads delivered, 99.5% of the beads successfully formed a bead of liquid covering both tip end and sipper end and lasted until the end of the delivery. In the failed bead deliveries, some of the beads were wicked up the side of the pipette tip and caused failures by forming droplets of insufficient size to cover both the pipette tip and the sipper. Performance was improved by better cleaning of the pipette outer surface by the foam roller. In another case of failed delivery, it was found that an air bubble, created by the robotic pipettor, entered the solution and then was moved into the channel during operation. It is hypothesized that these tiny entrained bubbles can in some cases still enter the microfluidic network because the soft valve effect described above works only when there is clear liquid/vapor phase separation. Flow control in the cartridge was a particularly difficult technical challenge. Although the channels in the PCR chip were fabricated to a dimensional tolerance of ±1 µM, slight variation of flow rates between channels made it necessary to develop a system to independently control flow in each channel. The technology of image-based feedback flow control using the Canon 5D Mark II camera was developed to achieve dynamic flow control in the interface module and the PCR chip. Briefly, the camera imaged the chip at a rate of 1 Hz, and image analysis algorithms determined, in real time, the position of the edge of the red fluorescent tracking dye relative to a target location on the chip. Flow in each channel was adjusted by the use of peristaltic pumps applying pressure based on the relative position of the tracking dye. Details of the novel control mechanism are found in the supplementary materials. To our knowledge, such robust, dynamic control of flow in microchannels has not been previously achieved.
It should be noted that PCR was not completed in a closed system. The PCR channels were connected to the waste wells, which were covered by an air-permeable membrane. Czilwik et al. 27 reported the vapor loss issue when running PCR in a fully closed system. To avoid the vapor issue, they proposed a vapor-diffusion barrier to separate the liquid-filled PCR chamber from an auxiliary air chamber. In our DNA cartridge, there is at least a 10 mm long channel connecting the PCR chip to the waste well, and this produced a vapor diffusion barrier. In addition, the heater film and temperature sensor were constructed right underneath the PCR chamber with only a 3 µm isolation layer. The heating was efficient, and the temperature could be precisely managed to avoid boiling the solution. Therefore, we did not encounter any vapor issue in the channels of the PCR chip.
Thermal Control
The heaters were capable of very rapid, controlled heating of the liquid in the channels at rates up to 120 °C/s, owing to their small mass and close proximity to the micro channel. The cooling required for thermal cycling was provided by airflow that was ducted in from the backside of the instrument. This air was drawn from outside the instrument and was directed at a pin fin heat sink. The microfluidic chip could be cooled from denaturation (92 °C) to annealing (60 °C) temperatures in <0.7 s. Interior channels cooled slower than exterior ones because of transverse temperature gradients. Further, the precise cooling time was a function of the temperature step as well as the amount of time held at the high temperature. Slow PCR cycles, for example, allowed the entire heat sink to rise in temperature, which made the fall time slightly longer, whereas short denaturation times resulted in less stored energy and thus faster cooling times. Figure 8 shows a 2 s thermocycling profile (0.5 s denature + 1.5 s anneal/extend) that was achieved in the device. To produce amplification products in PCR reactions at this speed, Farrar and Wittwer 28 have shown it is necessary to use a polymerase capable of performing the primer extension chemistry at high speed and increased concentrations of primers. Using the polymerase and primer concentrations specified in the Materials and Methods section of this article, we were unable to achieve efficient DNA amplification at 2 s/cycle. Using the PCR chemistry developed by Farrar and Wittwer, 28 however, it is expected that efficient PCR could be expected.
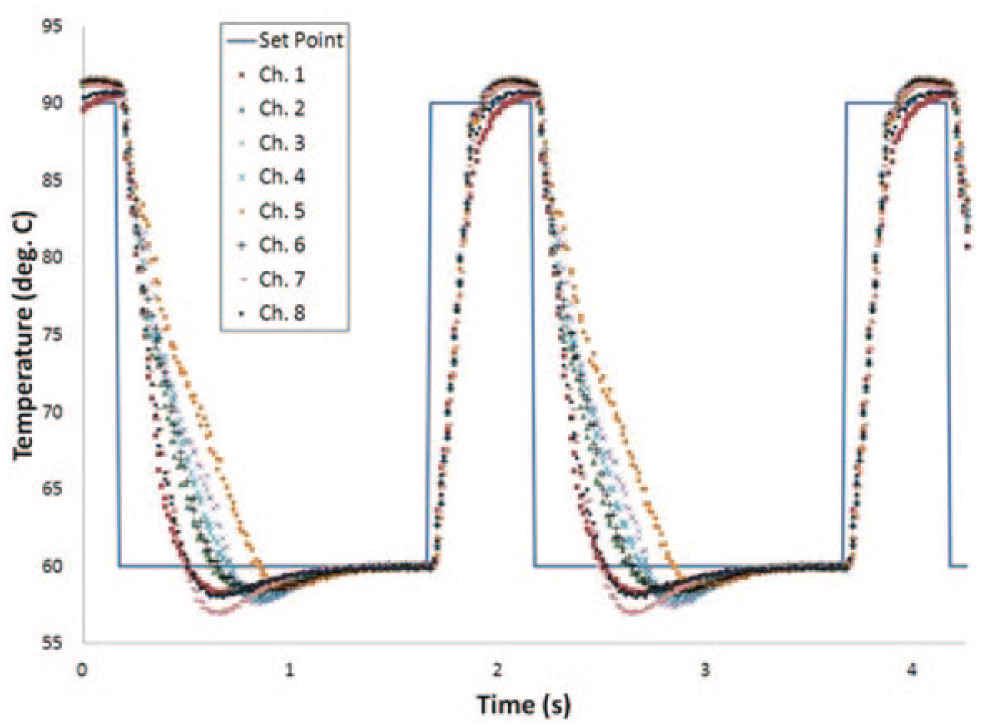
Temperature versus time plot for 2 s PCR cycle (0.5 s denature + 1.5 s anneal/extend). The blue solid line is the expected temperature profile. The dotted lines are the actual temperature profile in each channel.
The temperature measurement variation from 50 °C to 90 °C was as low as 0.002 °C, which is low enough to differentiate the small DNA melting temperature changes caused from different genotypes. The precision of the system’s ability to measure melting temperature was then determined by melting the calibration fluid (with its two well-known melt transitions). When the temperature calibration fluid was present in the channels, the melting temperature variation between channels was 0.1 °C, which is much larger than the temperature sensor variation, indicating that other factors such as chemistry uniformity, cooling uniformity, and the method of calculating melting temperature through melting curve may play a large role in the temperature variation.
The process of creating discrete PCR reactions in series allowed different thermocycling protocols to be used for each assay if desired. A typical protocol may consist of a “hot” start at 95 °C for 30 s followed by 35 to 40 cycles of three-step PCR, in which each cycle is no more than 10 s in total duration (including all transition and dwell times). Following PCR, a thermal ramp (e.g., at 0.5 °C/s) is used for HRMA. Melt range and ramp rates are also customizable on an assay-by-assay basis if desired.
One concern is cross-contamination in this system because DNA amplifications occur in series in the same channel. There are several aspects of the system designed to avoid cross-contamination. First, each channel contains only one type of target DNA, such that all PCR reactions performed in series in that channel use the same DNA as substrate. Different sets of PCR primers are used in each serial reaction within a channel, so the amplification products made in the channel cannot serve as substrates for the next set of primers. After delivering the solution to the cartridge, the pipette tips were cleaned by the foam roller so that the minimal residual primer solution left in the tips and carried over into the next assay is well below the threshold concentration needed to produce amplification products. Finally, the PCR slugs were separated by a tracking solution in the PCR chip, which further dilutes the concentration of residual primer in the channel. We do not see any evidence showing that significant cross-contamination occurred and affected the melting analysis quality.
PCR/HRMA Testing
There are numerous potential applications for this platform including pharmacogenomics, inherited disease screening, and cancer screening. Assays can be designed to detect individual mutations or scan to determine if any of several possible mutations are present.
Figures 9
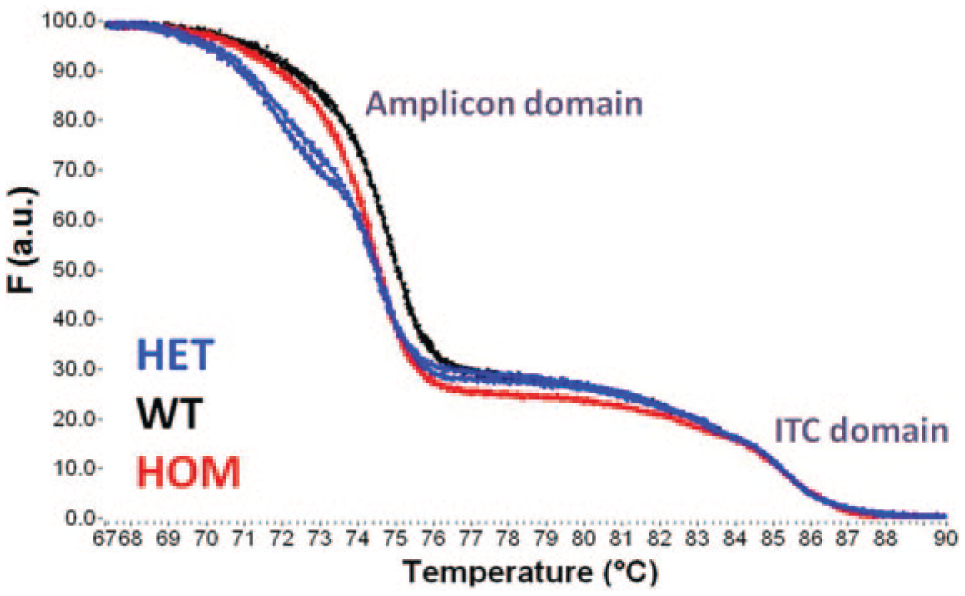
Normalized fluorescence degradation curves for a small amplicon assay: G542X G>T. This is one of 23 CFTR disease-related mutations recommended to be included in a core cystic fibrosis transmembrane conductance regulator panel. 29 Samples run in duplicate. HET, heterozygous; HOM, homozygous mutant; WT, wild type. PCR condition: 35 cycles (95/60/72 °C, 1/4/5 s). Melt at 0.5 °C/s.
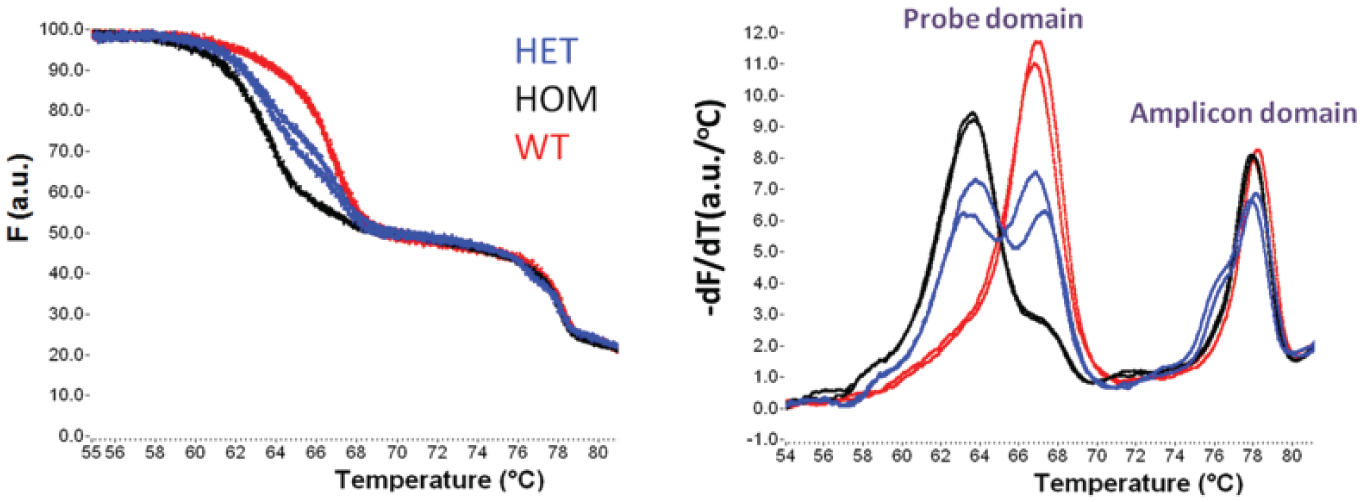
Unlabeled probe assay: ΔI507 (deletion of ATC). (Left) Normalized fluorescence degradation curves. (Right) Negative derivative plots of same data. Samples were run in duplicate. HET, heterozygous; HOM, homozygous mutant; WT, wild type. PCR condition: 50 cycles (95/60/72 °C, 1/4/5 s). Melt at 0.5 °C/s.
Later in the run with the same microfluidic cartridge, a different PCR protocol was used for an unlabeled probe assay ( Fig. 10 ). In this case, the number of cycles was increased from 35 to 50. This assay, ΔI507 (deletion of ATC), is another of the 23 mutations recommended to be included in a core CFTR panel and results in two melting domains. Genotypes are distinguished by features in the probe-melting domain, which shows differentiation of genotypes at lower temperatures than in the assay shown in Figure 9 . Because the thermal melting profile of the wild-type and homozygous mutant differ by more than 1 °C, it is not necessary to use an ITC to normalize between channels.
In both examples, the PCR cycle time was approximately 10 s, making the elapsed time for PCR amplification of the G542X and ΔI507 alleles less than 6 and 9 min, respectively. Furthermore, in both examples, the thermal ramp rate was conducted at 0.5 °C/s, which is considerably faster than conventional thermal melting ramp rates (typically 0.01–0.04 °C/s). 31 The ability to rapidly amplify and conduct thermal melting assays is a distinct advantage of the current system.
In another study, we conducted a more extensive investigation of the ability of using this platform to detect common single-nucleotide variants associated with thrombophilia. In that study, Sundberg et al. 32 reported 100% correct genotyping in blinded studies of 100 samples at two different sites.
Production Considerations
The microfluidic cartridge that we have developed for use in this system is fully disposable. Thus, the cost of producing the cartridge is a critical factor to be considered. The most costly component of the cartridge is the PCR chip. The material costs of fused silica with gold and platinum metalization are high, relative to less complex devices. Because the chip is manufactured using methods and tools commonly used in semiconductor and fine optical system technology, however, the costs scale inversely with quantity. At low numbers required for prototype development, the cost per chip is prohibitive. As the number of chips produced scale to tens to hundreds of thousands of units, the cost per chip is well within what is needed for use in medical genetic applications. Furthermore, during the prototype stage presented in this article, the PMMA parts of the cartridge were produced by machining PMMA stock, and the cartridge was assembled largely by hand. Under these conditions, producing cartridges with highly reproducible channel dimensions was a challenge. Furthermore, hand assembly has resulted in scale-up issues commonly found when moving from prototyping to production scale. We have since developed injection molding tools for the polymer parts, which have significantly improved the reproducibility of the channel dimensions and dramatically reduced the cost of production. Automating the cartridge assembly steps is under way, and we have seen improvements in quality and yield as we have been incorporating automation.
The automated microfluidic platform offers several significant advantages compared with current PCR instruments. First, the PCR and melting analysis component were integrated with the automated sample delivery system, which reduced the time, cost, and potential error of tedious bench work. Another advantage of the integration is that it enables the end user to program in real time a test based on the previous results. For instance, it allows the end user to repeat certain tests or select a genotyping test based on the result of a previous genotyping result in the same run. To the best of our knowledge, no such commercial PCR instrument has this function. Second, this system has a novel image-based flow control system based on the sensitive Canon 5D digital camera. This provided a simple and effective method of dynamic flow control in the microfluidic channels allowing the ability to perform PCR serially. The system used only pneumatic control to drive the fluid slug through the channels and junction between the interface module and the PCR chip. Finally, the embedded thin-film heaters beneath the microfluidic channels proved that this system can dramatically reduce the PCR and HRMA time. It is possible to complete a PCR of 35 cycles in just less than 6 min and complete a thermal ramp in 1 min for HRMA. The quality of amplicon melting curves recorded by the same camera that was used for flow control was sufficient for genotyping by both amplicon- and probe-melting assays, indicating that the system has the potential to be used in clinical applications.
Footnotes
Acknowledgements
We would like to thank Ms. Ling Xu and Ms. Lingxia Jiang for design of the CFTR and MCAD assays, respectively. We would also like to thank Ms. Harini Shandilya and Ms. Rachael Demara for conducting the experiments that demonstrated those potential applications. Regarding regulatory status, the PCR HRMA system used in this study was for research use only. It was not used to diagnose patients.
Declaration of Conflicting Interests
The authors declared no potential conflicts of interest with respect to the research, authorship, and/or publication of this article.
Funding
The authors received no financial support for the research, authorship, and/or publication of this article.
References
Supplementary Material
Please find the following supplemental material available below.
For Open Access articles published under a Creative Commons License, all supplemental material carries the same license as the article it is associated with.
For non-Open Access articles published, all supplemental material carries a non-exclusive license, and permission requests for re-use of supplemental material or any part of supplemental material shall be sent directly to the copyright owner as specified in the copyright notice associated with the article.