
Abstract
To achieve maximum clinical utility, cell-based assays must produce reliable and reproducible results. To address these issues, we have developed and incorporated two automated systems into the ChemoFx assay (Precision Therapeutics, Inc., Pittsburgh, PA), a cell-based assay used to assess chemosensitivity and resistance of tumor cells to a spectrum of chemotherapeutic agents. An automated liquid-handling system plates cells and prepares and applies chemotherapeutic agents. Separate well-imaging and cell-counting systems quantify cell counts. In addition, we have developed a computerized tool to validate the accuracy of the cell quantification system. We report here that these automated systems improve the accuracy and precision of the ChemoFx assay. These systems also reduce technician time and human-induced variability. We propose that such automated systems could be incorporated into other cell-based assays and would provide increased confidence that such assays could be used to provide clinically useful information.
Keywords
Introduction
Drug development studies and diagnostic testing rely on reproducible and reliable assays. In the field of oncology, measuring cell proliferation and survival in the face of a chemotherapeutic challenge can provide invaluable data affecting clinical decisions. Unfortunately, such measurements of cell growth and survival in vitro have historically lacked consistency and reproducibility, limiting the application of such assays.
Because cell counting was seen as a major contributor to inconsistency and poor reproducibility, a number of methods have attempted to indirectly measure cell growth. An early method involved measuring titrated thymidine incorporation into DNA as an indication of cellular proliferation. 1 Similarly, 32P-ATP turnover has been used as an indirect measure of cell growth. 2 These methods provide a quantifiable means of measuring and comparing cell growth, but the results are difficult to translate into cell survival or cytotoxic index for broader biological importance. Later developments, such as the MTT3 and XTT4 assays, which measure mitochondrial metabolic activity, are also suboptimal because they assume that increased metabolic activity correlates directly with increased growth. These assays also suffer from high degrees of inconsistency and often lack reproducibility.
The most effective way to measure growth or survival is to count surviving cells remaining after a period of treatment. In general, however, methods that attempt to count surviving cells are challenged by inconsistencies in assay techniques and cell quantification. Given the importance of companion assays for drug development and usage, techniques that improve the consistency and reliability of cell-based assays would greatly benefit the development of drug response markers for clinical use and potentially new chemotherapeutic agents for cancer treatment, among other applications. 5
This report describes how automated liquid handling and cell quantification systems improve assay consistency, enabling the ChemoFx assay (Precision Therapeutics, Inc., Pittsburgh, PA), a cell-based chemosensitivity and resistance assay, to be highly consistent and reproducible. In addition, these automated systems greatly reduce technician time and effort thus increasing the throughput of the assay.
Materials and Methods
ChemoFx Assay
The ChemoFx assay was performed as described previously. 6 8 The cell-based assays described here were performed using SK-OV-3 (American Type Culture Collection, Manassas, VA), an established cell line used as quality control cell line for the ChemoFx assay. Briefly, cell cultures were plated and incubated 24 h to allow cell attachment. Then, cells were treated with chemotherapeutic agents (untreated cells were used as a control). For each chemotherapeutic agent, 10 serially diluted drug concentrations were tested in triplicate. After an incubation period of 72 h, the cells were fixed and stained with 4',6-diamidino-2-phenylindole (DAPI), a fluorescent DNA stain for imaging of the nucleus.
The percentages of cells remaining after drug treatment were used to determine survival fraction (SF = average cell countdose x/average cell countcontrol). Then, dose—response curves were plotted to evaluate log EC50 values. Furthermore, each dose—response curve was scored using a numeric system from 0 to 10, referred to here as the response index (RI) score, a metric based on adjusted areas under the curve. 9 For validation studies, log EC50 and RI score were used as metrics to measure the effects of experimental changes. Changes of no more than 0.5 in log EC50 and 0.6 in RI score were considered acceptable.
Liquid Handlers
Liquid handlers are used to minimize human error while increasing accuracy, precision, and efficiency in the ChemoFx assay. An Oasis LM 1202 liquid handler (Dynamic Devices, Inc., Wilmington, DE) equipped with a 1000-μL capacity 96-tip tool was used to automate the assay processes. The liquid handler is supplied with Method Manager software to develop and run various types of robotic pipetting scripts. Specifically, liquid handlers are used for cell plating as well as drug preparation and application in the ChemoFx assay. Additionally, generic operations such as precoating, fixing, and staining cell plates have been automated through the use of liquid handlers. Automation of these procedures frees technicians to simultaneously perform other laboratory tasks, increasing efficiency and thus throughput of the clinical laboratory.
To ensure proper performance of liquid handlers, axis calibration and volumetric validation procedures are performed regularly. The volumes of sample delivered by the liquid handler are compared with reference samples delivered by technicians using pipettes calibrated on a quarterly basis. The liquid sampled is a solution of eosin (Sigma-HT110232, 0.05%w/v) diluted 1:10 with deionized water. Actual volumes are determined by measuring absorbance at 450 nm.
Cell Quantification: PlateScan Systems for Well Imaging
To further improve the reproducibility of the ChemoFx assay, automated imaging systems were developed (Fig. 1a, b). The optics were designed to image an entire well in a 384-well plate in a single frame, a field that is approximately 2.7 mm × 2.7 mm. The scanning systems are equipped with a simple motorized
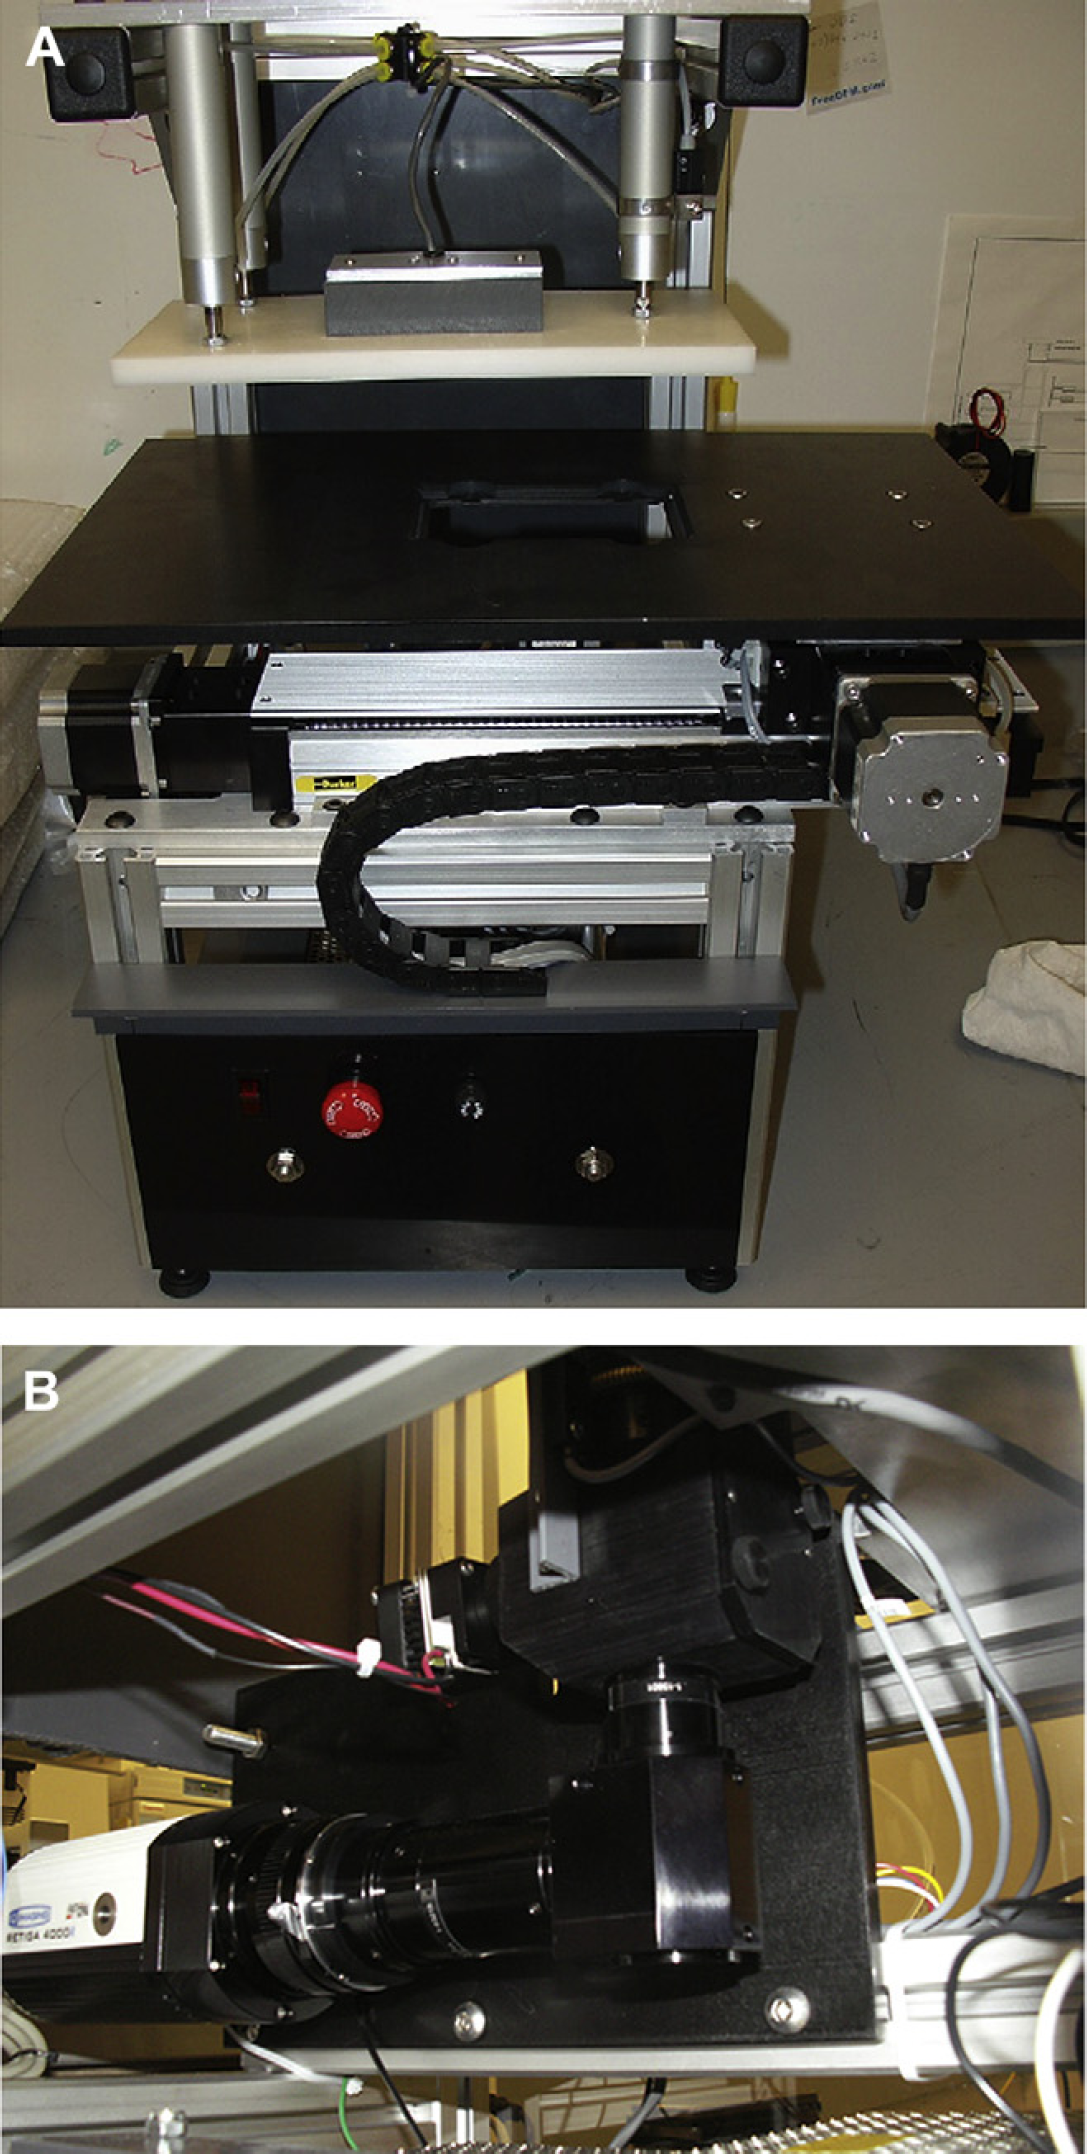
(A) Photograph of scanning system. A 384-well micro-plate is placed on the stage and moved into position with a motorized
We selected Navitar ZFL optics with a right-angle adapter to develop a low magnification imaging system with a motorized focusing unit and a single channel fluorescence cube holder (Navitar, Rochester, NY). A high resolution Retiga 4000 camera with a square field is used to capture images (QImaging, Surrey, BC). These optics support single-channel fluorescence (DAPI) and transmitted light imaging using Kohler illumination. Light emitting diodes (LEDs) are used for the transmitted and 365-nm fluorescent light sources. The LEDs eliminate the need for mechanical shutters and provide long service life. They are configured to strobe with the electronic shutter of the camera and thus can be operated at higher than rated current for greater intensity and corresponding short exposure times of 10–50 ms. As such, the use of LEDs reduces scanning time and cost, compared with expensive conventional mercury lamp light sources.
Operation of the imaging systems has been optimized for use with Corning Product #3712, clear bottom, black wall, 384-well polystyrene plates (Corning, Inc., Corning, NY). Because these plastic plates exhibit some warping, the software uses two autofocus operations to ensure the best quality images are collected from each well. First, six widely spaced active wells are imaged to obtain an optimal focus position for each of these wells. Then, a least-square fit method is used to determine the plane of the microplate. This computed plane is used to initialize the optimal focus position of every active well that will be scanned. During actual scanning, a set of images at slightly different focal positions that encompass the computed focal position is collected for each well and the image with the best focus is saved. Focus is determined using a simple contrast detection algorithm. When collecting fluorescent images, a transmitted light image is also taken and stored to show the well edge, which may be used in subsequent image analysis.
Cell Quantification: CellCounter Software
CellCounter software was developed at Precision Therapeutics to expedite cell enumeration after well image capture. A common image analysis technique, thresholding, was considered but rejected because it would not compensate for variations in background intensity, a problem on early systems. Instead, the counting process starts by applying a localized intensity filter. All rows and columns of pixels in the well images are scanned for a maximum intensity that meets minimum values for width and intensity. The resulting maximum pixels are aggregated into clumps created from all local pixels that are horizontally, vertically, and diagonally adjacent. Clumps that are below a specified size are discarded as debris. Next, the remaining clumps undergo an erosion step to differentiate nuclei that are in close proximity. Erosion is based on the average intensity of the clump. Clumps are eroded by removing the dimmest pixels, which shrinks the size of each clump to resolve multiple clumps that have merged together. The remaining clumps are then processed in a dilation step that merges clumps from the same large objects that are not continuous. The dilation is an iterative process. In each pass, the unmarked pixels adjacent to clumps are added to the clump if they are in contact with a specified number of pixels in the clump and have an intensity within a certain range of the average intensity of the clump. Finally, the clumps pass through a filter for total pixel size, elongation, and average intensity. Any clumps that pass the final tests are counted as cells (Fig. 2). For each well image, the area just inside the well edge is excluded from counting because of cell bunching and debris.
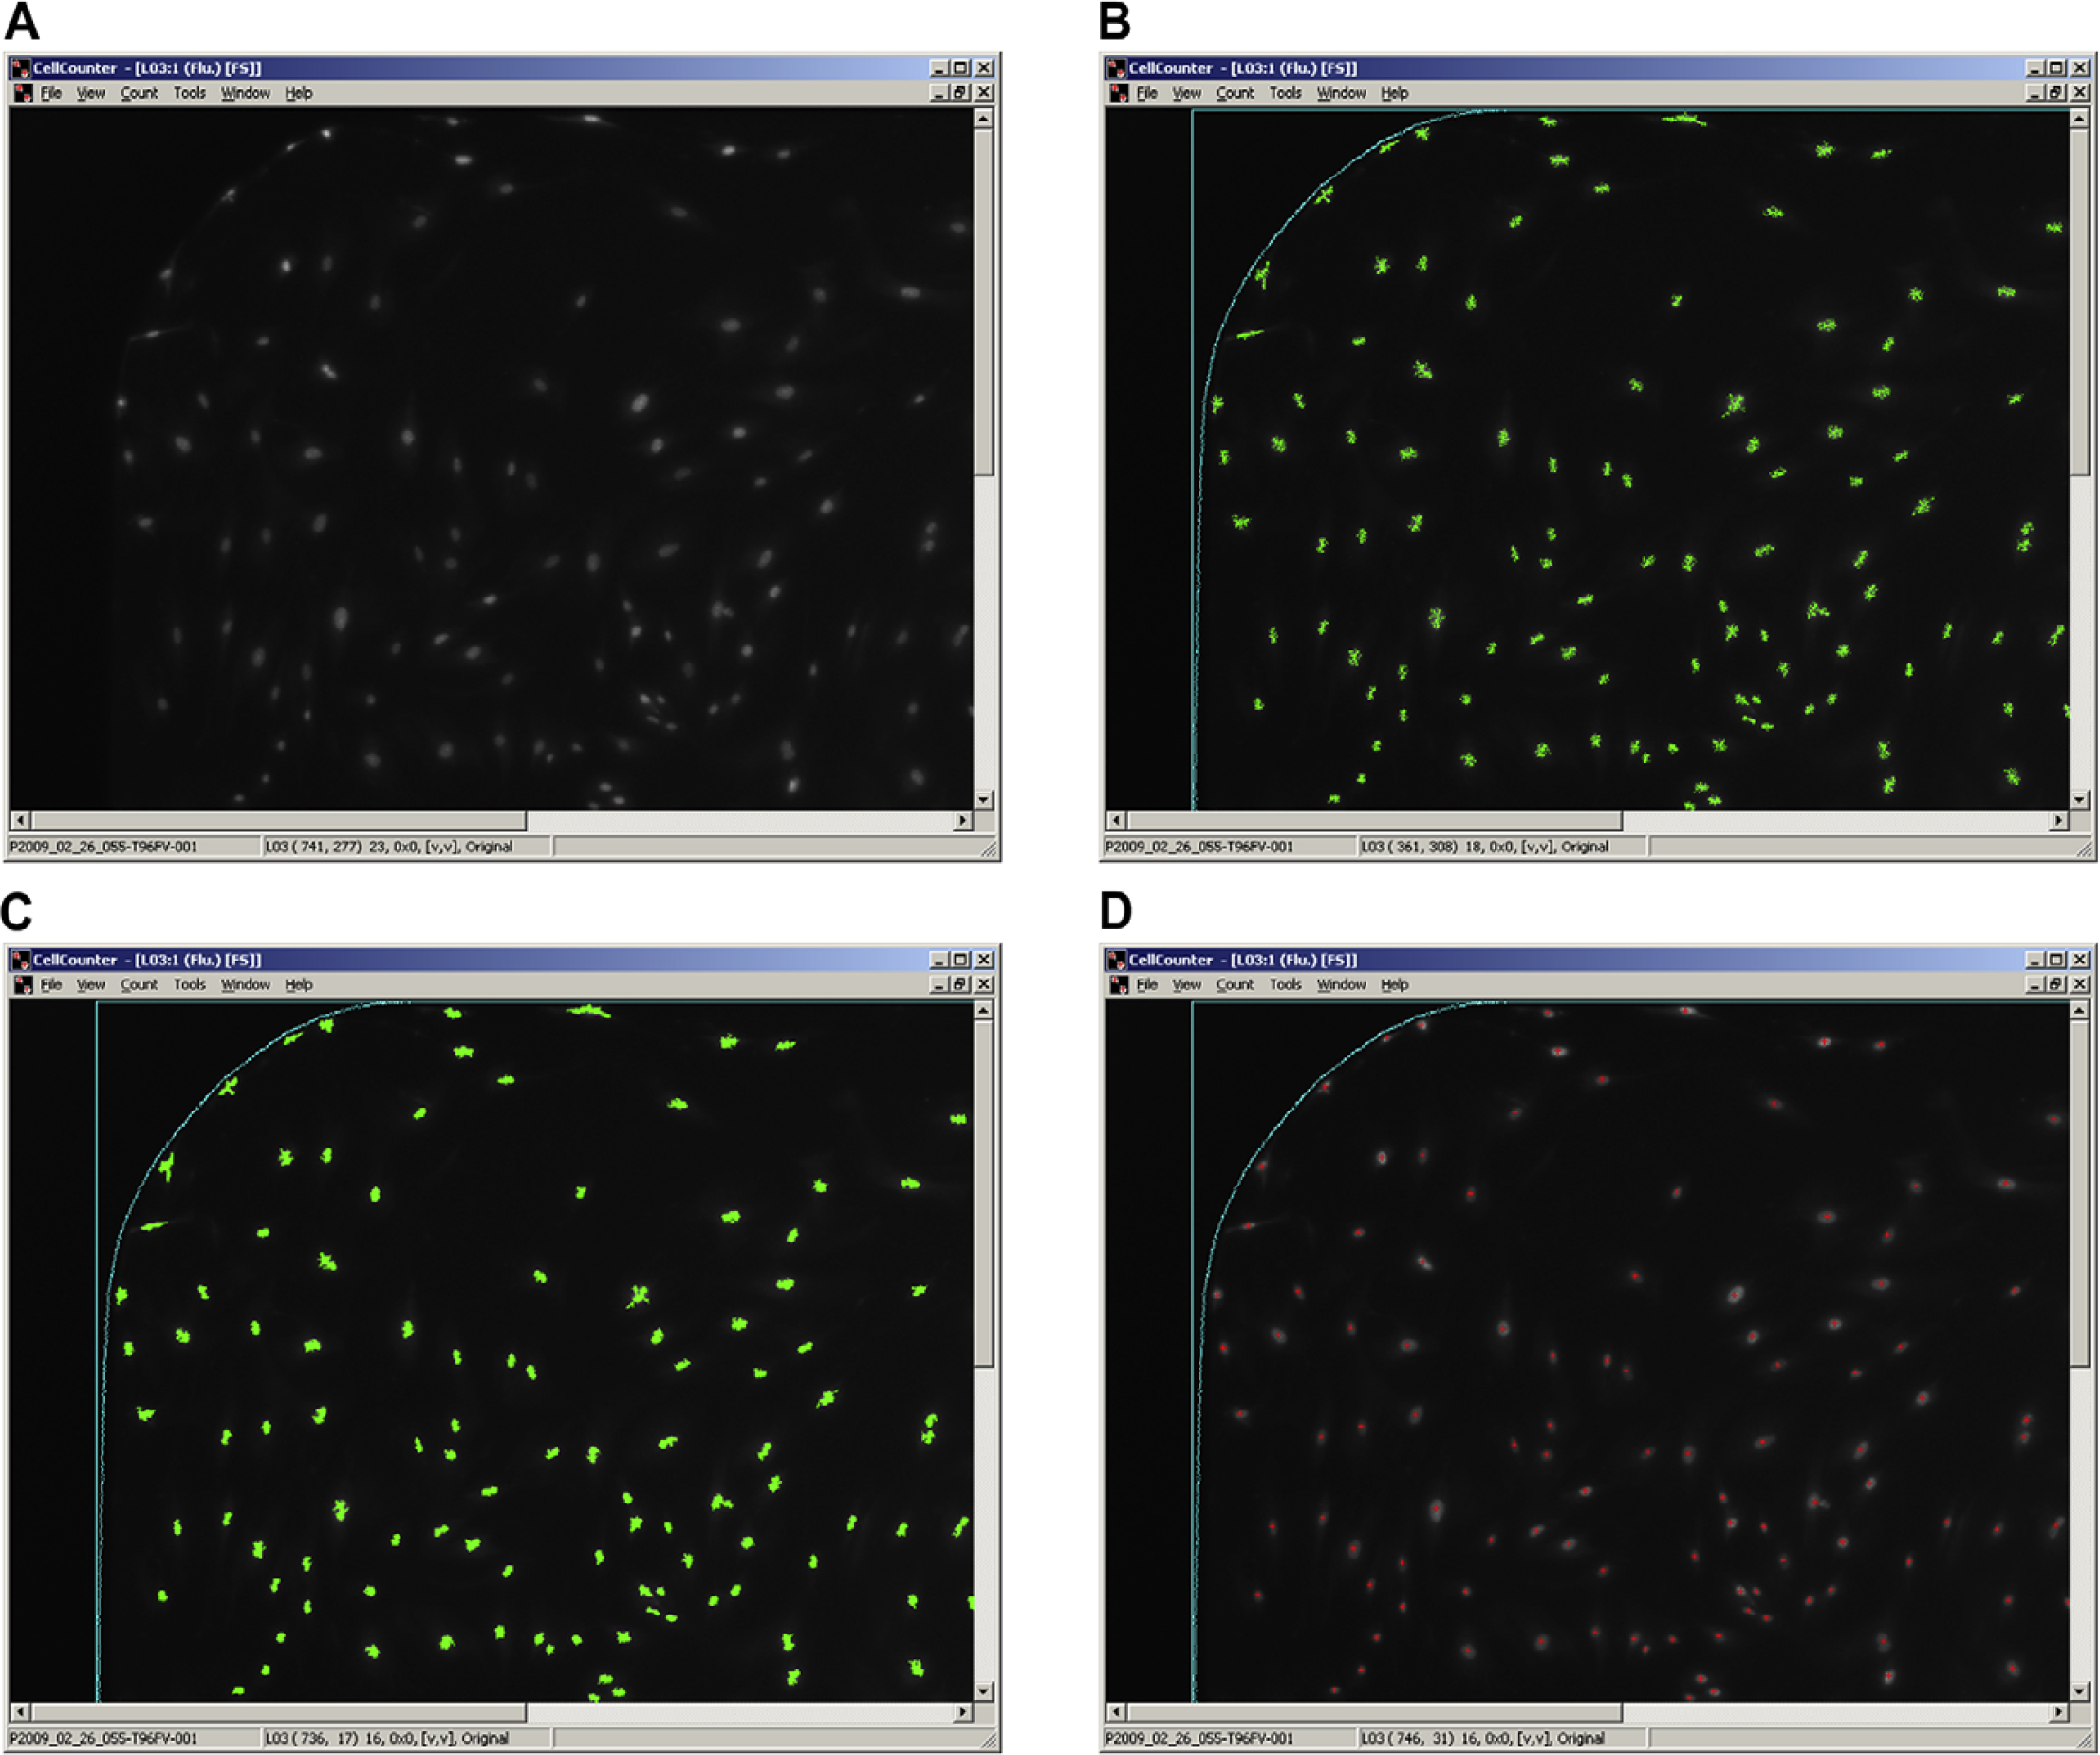
Cell quantification. Images are collected on automated well-imaging systems (A). Cell counting application locates nuclei using localized intensity filter (B). Clump erosion and dilation are applied (C). Filters are applied to the resulting objects (D).
An automated CellCounter (ACC) validation tool is used by technicians to evaluate the accuracy of well image cell counts. This process was developed in-house to minimize technician time spent counting images. After well images are saved via PlateScan software, CellCounter software is initiated on a remote server using default cell counting parameters, which are based on the most commonly used settings in the clinical laboratory. Well images with a graphical overlay indicating CellCounter output are then presented to a technician in a slide show format for acceptance or rejection based on image clarity and count accuracy. It is estimated that default counting parameters provide acceptable counts for approximately 80% of plates. As such, only 20% of plates are rejected and have to be manually counted by a technician. Historically, counting one plate would take 15 min. With this tool, it generally takes less than 2 min to validate counts, thus reducing technician time by approximately 80%. A secondary goal of the ACC validation tool was to increase counting quality. Specifically, for each assay the tool samples images of the same three wells (a control well, a specific middle-range dose well, and a specific high dose well) (Fig. 3).
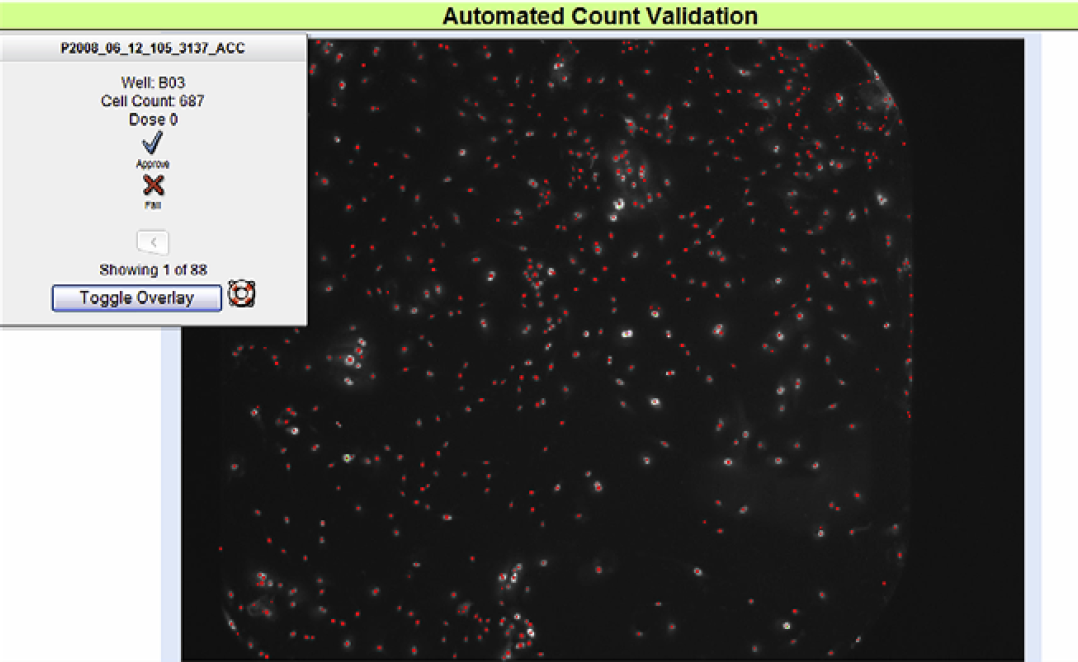
Automated cell count validation. Example of images presented to user in the Automated CellCounter Validation tool. Well image of fluorescent cells and with counted cells denoted with a red plus, “+.”
Results
Volumetric validation ensures accuracy and precision of liquid handlers. To demonstrate the accuracy and precision of the liquid handler in delivering specified volumes of cell samples, three different liquid handlers each delivered four different volumes of samples to 192 wells. The volumes sampled, 10, 40, 80, and 100 μL, were chosen because they cover the range of volumes routinely used in the ChemoFx assay in the Precision Therapeutics Clinical Laboratory. The volumes delivered by the three liquid handlers were indistinguishable from the expected volumes and from each other (
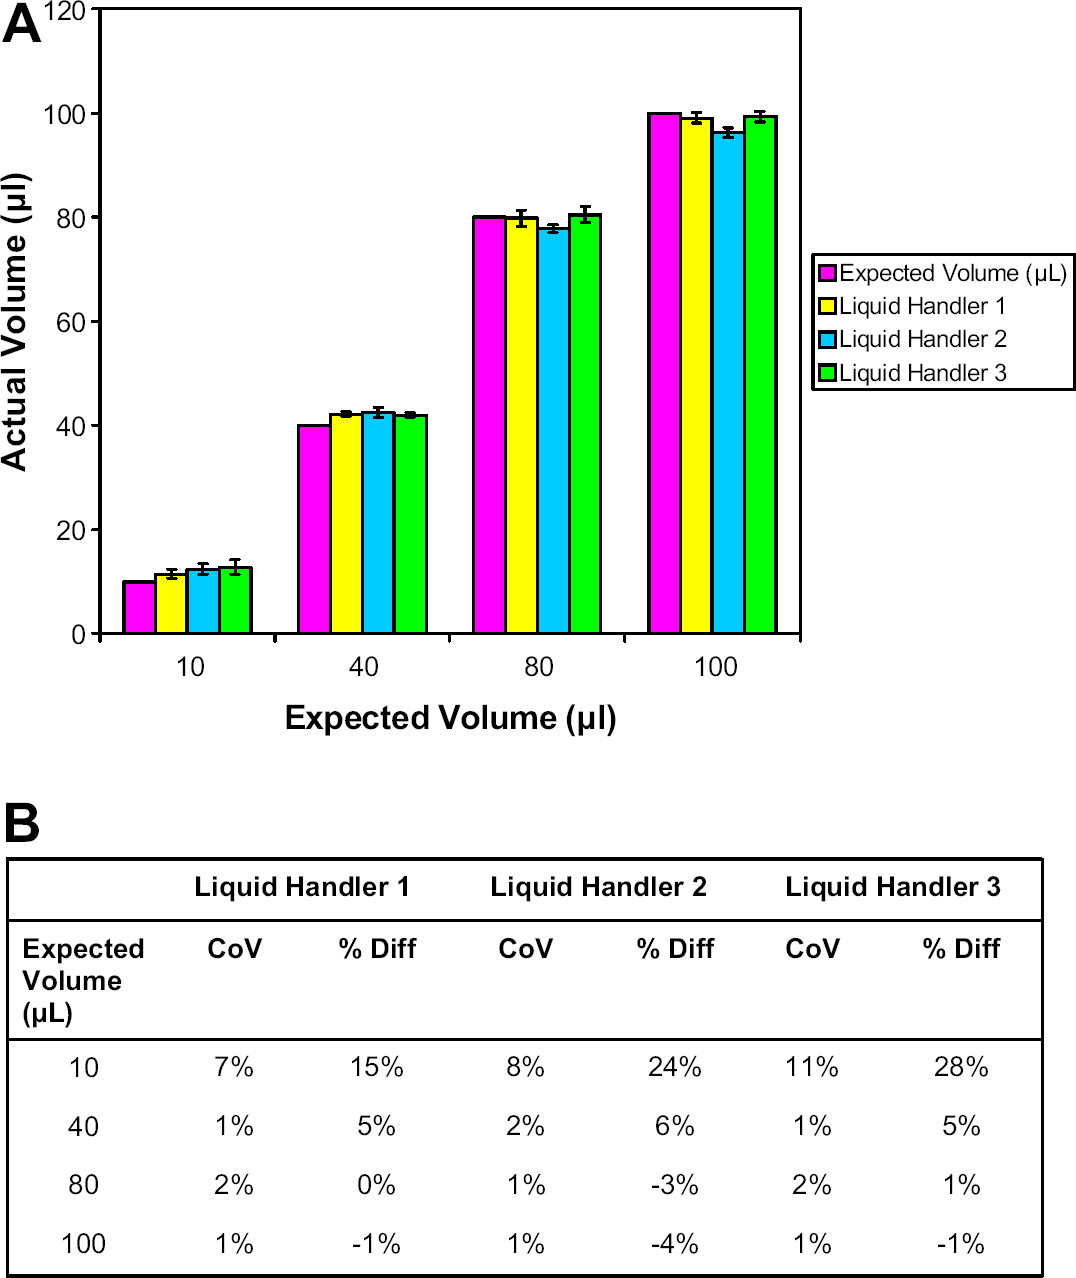
Summary of liquid handler volumetric results. Volumetric validation results over relevant assay volumes for three liquid handlers. (A) Graphical data shown are the average ± the standard deviation. (B) Table shows CoV for each volume and percent difference from expected volume. The volumes delivered by the three liquid handlers were not statistically different from the expected volumes or from each other (
Automated techniques improve consistency of cell plating, drug preparation, and drug application. To determine whether using the liquid handler improves the precision of the ChemoFx assay, the assay was performed using both manual and automated methods for cell plating, drug preparation, and drug application. Ten technicians manually performed a total of 13 assays over 9 days. Three technicians used the liquid handlers to perform a total of 18 assays over 9 days. The assays were performed on SK-OV-3 cells using 10 doses of doxorubicin, (2 nM–1.2 μM). Mean log EC50 and RI score values were similar for the manual and automated techniques (Fig. 5). The CoV was less than 12% for the manual method and less than 5% for the automated method. Both standard deviation and the range between minimum and maximum log EC50 values were lower for the automated process indicating increased precision of the assay when performed using the liquid handler for cell plating, drug preparation, and drug application.
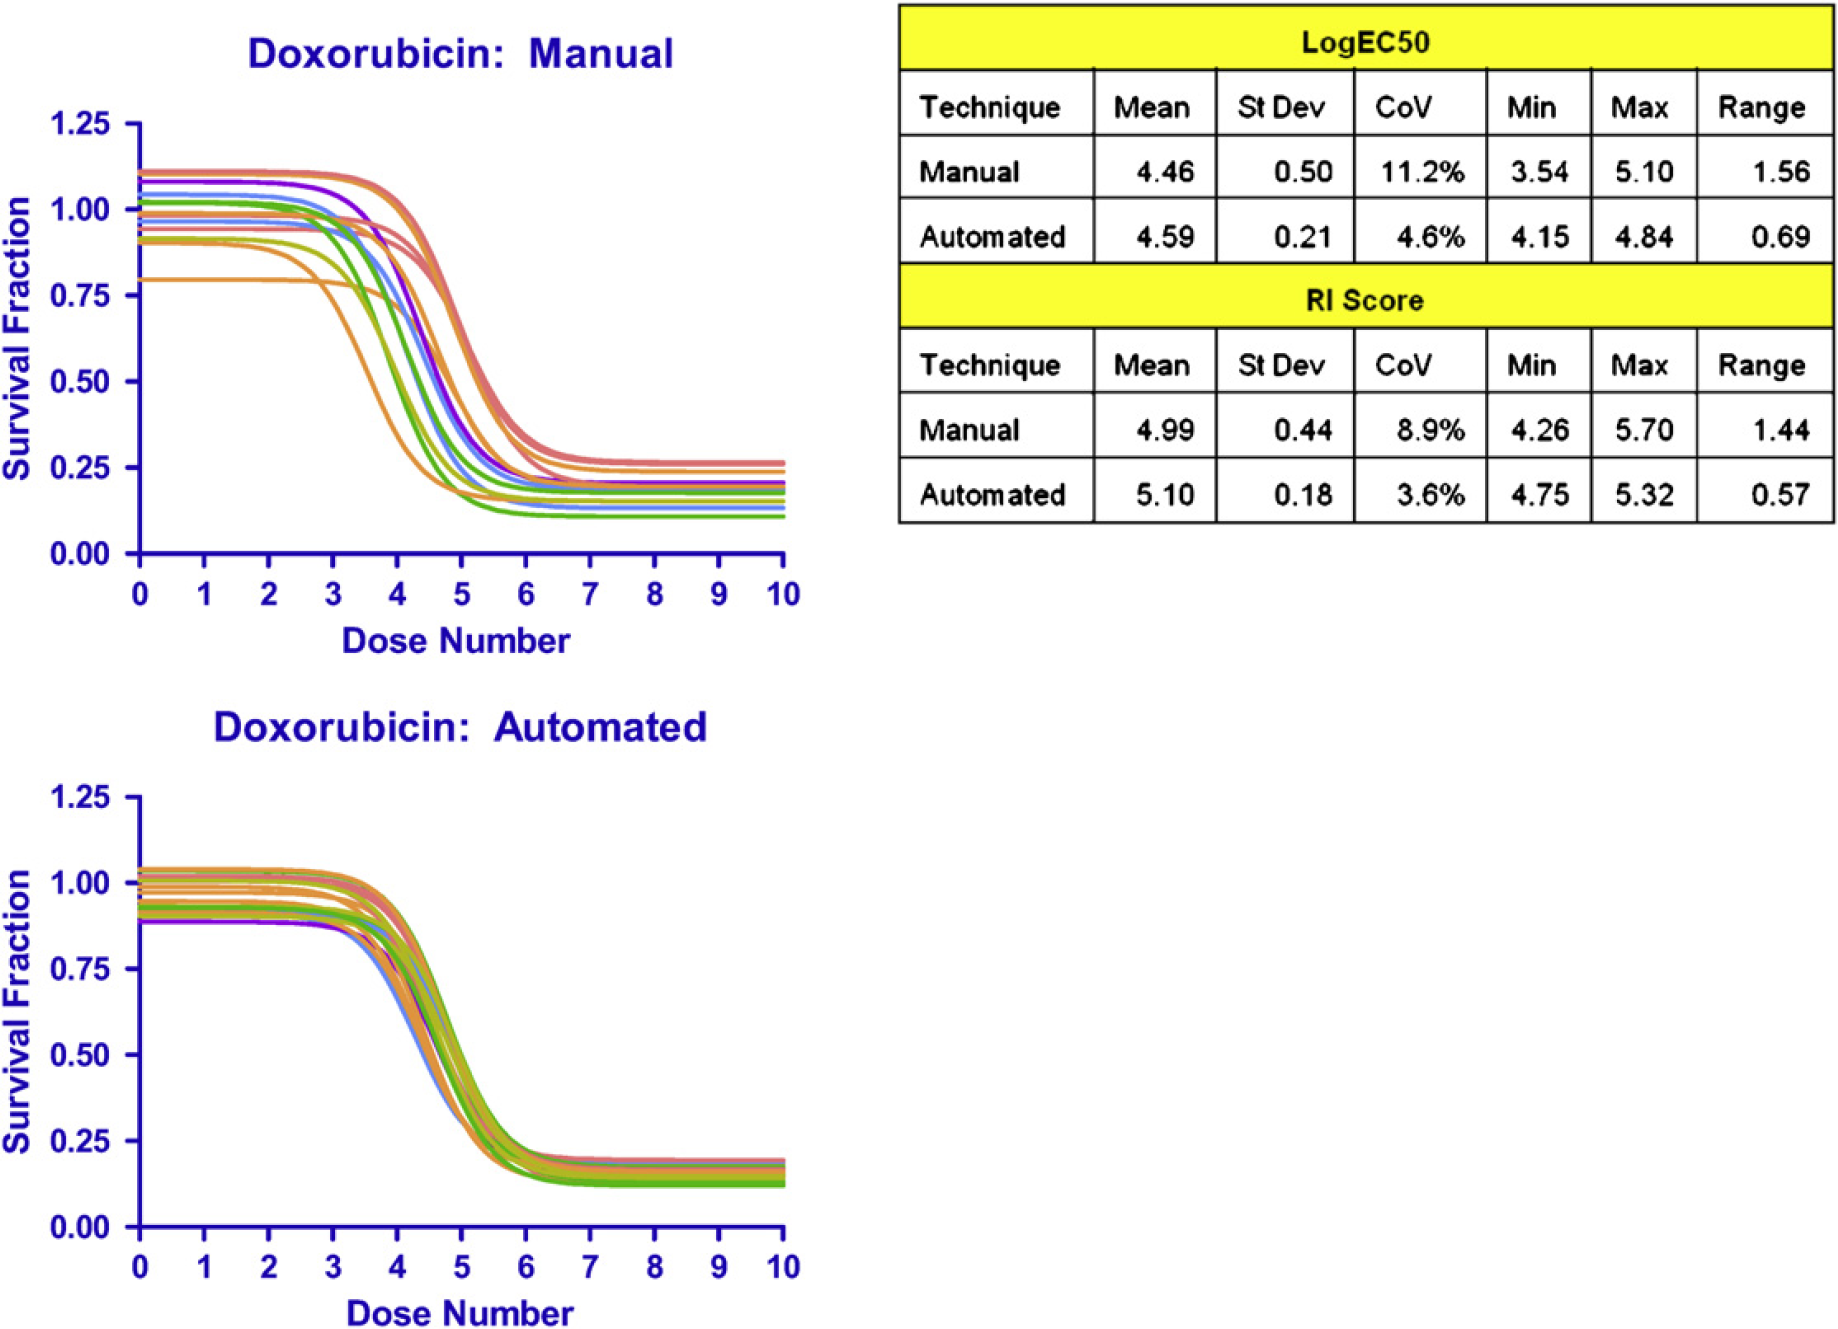
Effect of manual versus automated cell plating, drug preparation, and drug application on precision of ChemoFx assay. The assays were performed on SK-OV-3 cells using 10 doses of doxorubicin. Thirteen assays were performed manually and 18 assays using automated liquid handling.
Cell quantification systems yield reproducible results. Analyzing images of tumor cells undergoing treatment by chemotherapy agents presents numerous imaging challenges. Different cell lines may absorb different amounts of DAPI stain or their nuclei may differ in size. Within a cell type, alterations in cell morphology can occur across drug concentrations as the cells respond to increasing effects of the chemotherapeutic agent. Furthermore, some agents can cause multinucleation, partial division, or clumping. Some wells may have considerable cell growth approaching confluence, which can result in causing the cells to bunch up, compress, or change shape. Finally, some wells may have significant background signal because of variations in the washing portion of the fixing and staining procedure or the amount of cellular debris remaining on the plate. All of these issues had to be addressed in the cell counting software.
Control well cell counts are important because they are the basis for determining survival fraction in the ChemoFx assay. To validate the automated scanning system, control well cell counts for each of six cell sources were assessed using five different machines. The six cell sources were chosen for a variety of size and morphology: three patient tumor samples (ovary, lung, colon) and three cell lines (SK-OV-3, A-549, UACC812). Assessing various cell types was important because the clinical laboratory receives a wide range of cell types for commercial analysis. Similar (
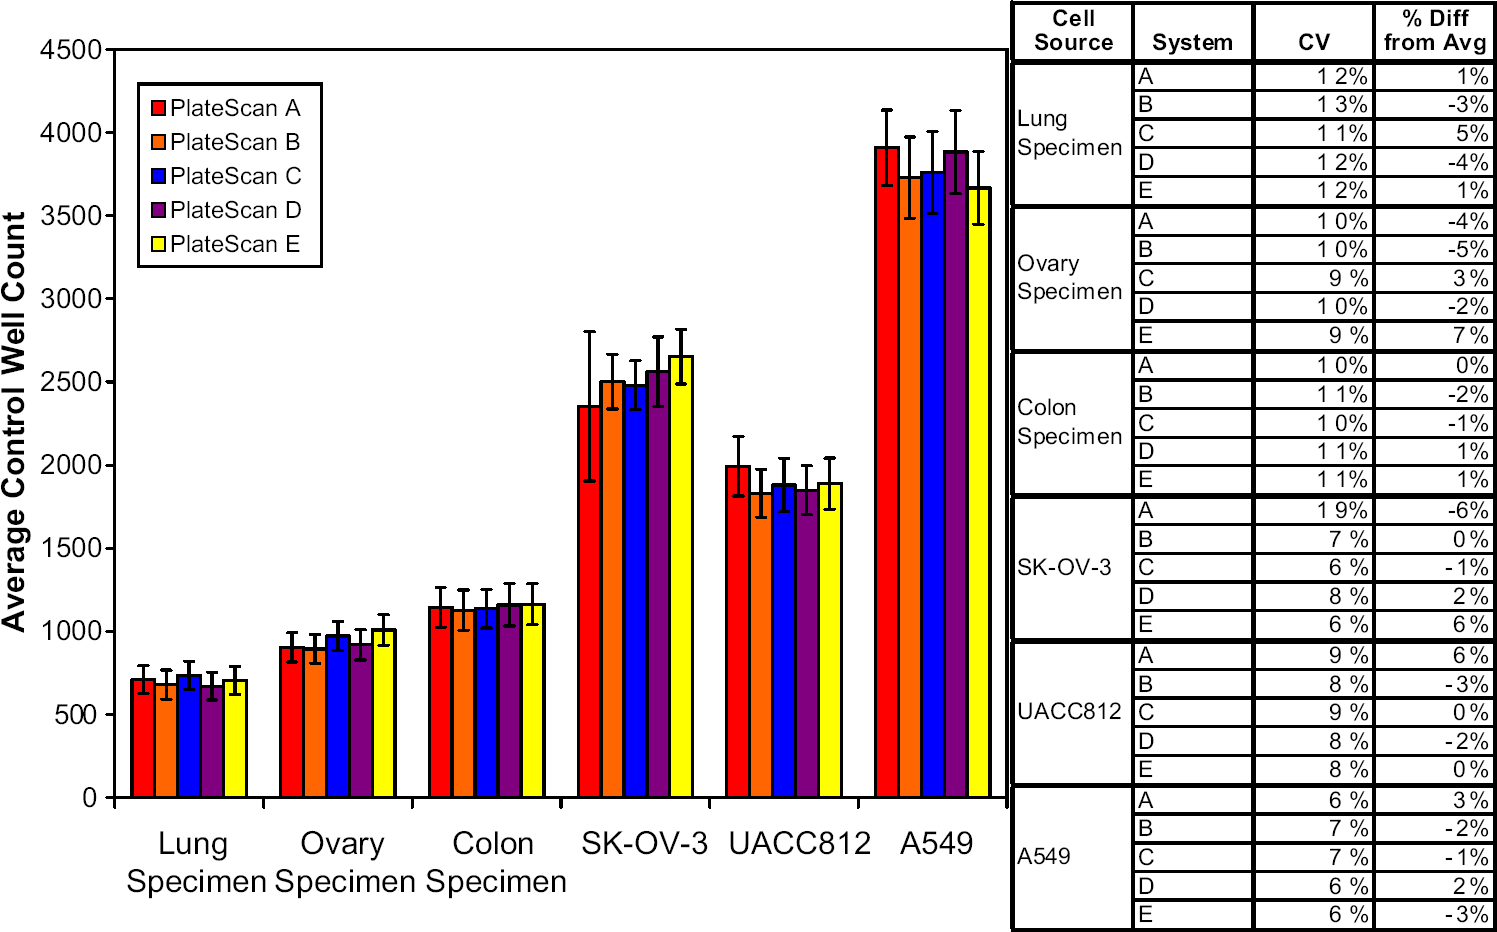
Control well cell counts for six cell sources scanned on five PlateScan systems. Six cell sources were chosen for this analysis for a variety in size and morphology: three patient lines (ovary, lung, colon) and three cell lines (SK-OV-3, A-549, UACC812). Graphical data shown are the average ± the standard deviation. The table includes coefficient of variation for each PlateScan system and a percent difference from the average. PlateScan counts are not significantly different (
To further assess the precision of the scanning systems and the resulting effect on the precision of the ChemoFx assay, we evaluated the variability among the dose—response curves generated by the assay. A plate of SK-OV-3 cells treated with 10 varying doses of 3 different chemotherapeutic agents, cisplatin (0.2 μM–100 μM), doxorubicin (2 nM–1.2 μM), and paclitaxel (0.2 nM–0.1 μM) was scanned on 6 automated scanning systems. SK-OV-3 cells were chosen because they are the cells used for quality control in the clinical laboratory. The plate was scanned on the same day on all six scanning systems. Visually similar dose—response curves were obtained for all six PlateScan systems (Fig. 7). Minimal differences in log EC50 and RI scores were observed, as is evident from the resulting CoVs and ranges. These findings further confirm the high degree of precision of the assay when the automated PlateScan systems are used.
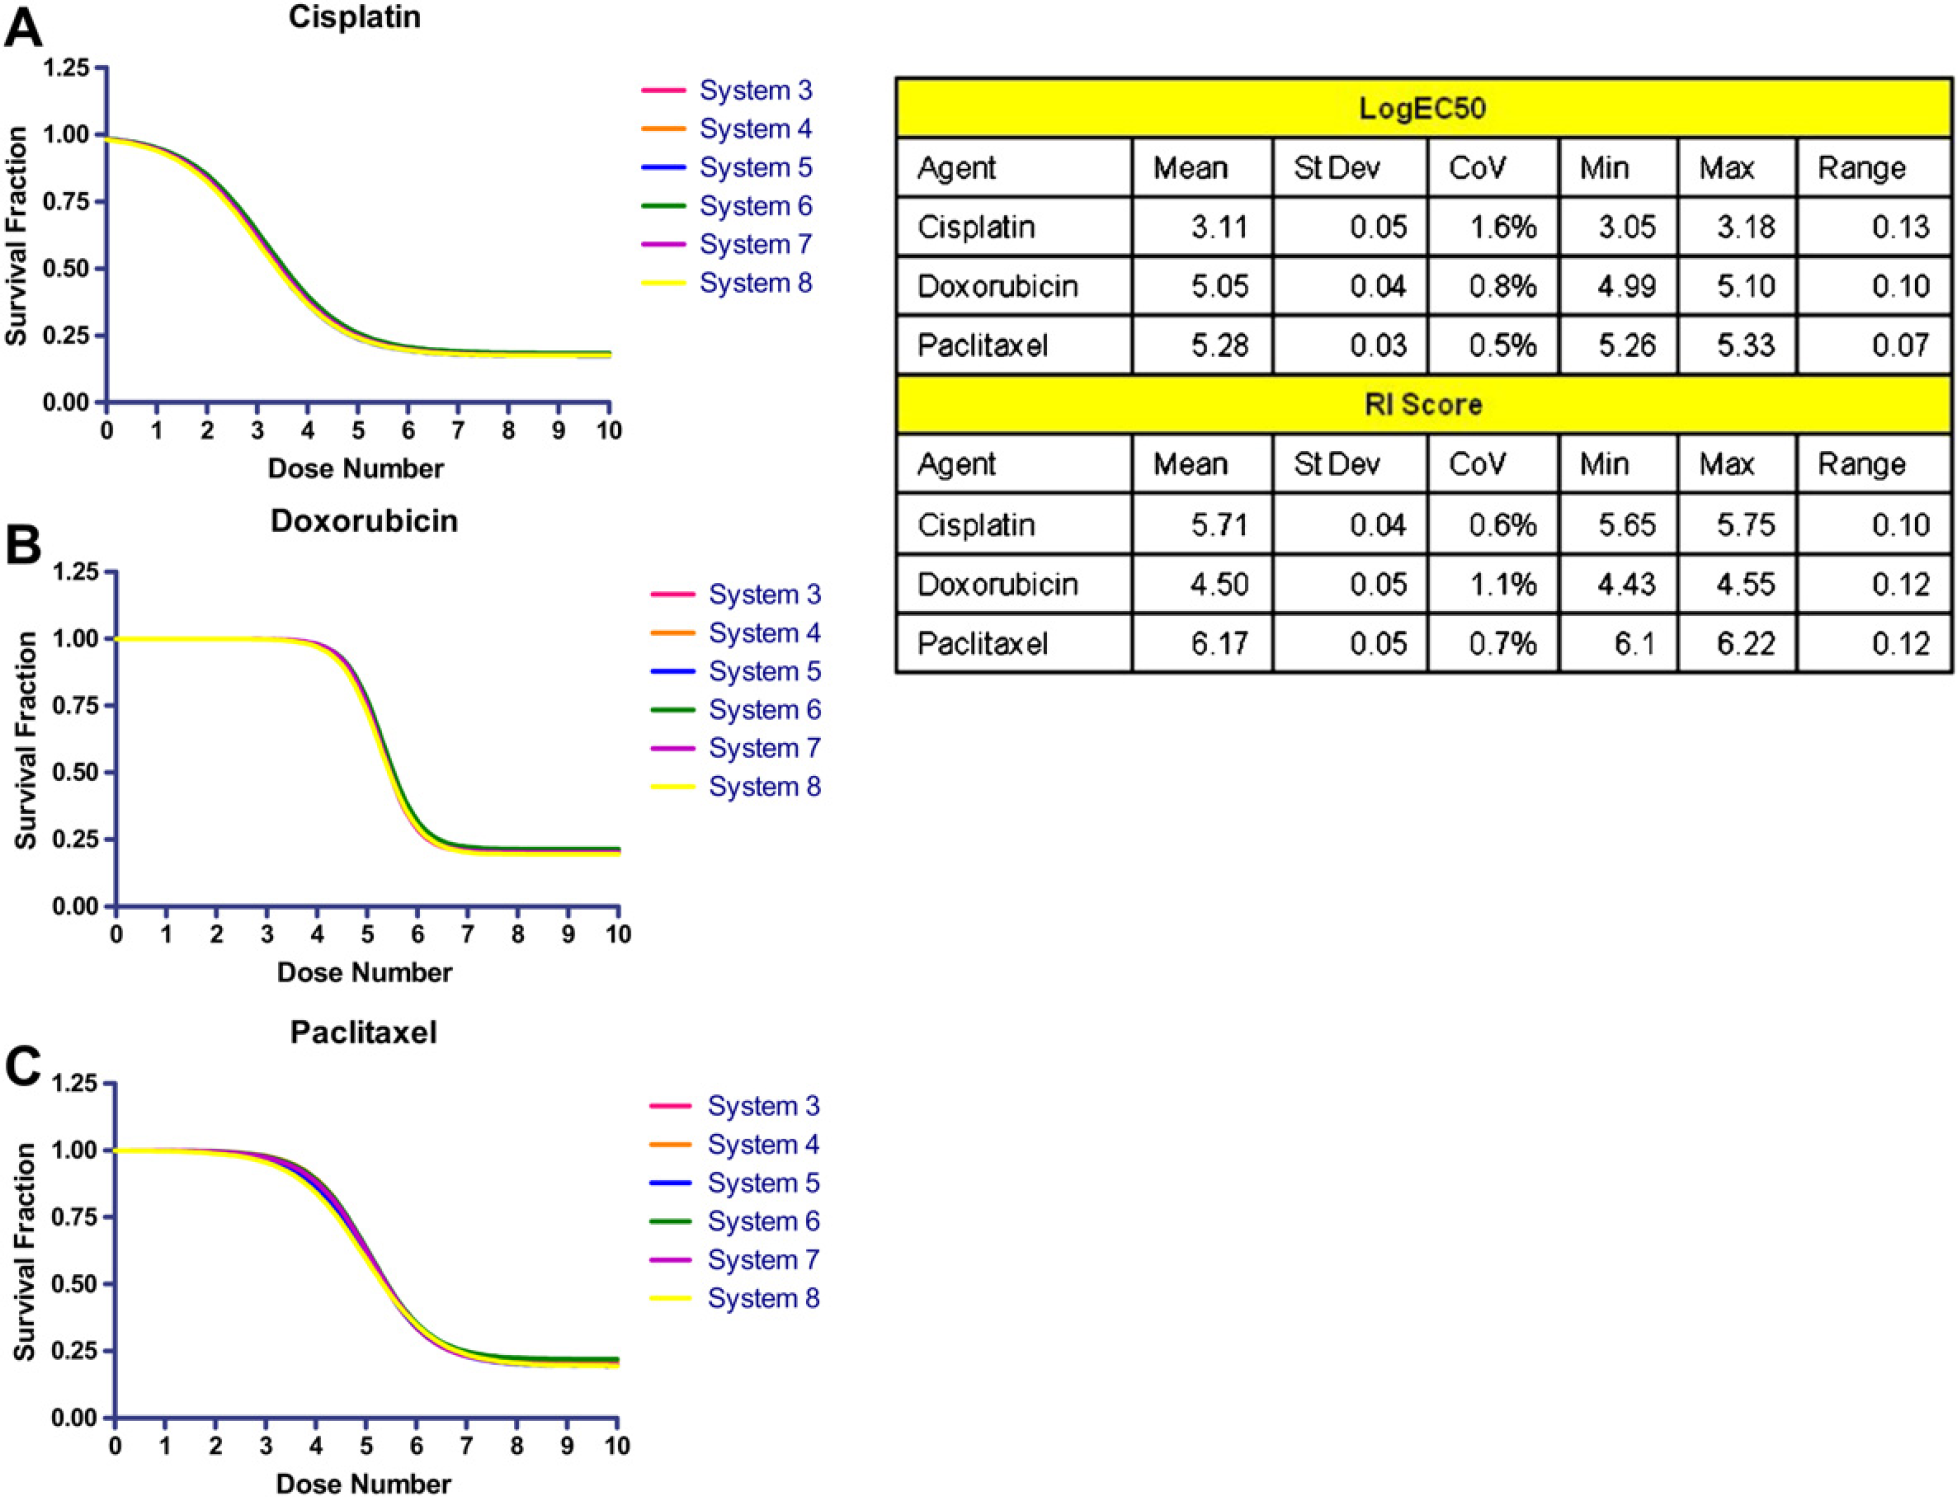
PlateScan consistency. Dose—response curves of SK-OV-3 cells treated with chemotherapeutic agents (A) cisplatin, (B) doxorubicin, and (C) paclitaxel scanned on six PlateScan systems. Log EC50 and RI score values show that each system produces similar assay results.
Conclusion
Cell-based assays have long held the potential to help define and measure many biologically important processes. Our studies have demonstrated that it is possible to control the inconsistencies historically associated with these assay systems. The ChemoFx assay performed by our laboratory measures the effects of chemotherapeutic agents on the growth of cancer cells derived as primary cultures from human tumors. The high rates of consistency and reproducibility that we have attained through automated techniques and stringent specifications maximize confidence that the information we provide to oncologists on drug sensitivity and resistance is as accurate and reliable as possible. Our previous findings that in vitro survival fraction, determined by the cell-based ChemoFx assay, correlates to progression-free interval in ovarian cancer patients in vivo 10 supports the usefulness of this assay to assist oncologists with regimen choices. Furthermore, automating processes involved in a cell-based assay has decreased the technician time required and increased the efficiency, making high-throughput feasible. The steps that we have taken to reduce variability in our cell-based assay are not specific to this type of chemotherapy testing. These same improvements can be applied to many cell-based assays and will provide increased confidence that such assays can be used to provide clinically useful information.
Acknowledgments
We thank Amanda Backner, Payal Nanavati, and Anuja Chattopadhyay for their assistance in data collection for this study; Nathanial R. Drake and Daniel Romanelli for their assistance in developing the software and hardware tools; and all members of Precision Therapeutics' Product Development Teams for their efforts in developing and implementing these methods for the ChemoFx assay. We also thank Theresa Cassino, PhD, for her assistance with organizing and drafting the publication and Janice Sabatine, PhD, Avanti Strategies, Pittsburgh PA, who received payment from Precision Therapeutics, Inc. for writing and editing assistance.