
Abstract
Backscattering interferometry (BSI), which uses a simple optical train comprising a He—Ne laser, a microfluidic channel, and a position sensor, has now enabled the measurement of both tethered and free-solution, label-free, molecular interactions within just nanoliters of sample. The simple macro-to-micro interface allows for a highly efficient assay work flow, which has been used to interrogate molecular binding interactions between proteins, ions and protein, and small molecules and proteins, with a high dynamic range of dissociation constants (K D) and unmatched sensitivity. With this technique, the equilibrium K D for several different binding partners was determined, typically using just picomole—micromole quantities of the binding pair at physiologically relevant concentrations.

Interferometry for Quantifying Molecular Interactions
When two or more light waves are superimposed, an interference pattern is created. By studying these patterns, the properties of the light waves and of the material that they have been in contact with can be explored. The field of research known as interferometry has led to the development of some of the most sensitive optical techniques available and has found applications in astronomy, microscopy, oceanography, metrology, seismology, and molecular interaction studies. 1 2 Conducting interaction studies with precision and efficiency is fundamental to the optimization of screening assays because these interactions are the groundwork for virtually all biological function. Although several different types of interferometers have been successfully used to study molecular interactions (e.g., Mach Zehnder), to our knowledge backscattering interferometry (BSI) is currently the only technology that facilitates both heterogeneous (tethered) 3 4 and homogeneous (free-solution) assays, 3 5 without sacrificing sensitivity. BSI has detection limits that are one to two decades better than other label-free techniques [e.g., isothermal calorimetry (ITC), surface plasmon resonance (SPR)]. In basic principle, interferometry measures the change in refractive index (RI), which is the speed of light in the medium, between the sample and the reference optical path. The RI is a complicated function dependent on the molecular dipole of the species in solution and the composition of the solvent. Structure, hydration level, and other second-order parameters dictate the magnitude of the molecular dipole of a compound. When two molecules bind or a ligand interacts with a complex, the result is a new compound or complex with an entirely different RI (molecular dipole) arising from changes in the level of hydration, structure, and other properties. In short, unexpectedly and nonintuitively, the RI of the new compound is measurably different than the sum or difference of the RI for the starting interacting components. BSI is unique among RI-based interaction sensors (others include SPR, waveguiding, and diffraction) because it interrogates the RI of the entire solution within the channel (including surface bound species) instead of only quantifying the film thickness at a surface. In addition to this advantage of bulk-solution interrogation, BSI also has a multipass sensitivity enhancement factor resulting from the characteristic interaction between the laser and the microfluidic channel, which operates as an optical resonance cavity. In combination, these features have allowed the detection of molecular interactions and conformational changes in free solution. 5 Furthermore, this unique tool has allowed the quantification of DNA hybridization 4 at pM sensitivity and interactions involving extremely small mass changes, such as a sugar binding to a tethered 100-kDa lectin in the heterogeneous format. 6
The bsi Instrumentation
BSI is a unique interferometric optical approach, in that the only necessary optic is the channel in the microfluidic chip. This characteristic allows for the use of a very simple optical train, depicted in Figure 1. In short, the instrument consists of a red helium—neon laser (Λ = 632.8 nm) that illuminates the microfluidic channel, a mirror to redirect the backscattered light, and a camera for transduction of the signal contained in the fringe pattern. This straightforward, unique approach to interferometry results in the relatively simple instrumental configuration used by BSI and is remarkable in light of the high sensitivity it achieves. Using a proprietary sample introduction interface, a relatively small volume of the sample (a few 100 nL to 1 μL) is easily pipetted into the channel with minimal sample loss. On changing the RI of the sample via calibration solutions or by introducing the reacting species, the interference fringes move as depicted in Figure 2A. As shown in the intensity versus position trace (Fig. 2B), the BSI signal is found in the spatial output of the camera. Using a proprietary position-sensing algorithm, the position of the fringes is monitored in real time at ultra-high resolution (10s of nanometers) and displayed as a BSI signal versus time trace. This output can be used to quantify the magnitude of BSI signal, which is related to the RI response to a change in solute concentration or to a binding event. Sample analysis time is approximately 30 s per sample. Future automation of BSI instrumentation with multichannel, automated plate reading capabilities is expected to provide high-throughput screening of over eight samples per minute.
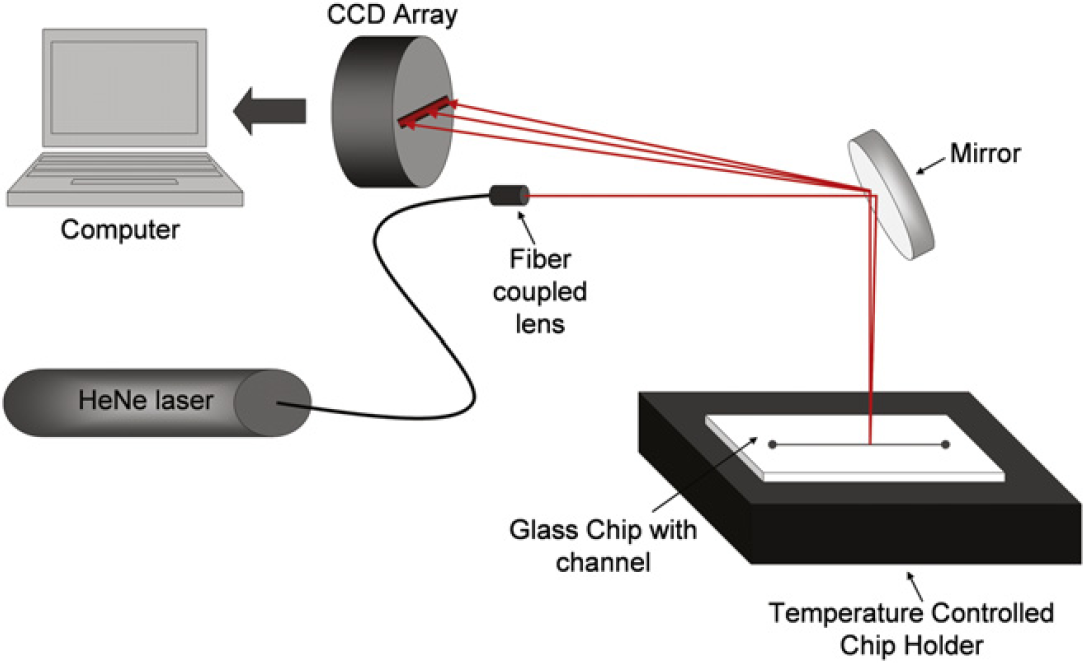
Block diagram of backscattering interferometry illustrating the simple optical train.
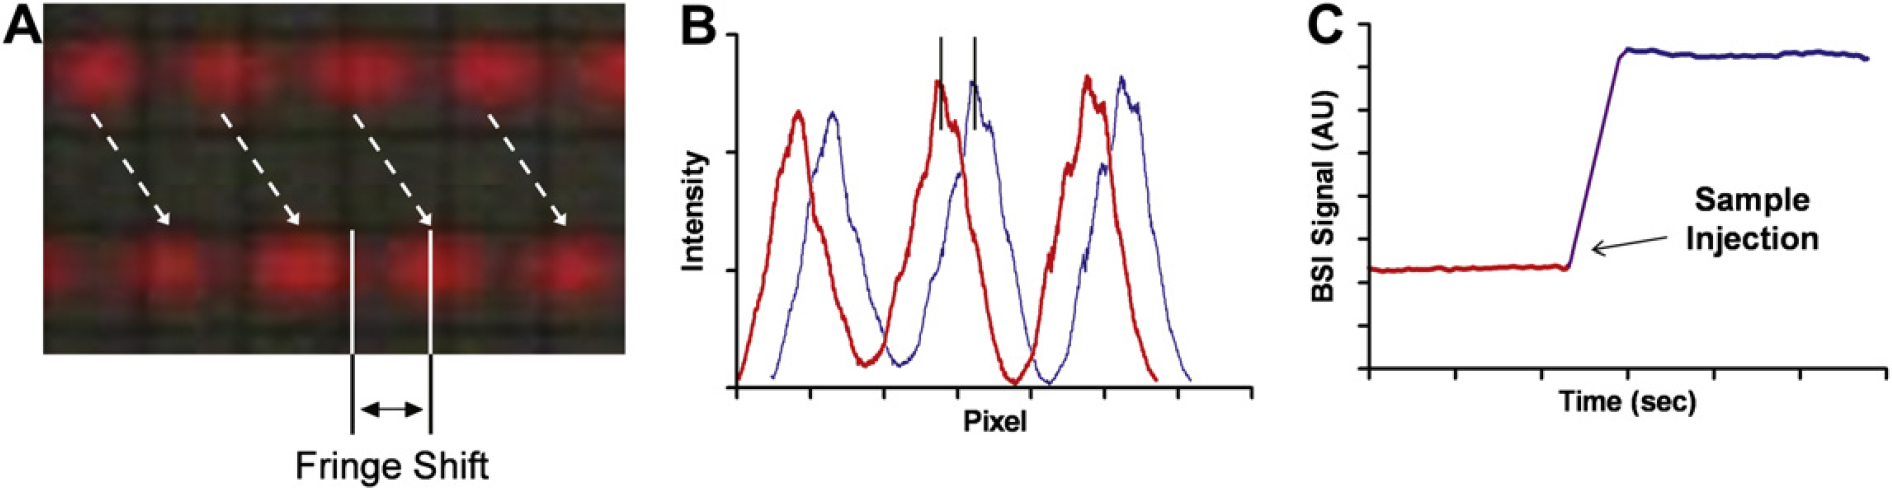
(A) Photographs of the shift of the fringes as a result of a refractive index (RI) change. (B) The intensity versus position trace of the fringes illustrating that the signal is found in the spatial output of the camera. (C) The resulting signal due to a RI-induced fringe shift.
Free-Solution Binding Assays
BSI can be used to characterize binding interactions using either real-time kinetics with on-chip mixing 5 or by off-line mixing with equilibrium end-point determinations of K D. We have recently shown that a wealth of information may be obtained using either method by studying a variety of different binding systems. Here, we present a few representative examples illustrating the broad applicability of BSI for molecular interaction studies.
Kinetic Assays
Building on our observations with calmodulin, immunoglobulin G (IgG) — Protein A and interleukin-2 (IL-2), 5 we set out to further benchmark BSI and attempt to show its application as a screening tool for evaluating the influence of point mutations on binding. To do so, we chose a chaperone—protein binding system important in the process of cataract formation. 7 The small heat-shock protein α-crystallin makes up nearly half of the protein mass of the eye and also acts as a molecular chaperone. 7 Molecular chaperones help to guide misfolded proteins back to their native state or to a pathway that will break them down. 8 This process helps to prevent aggregation of the misfolded proteins and, in the case of the α-crystallin, to help prevent cataracts. As such, it is important to be able to quantify how “destabilized” a protein becomes when it has undergone a transformation, such as a mutation. BSI was used to monitor the binding of α-Crystallin with various destabilized mutants of the T4 lysozyme (T4L). For these experiments, the concentration of the α-Crystallin αB-D3 was held constant, whereas the concentration of the T4L mutant was varied. The concentration range for T4L-D70N was 1–90 μM, and T4L-L99A-A130S concentrations ranged from 1 to 100 μM. For a control, wild-type T4L was used with concentrations ranging from 1 to 100 μM. Figure 3 includes the real-time kinetic data characterizing the interactions of this crystallin protein—chaperone binding system, steady-state results, and T4L protein structure showing mutated sites. The time-dependent traces were then fit with a global analysis approach to characterize the interactions; using this sophisticated data analysis algorithm allowed us to extract a quantitative and detailed biophysical understanding for this system. The results illustrate the selectivity of the α-Crystallin to preferentially bind mutants according to their instability, measured by the energy of unfolding (ΔGunf) using ITC. For example, the D70N version exhibits a ΔGunf of 6.8 kcal/mol with K D1 determined by BSI to be 0.595 μM, whereas the L99A-A130S mutant has a ΔGunf of 3.5 kcal/mol with the K D1 determined to be 0.132 μM. 9 Steady-state data of the binding reiterated these results, showing decreased binding for more stable mutants of the T4L. It is our belief that this work shows that BSI can potentially be used to verify some commonly held beliefs about important pathological mechanisms, for example, we can quickly and quantitatively measure the influence of a single (hidden or even possibly buried as with the D70N and L99A) mutation on molecular interactions at physiologically relevant concentrations, label-free and in the solution phase.
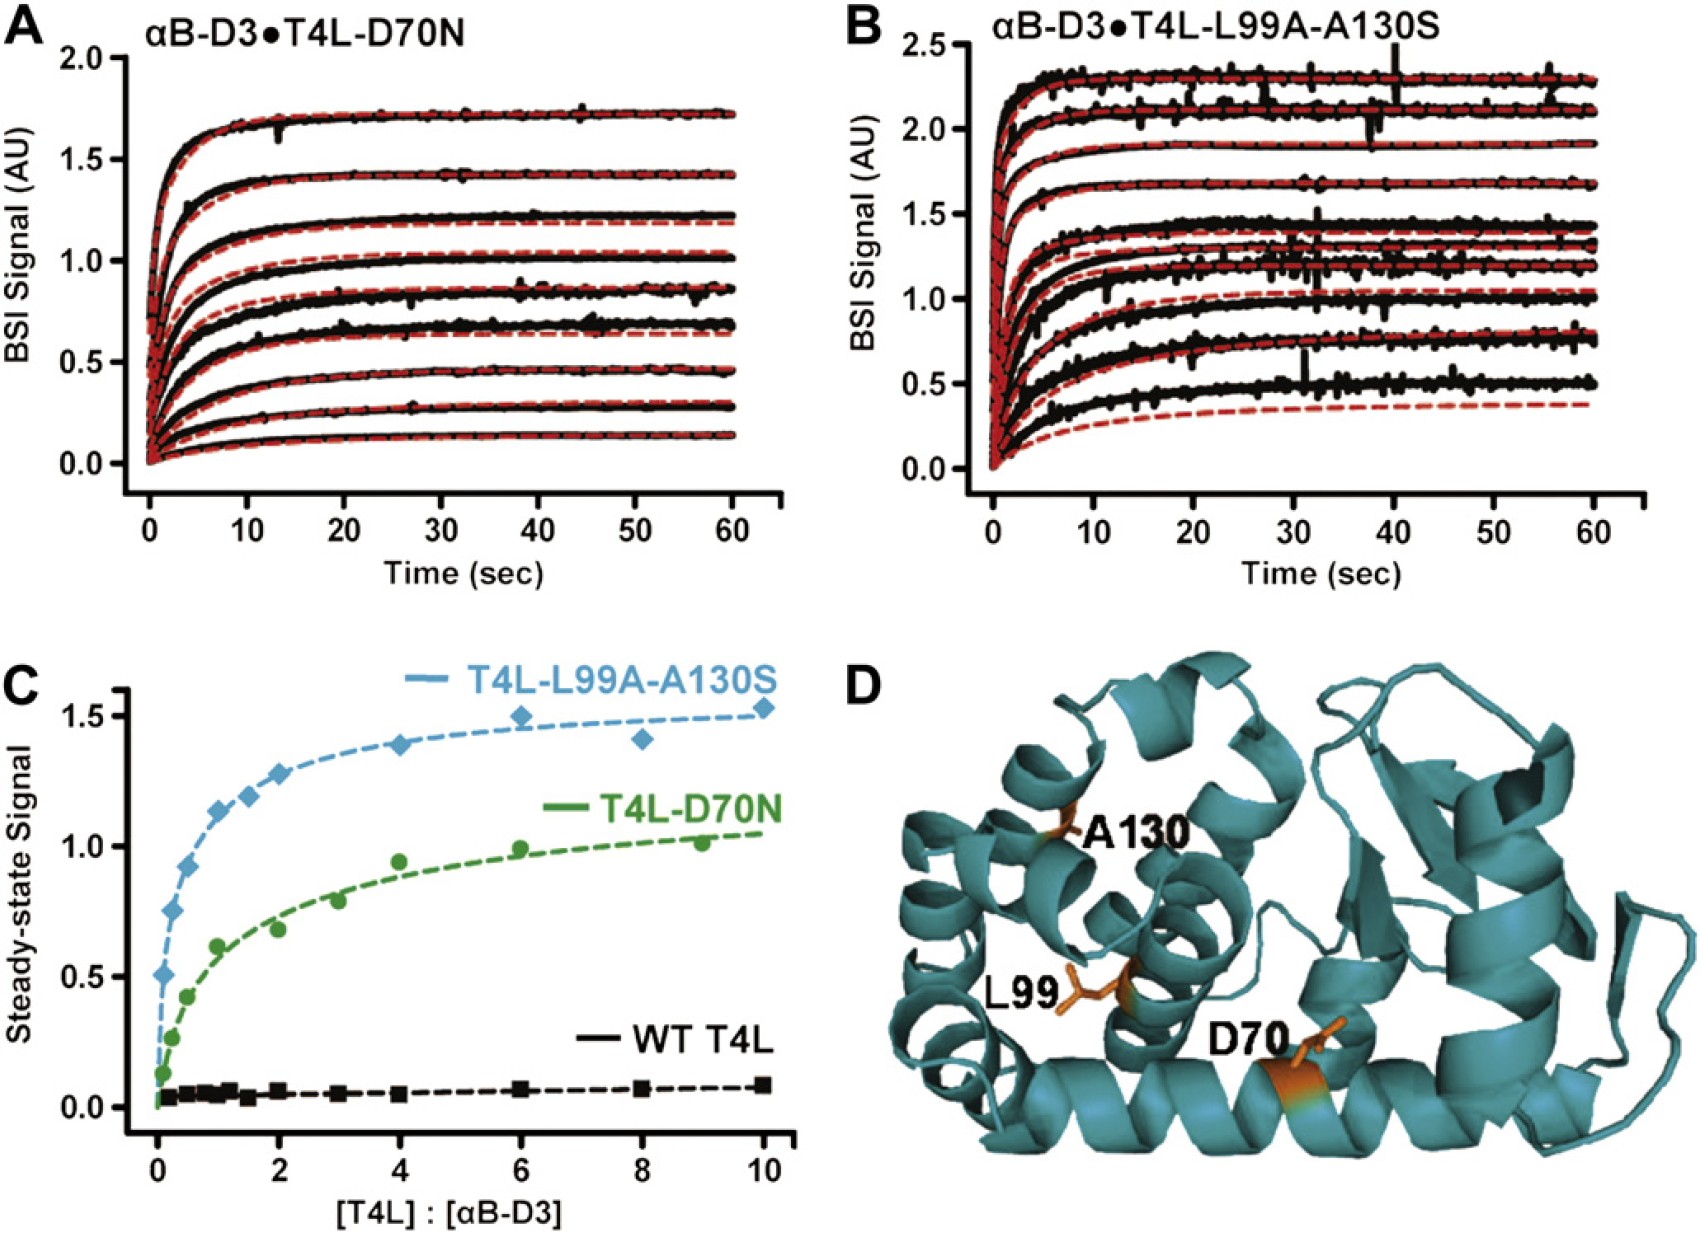
Kinetics of αB-D3 (10 μM) binding to multiple concentrations of (A) T4L-D70N (1, 2.5, 5, 10, 20, 30, 40, 60, and 90 μM) and (B) T4L-L99A-A130S (1, 2.5, 5, 10, 15, 20, 40, 60, 80, and 100 μM) were monitored by backscattering interferometry (BSI) (black) with kinetic traces fit via global analysis (red). Analysis of the steady-state data (C) shows that the magnitude of binding as detected by BSI for RB-D3 T4L-L99A-A130S is significantly greater than that seen with RB-D3 T4L-D70N. As a control, RB-D3 was assayed against multiple concentrations of WT-T4L, exhibiting no binding across the concentration range. (D) The structure of T4L highlighting the sites of destabilization.
End-Point Assays
Here, we demonstrate that BSI end-point experiments, conducted using solutions that have been premixed and equilibrated off line, can facilitate accurate K D determinations. In these experiments, the ligand or control (nonbinding ligand) is combined at successively increasing concentrations with a receptor of fixed concentration. Once combined, the samples are allowed to equilibrate, followed by introduction into the BSI instrument. Although it may not provide the rich biophysical information afforded by the real-time kinetics experiments, the end-point determination has value, in that it facilitates very rapid screening and eliminates nonspecific binding contributions to K D from tethered approaches; this approach can be used to determine simply if a pair interact, and, if properly used, will provide a quantitative measure of actual versus calculated equilibrium K D. Interestingly, with the caveat that the matrix for the interacting species be constrained or compensated for, no prior knowledge is needed to access affinity.
Example I
To evaluate BSI's utility for making end-point binding affinity determinations, we first studied the interaction of carbonic anhydrase (CAII) with an inhibitor. As this determination was performed in DMSO buffer, this assay also allowed the assessment of BSI performance with solvent systems of great interest to the drug discovery and screening community and under conditions considerably more challenging than with simple buffer solutions.
CAII is an enzyme responsible for the conversion of carbon dioxide to bicarbonate, and inhibitors of this enzyme are used to treat glaucoma and epilepsy; some drugs targeting CAII may lead to treatments of cancer and obesity. 10 BSI was used to perform end-point binding assays on CAII and five small inhibitor molecules in solutions containing at least 1% DMSO (unpublished results). The addition of nonaqueous solvents to a buffer system often complicates an experiment and makes accurate measurements more difficult to obtain. The ability of BSI to perform such measurements without any modifications illustrates its adaptability. These studies mirrored those performed by SPR 11 12 of this well-characterized enzyme-inhibitor system. Figure 4 depicts the binding curve for CAII with benzene sulfonamide and is quite representative for all the inhibitor species studied. Error bars in the figure show the reproducibility for performing the entire assay in triplicate, whereas the inset shows the low concentration region. The control, benzene sulfonamide without CAII, produced a linear response over the concentration range (not shown) and was used to normalize the values plotted and used in the determination of K D. From this assay, we determined K D to be 0.57 ± 0.07 μM compared with the value reported in the literature of 0.80 ± 0.28 μM. 11 12
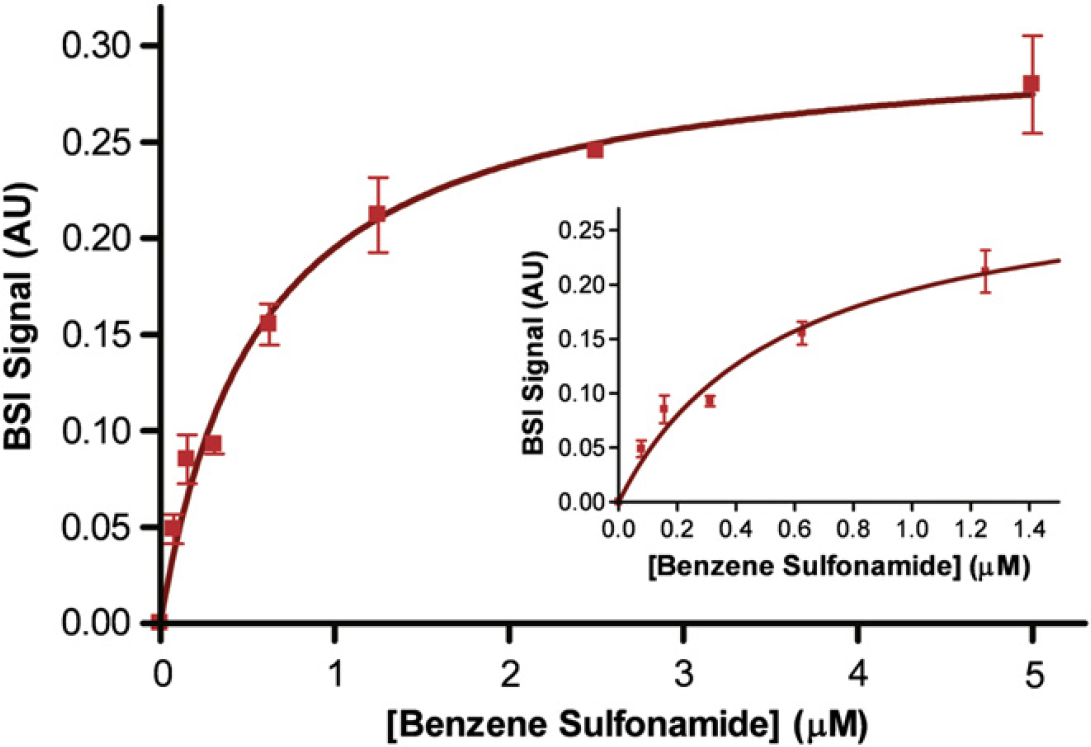
Binding of carbonic anhydrase (10 nM) to varying concentrations of benzene sulfonamide (0, 0.078, 0.156, 0.312, 0.625, 1.25, 2.5, and 5 μM), performed in DMSO buffer. Error bars represent the three trial standard deviations.
Example II
Recognizing that a need exists for improved diagnostic methods, we have forged a collaboration with the sexually transmitted disease division of the Centers for Disease Control and Prevention (CDC). Through this association, we have begun to study the potential for BSI to be used for disease diagnostics. To do so, work has begun on the detection of antibody—antigen interactions, with the ultimate goals being the quantification of infection via antibody titer strength or viral load and the ability to perform therapeutic efficacy monitoring.
P24 is a core protein of human immunodeficiency virus (HIV) that can be found in the blood serum during the acute phase (earliest stage) of HIV infection, and therefore may serve as one of the earliest serological indicators of the disease. 13 Serum levels of this antigen decrease as the disease progresses. 14 Consequently, the quantification of p24 is currently being explored as an early detection and/or prognostic tool for HIV infection. Here, we constructed end-point saturation binding curves using BSI measurements to evaluate the affinity of p24 for the CDC-developed anti—p24-MAb. In this assay, p24 was held constant at 1 nM, and anti-p24 concentrations were varied from 0 to 800 nM. From the saturation isotherm plot (Fig. 5), we calculate for the first time the K D for this antigen—antibody pair to have a value of 77.1 ± 16.7 nM (R 2 = 0.99). Notably, no affinity information was previously known for this binding system because of the fact that the antibody was newly synthesized and was thus far uncharacterized, highlighting the distinct advantage that BSI can be used to make novel K D determinations. Results suggest that the new MAb does indeed bind with the p24 antigen with nanomolar affinity; comparing these results with BSI data collected for other anti-p24 antibodies may serve as a screening approach for predicting the relative performance of these synthetic antibodies in diagnostic assays for HIV.
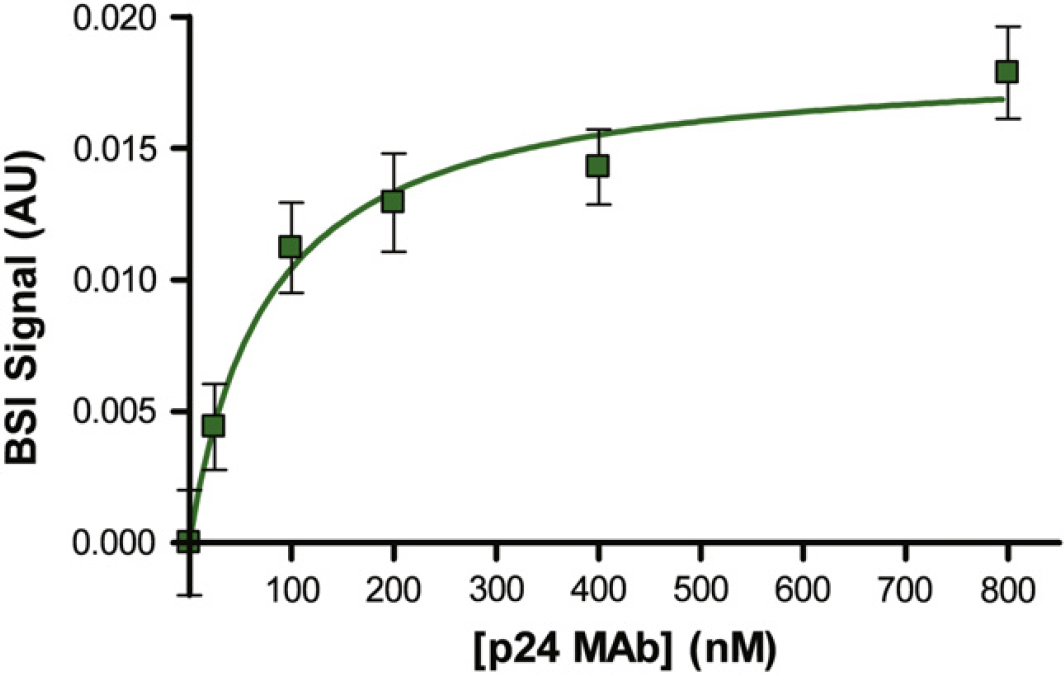
Binding between p24 (I nM) and varying concentrations of p24-MAb (0, 50, 100, 200, 400, and 800 nM). Error bars represent the noise in the measurement.
Tethered or Heterogeneous Binding Assays with bsi
A unique characteristic of BSI is that the platform can be used for either homogeneous (free-solution) or heterogeneous (tethered) assays. The Bornhop research group demonstrated the utility of BSI for tethered assays in two reports, 3 4 showing reversible Protein-A—IgG interaction studies and illustrating the detection of DNA hybridization. The DNA hybridization experiments were performed by first immobilizing a biotinylated 30-mer of mouse actin DNA onto the surface of the channel. The unlabeled complementary strand was then introduced into the channel, and the BSI signal was measured after 20 min to allow for hybridization. The complementary strand was removed with a sodium hydroxide wash, and the experiment was repeated. A DNA strand with a three-base pair mismatch (at positions 5, 15, and 25) showed significantly reduced binding, and noncomplementary DNA strand was used as a control (Fig. 6). This result demonstrates the utility of BSI to act as a screening tool for an array of different sequences without needing to perturb the binding with signaling moieties.
We have since expanded on these preliminary observations substantially, using an extravidin-biotinylated surface chemistry (Fig. 7A) to study small molecule (monosaccharide)—concanavalin A (conA) interactions and to quantify multimeric binding or polyvalency with sugar-coated dendrimer or viral particles. 6 A representative binding curve (Fig. 7B) shows that the capture of mannose by conA can be quantified, and a saturation-binding curve provides a quantitative measure of affinity (K D = 44.5 ± 6.2 μM). In this assay, galactose serves as the nonbinding control. This study is significant for many reasons, particularly because it demonstrates that BSI uniquely allows quantification of a binding event for just one part in 1000 change in mass, allowing the protein to be tethered and the small molecule to be titrated. To our knowledge, this small molecule—protein assay has never been performed in this manner on another platform and represents a challenging assay for widely used label-free techniques, such as SPR.
Preliminary modeling of the BSI signal has shown a correlation between the strength of the BSI signal and changes in the structure of the molecule of interest. Interestingly, unlike other systems we have studied, 5 the conformation of conA (Fig. 6C) does not change appreciably in its overall structure upon binding of its sugar ligand. This phenomenon is depicted in Figure 7C, where the sugar is shown bound within a pocket, but the lectin structure has not dramatically changed (green is the unbound structure and blue is the bound form of conA). Despite the minimal change in structure, we can readily detect the binding interaction and quantify the affinity. Therefore, another factor (i.e., water of hydration) other than conformational change must also contribute to the binding signal. These effects are currently under investigation by more extensive modeling experiments.
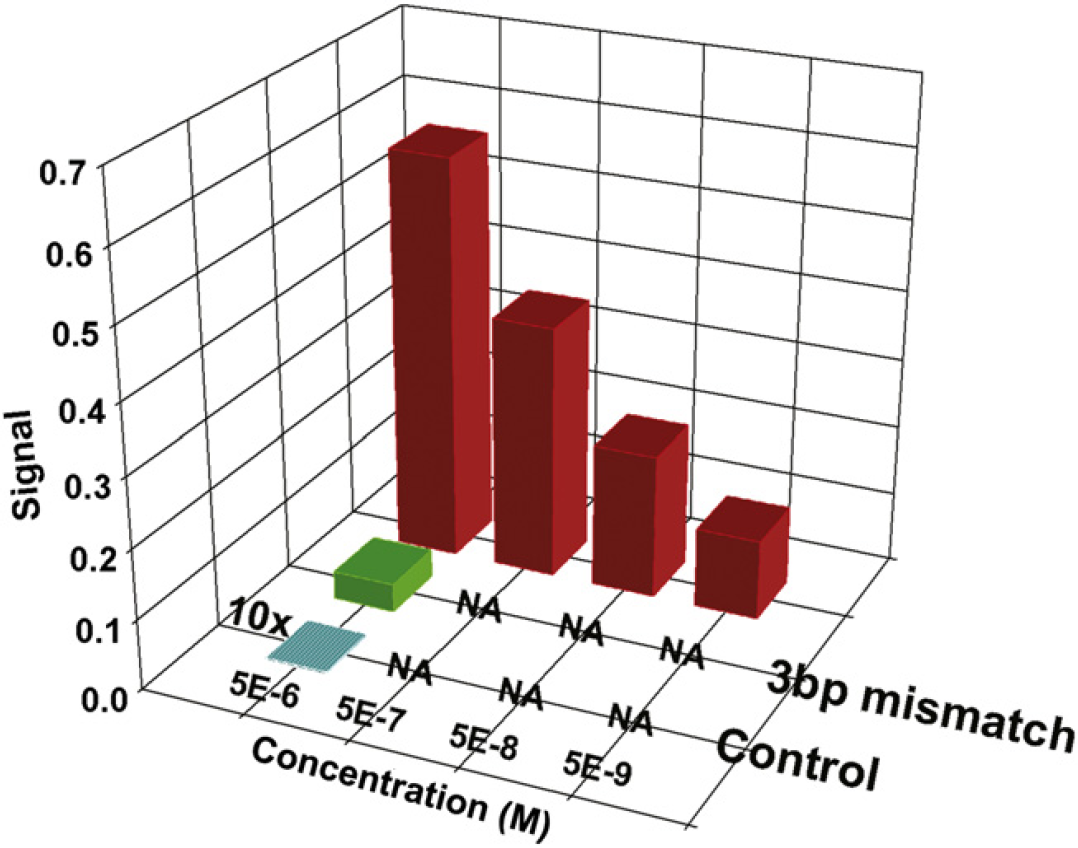
The binding affinity of a complementary DNA strand (5, 50, 500 nM, and 5 μM) to an immobilized target over a multiple complementary strand. The complementary strand is also compared with a 3-bp mismatch and control strands at high concentration (5 μM). All probe strands were allowed for 20 min for hybridization. The control signal is shown at 10 times its actual signal to allow visualization.
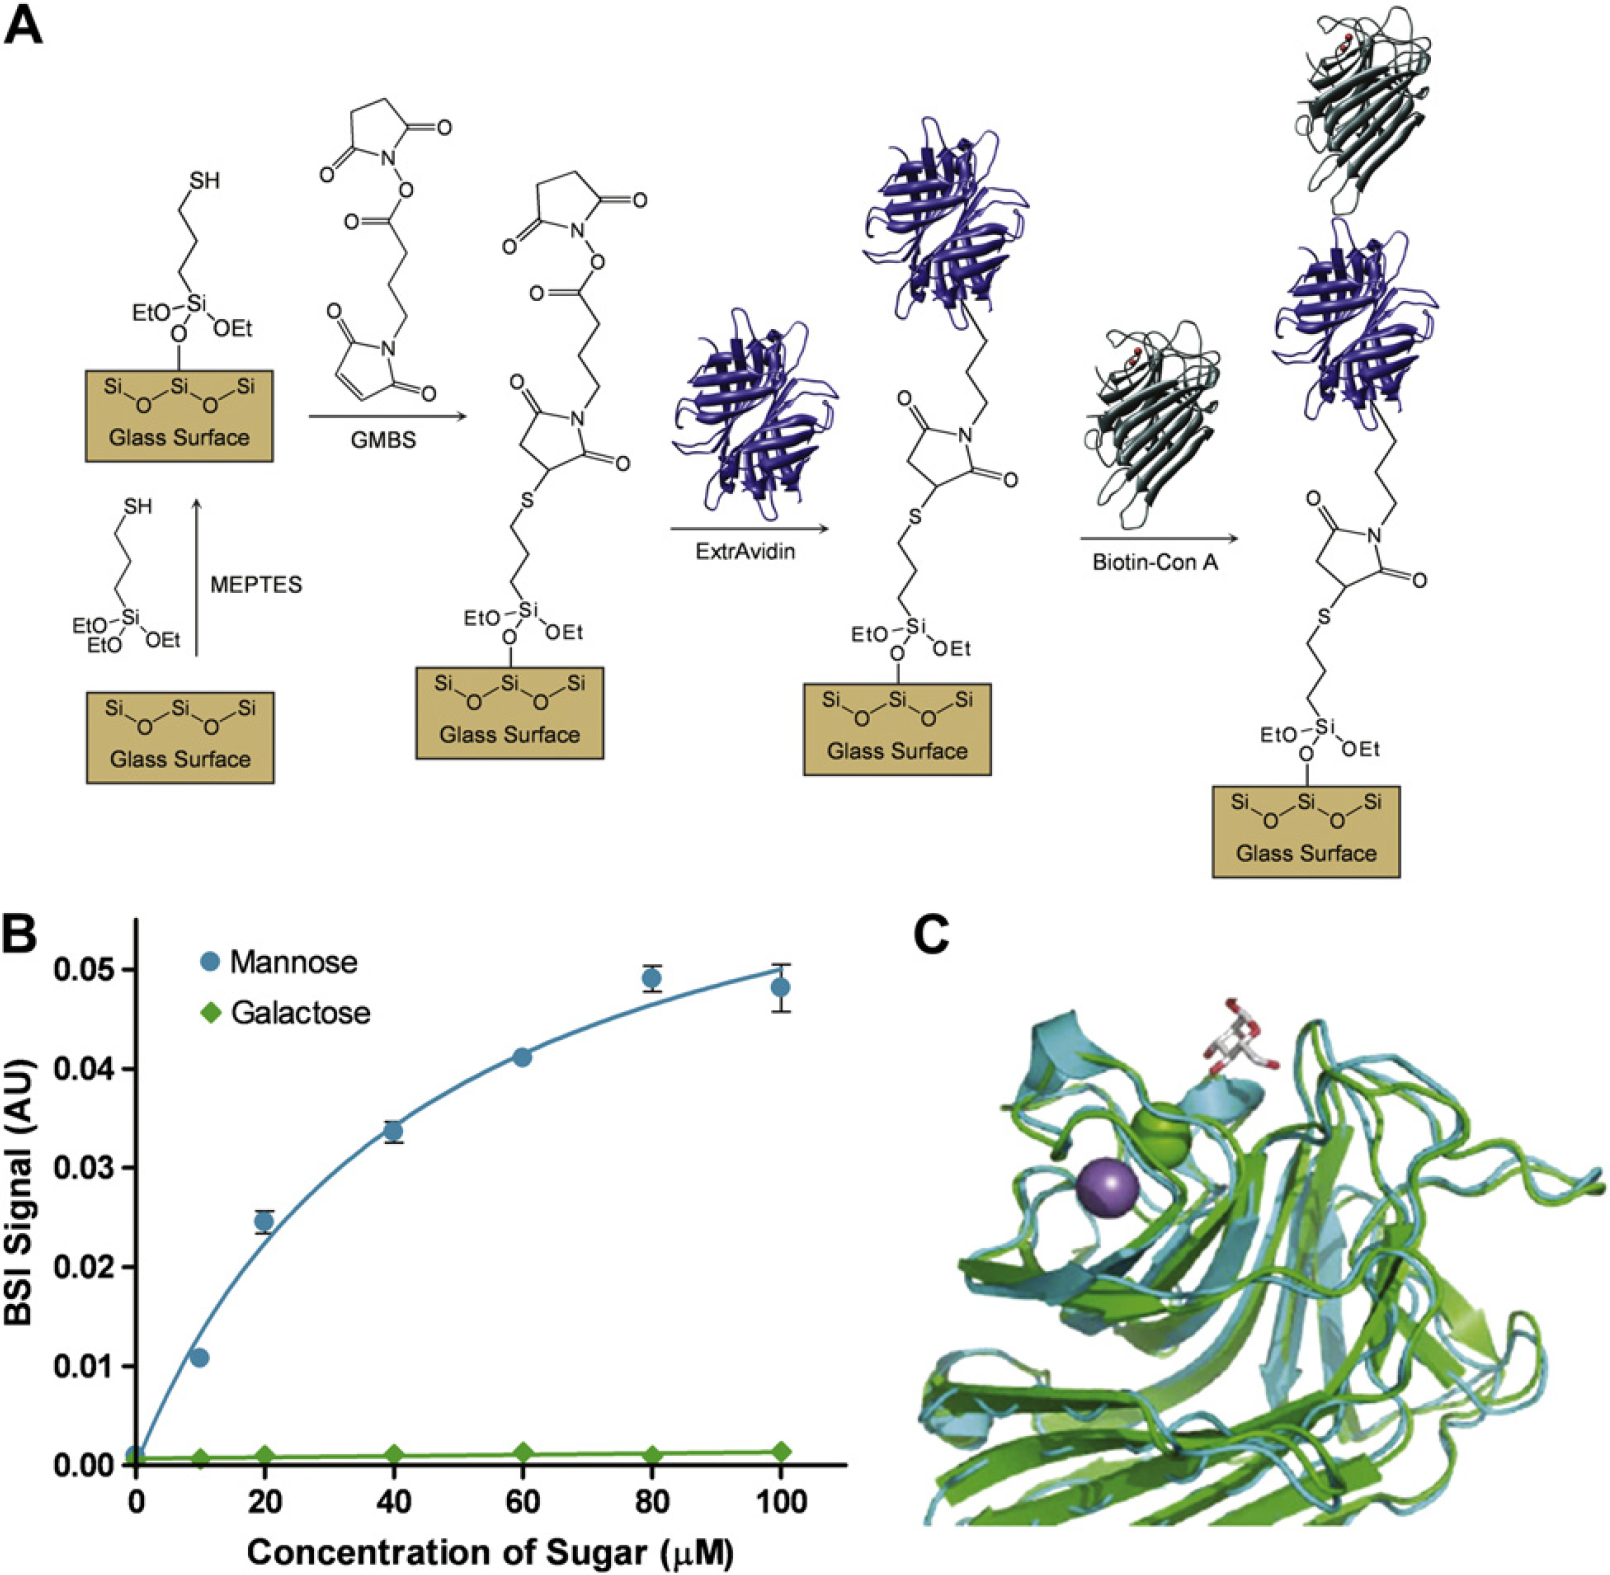
(A) The chemical process used to immobilize concanavalin A (conA) onto the surface of the channel. (B) The binding mannose (0, 10, 20, 40, 60, 80, and 100 μM) to conA with galactose (0, 10, 20, 40, 60, 80, and 100 μM) acts as the nonbinding control. Error bars represent the three trial standard deviation. (C) The unbound (green) and bound (blue) ribbon structures of conA.
Summary
BSI capitalizes on a simple, unique optical train and the intrinsic universal high sensitivity of interferometry to serve as a molecular interaction platform for quantifying binding affinities over a large dynamic range in K D, in free-solution or tethered mode, and requiring just picograms to nanograms of the sample. Of great interest to screening applications is the advantage that little or no a priori information about the system is needed to screen for interaction. Furthermore, it is possible to use BSI with complex matrices, such as cell-free media, 5 DMSO buffer (shown here), serum, and urine (data not shown). Here, we have demonstrated that BSI can be used in these various formats to characterize a number of appreciably different binding interactions and believe BSI to be a promising tool for studying molecular interactions across a significantly wide range of drug discovery, biochemical application, and biomedical application.
Acknowledgments
This research was supported in part by a grant from the National Institutes for Health (R01 EB003537–01A2) and the Vanderbilt University institute of Chemical Biology. Thanks to Tim Granade, and Drs. Ronald Ballard and David Cox of the CDC for supplying the HIV antibody. M. G. Finn and Eiton Kaltgrad of Scripps Institute supplied the lectins used in the tethered interactions assay.