
Abstract
Mercury is a well-recognized health hazard and a deleterious environmental contaminant. Exposure to mercury can cause neurotoxic manifestations, nephrotoxicity, and immune function alterations; however, the mechanisms and related proteins responsible for these effects are still unclear. Our goal is to understand the relationship between the toxicity of mercury and the proteins affected by this toxic heavy metal and to define biomarkers for mercury intoxication. Two different forms of mercury, organic methylmercury or inorganic mercury sulfide, were orally administered to the mice for 4 weeks. To reduce complexity of the serum proteome, we enriched glycoproteins from mice serum with lectin concanavalin A resin, and the tryptic peptides of the purified glycoproteins were subjected to nanoultra performance liquid chromatography-Quadrupole time-of-flight for identification and label-free quantification. In this study, we characterized approximately 209 proteins from mice serum, and, among them, 21 proteins were differentially expressed in organic methylmercury-treated mice serum compared with the control group. Two proteins, serum amyloid P component (SAP) and inter α-trypsin inhibitor heavy chain 4 (ITI-H4), were upregulated in organic methylmercury-treated mice and confirmed with different doses of both types of mercury by Western blot analysis. Results of immunohistochemistry also confirmed the validity of SAP and ITI-H4 as biomarker candidates for organic methylmercury exposure. Findings of this study may assist in understanding the relationship between toxicity of mercury and upregulated proteins in mouse serum. Furthermore, the proteins identified here might be used as biomarker candidates in mercury intoxication.
Introduction
Mercury, a pollutant and hazardous organ-specific environmental contaminant, exists in a wide variety of physical and chemical states, and each has exhibited unique characteristics to target organ specificity. 1 Mercury is highly toxic, and moderate levels of exposure can cause immune system alterations ranging from immunosuppression to immunostimulation, such as increasing the susceptibility to a variety of viruses, autoantibody formation, and autoimmune diseases. 2,3 Clinical studies of industrial workers exposed to mercury levels using World Health Organization guidelines have reported immune system abnormalities, including deficiency of myeloperoxidase in neutrophils, stimulation of immunoglobulins in the absence of liver injury, and neurological dysfunction. 4,5
Mercury exists in different forms, for example, elemental, inorganic, and organic mercury. Although they have some properties in common, they differ in their metabolism and toxicity. The distribution of mercury within the body and in specific organs varies with the chemical form, dose, and time after exposure. 6 The methylated organic form of mercury is considerably more toxic than inorganic forms, of which the mercuric salt is most common. 7 Many studies investigating methylmercury metabolism and toxicity have used methylmercury salts in experimental diets as a model for methylmercury. Methylmercury chloride (CH3HgCl) is one of the most commonly used methylmercury salts in animal experiments. 8,9 Chronic exposure to nontoxic low levels of CH3HgCl can result in modulation of T- and B-cell functions (cytokine production, cell growth, and proliferation) and different cellular processes leading to apoptotic cell death. 10 In human T lymphocytes, CH3HgCl is approximately 5 to 10 times more cytotoxic than inorganic HgCl2. 10,11 Mercury sulfide (HgS), naturally occurring inorganic mercury, is a primary component of cinnabar. Cinnabar has been used for more than 2000 years in combination with traditional Chinese medicine as a sedative and is still widely used in Asian countries. 12 Although some reports showed the insolubility of HgS, it can be absorbed 13 and accumulated in the kidney and liver following oral administration. Long-term oral administration of HgS causes increase in renal mercury burden and disruption of host antioxidant homeostasis. 12,14 Therefore, due to the availability of effective therapeutic interventions containing minute amounts of mercury, the availability of biomarkers for evaluation of mercury exposure is of particular importance. 15
Toxicoproteomics have recently focused on development and use of analytical methods for determination of different expression of proteins in human organs and body fluids according to exposure to toxicants. Using the 2-DE system with matrix-assisted laser desorption/ionization-time-of-flight mass spectrometer (MS), several groups have applied a proteomic approach to identify proteins in order to understand the toxicity of methylmercury in cultured neurons, 16 juvenile beluga brain, 17 and mice cerebellar granule cells. 18 However, no study for identification of mice serum proteins that can be used as biomarkers differentially expressed by methylmercury treatment has been reported.
Glycosylation is one of the most common posttranslational modifications and is related to various biological processes, 19 including the immune response 20 and cellular regulation. 21 For example, the majority of the key molecules for the innate and adaptive immune response, which can be induced by the treatment of toxic agent, are glycoproteins. 20 Glycosylation is also a good indicator of environmental effects on cellular processes 22 and is involved in signaling pathways in various cells. 23 In addition, due to the low abundance of biomarker candidate proteins among high-abundance proteins, identification of biomarkers from serum is difficult, even though serum is widely used in diagnostic medicine samples. Glycoproteins make up about 50% of the blood proteins, 24 and interestingly albumin is not a glycoprotein, and elimination of this highest abundance protein in serum during the glycoprotein enrichment step is an advantage. Therefore, a glycoprotein enrichment method was applied in this study. Finally, differentially expressed serum glycoproteins were found in mercury-exposed mice according to our toxicoproteomics strategy. This result provides important information regarding biological function after mercury exposure in animals.
Materials and Methods
Sample Collection
The original stock of male ICR mice (average body weight 20 g), supplied with food and water, was exposed to a 12-hour light–dark cycle at 22°C ± 3°C and 50% ± 10% humidity. Mercury was administered orally by gavage with 3 doses of CH3HgCl, and HgS once every 3 days during a period of 4 weeks (CH3HgCl: 0.02, 0.2, and 2 mg/kg/d, n = 5 per each dose and HgS: 0.02, 0.2, and 2 g/kg/d, n = 5 per each dose). Saline was administered to mice in the control group. Blood was collected by heart puncture into BD Vacutainer serum separation tubes (BD, Fanklin Lakes, NJ), allowed to clot on ice, and centrifuged at 4°C; mice serum was then aliquoted and stored at −80°C until use. Care and treatment of mice were in accordance with the guidelines established by the Public Health Service Policy on the Humane Care and Use of Laboratory Animals and were approved by the Institutional Animal Care and Use Committee. Levels of serum alanine aminotransferase (ALT) and aspartate aminotransferase (AST) were determined using a Bayer ADVIA 1650 chemistry analyzer system (Bayer HealthCare Ltd., Tarrytown, NY).
Enrichment of Glycoproteome From Mice Serum
Agarose-bound concanavalin A (Con A; Vector, Burlingame, California) was used for the lectin affinity column. Pooled control and mercury-treated mice serum samples of 20 µL were diluted by addition of 80 μL of binding buffer and mixed with Con A resin previously equilibrated in 300 μL of equilibrium (binding) buffer (0.15 mol/L NaCl, 20 mmol/L Tris-HCl pH 7.4, 1 mmol/L MnCl2, 1 mmol/L CaCl2, 1 mmol/L MgCl2, 0.02% NaN3).
25
After 1-hour binding at room temperature, this binding complex was transferred to an empty column (Bio-Rad, Hercules, California) and washed with equilibrium buffer. Bound serum proteins were eluted with 200 μL of elution buffer (equilibrium buffer with 0.5 mol/L methyl-α-
N-Deglycosylation of Enriched Glycoprotein and Trypsin Digestion
After completely drying in a speed vac, the proteins eluted from Con A affinity chromatography were denatured in 50 mol/L NH4HCO3 for 30 minutes at 90°C and reduced with 10 mmol/L dithiothreitol for 30 minutes at 56°C. The sample was deglycosylated by incubation with 1 μL of enzyme peptide-N4-(acetyl-β-glucosaminyl)-asparagine amidase F (PNGase F; New ENGLAND BioLabs, United Kingdom) for 20 hours at 37°C. Deglycosylated proteins were then alkylated with 14 mmol/L iodoacetamide in the dark for 30 minutes at room temperature, and the solution was digested with sequencing grade-modified trypsin (Promega, Madison, Wisconsin) at 37°C overnight.
Liquid Chromatography Coupled to Tandem MS Analysis and Quantification
We primarily used a well-established method and protocol in this laboratory, as reported previously. 26 –29 Briefly, nanoscale liquid chromatography (LC) separation of tryptic peptides was performed using a NanoACQUITY LC (Waters, Milford, Massachusetts), equipped with a C18 precolumn (5 μm, 5 mm × 300 μm) and BEH C18 analytical column (1.7 μm, 15 cm × 75 μm). The mobile phase A was composed of water containing 0.1% formic acid, and the mobile phase B was 0.1% formic acid in acetonitrile. Tryptic peptides, including 100 fmol enolase, were separated with a linear gradient of 3% to 40% mobile phase B over a period of 180 minutes. Accurate mass data were obtained in LC-MS, alternate scanning (low and elevated energy) mode of acquisition. All samples were analyzed in triplicate. Ion detection, clustering, and normalization of LCMS raw data were processed and searched using ProteinLynx Global Server version 2.3 (IDENTITY, Waters, UK). 27 All precursor and independently acquired data, alternate scanning, and multiplexed fragment ion spectra were searched against the IPI mouse database (version 3.46, 55,270 entries, http://www.ebi.ac.uk/IPI/IPIhelp.html) and Saccharomyces cerevisiae enolase, using the ProteinLynx GlobalSERVER. The search parameters included 2 missed cleavages, fixed modification for carbamidomethylation of cysteine, and variable modifications for methionine oxidation and deamidation of asparagines. The false-positive rate of the ion accounting identification algorithm was typically 4% with a randomized database, 5 times the size of the original utilized database. For absolute quantification, the 3 most abundant peptides from each protein were selected for normalization. 28 The average intensity value of the top 3 ionizing peptides to Saccharomyces cerevisiae enolase was used to convert the average intensity of the top 3 ionizing peptides for proteins to the corresponding absolute quantity of protein. In cases involving 2 peptide-based protein identifications, the 2 best ionizing peptides were used for normalization. Quantitative data in fmol were presented in Microsoft Excel. Differentially expressed proteins were based on identification of the protein in at least 2 of the 3 injections.
Western Blot Analysis
Whole serum of 1 µL was separated by 8% polyacrylamide gel (Sigma, Canton, Massachusetts) for serum amyloid P component (SAP) and inter α-trypsin inhibitor heavy chain 4 (ITI-H4). Following electrophoresis, proteins were transferred to a nitrocellulose membrane (Whatman, Germany). The membrane was incubated with monoclonal rabbit anti-SAP (Abcam, Cambridge, UK, 1:2000 dilution) or goat anti-ITI-H4 (Santa Cruz Biotech, Santa Cruz, California, 1:200 dilution) overnight at 4°C, followed by incubation with anti-rabbit IgG antibody (Santa Cruz, 1:3000 dilution) or anti-goat IgG antibody (Santa Cruz, 1:3000 dilution) for 1 hour at room temperature. An enhanced chemiluminescence Western blot analysis system (GE healthcare, Piscataway, NJ) was used for densitometric quantitation of immunoreactive proteins.
Immunohistochemistry
For light microscopy, liver tissue was fixed in 4% formalin and routinely processed for histologic examination. The tissue block was cut to 4-μm thick sections using a cryostat (Leica CM3050S, Germany), and the sections were applied to glass slides. Sections of liver tissue were stained with hematoxylin and eosin and observed under a light microscope.
Statistical Analysis
SPSS 17.0 for Windows (SPSS, Chicago, Illinois) was used for statistical analysis. Student t test was used for discovery of differentially expressed proteins. P < 0.05 was considered significant.
Results and Discussion
Mercury Treatment
The procedure used for identification of differentially expressed proteins by treatment with 2 types of mercury, CH3HgCl and HgS, is illustrated in Figure 1. Five mice per each type of mercury received oral administration of 3 different doses (CH3HgCl: 0.02, 0.2, and 2 mg/kg/d and HgS: 0.02, 0.2, and 2 g/kg/d) for a period of 4 weeks. Total body weight and food consumption were not altered after treatment with 2 types of mercury during a period of 4 weeks (supplement Table 1). Decrease in food consumption and increase in relative liver weight (organ/body weight ratios) were detected only in the group treated with the highest dose of CH3HgCl (2 mg/kg/d). No change in serum levels of total protein, albumin, and bilirubin was observed in any of the groups. Oral treatment with mercury resulted in change of serum levels of ALT and AST, markers of liver damage, which suggested hepatotoxicity by mercury in animals. Figure 2 shows the histology of liver exposed to 2 types of mercury during a period of 4 weeks (A: control, B: CH3HgCl 2 mg/kg/d, and C: HgS 2 g/kg/d). Dilatation of ventral vein and multiple nuclei cells was observed without inflammatory infiltration in the groups treated with both types of mercury (Figure 2B and C).
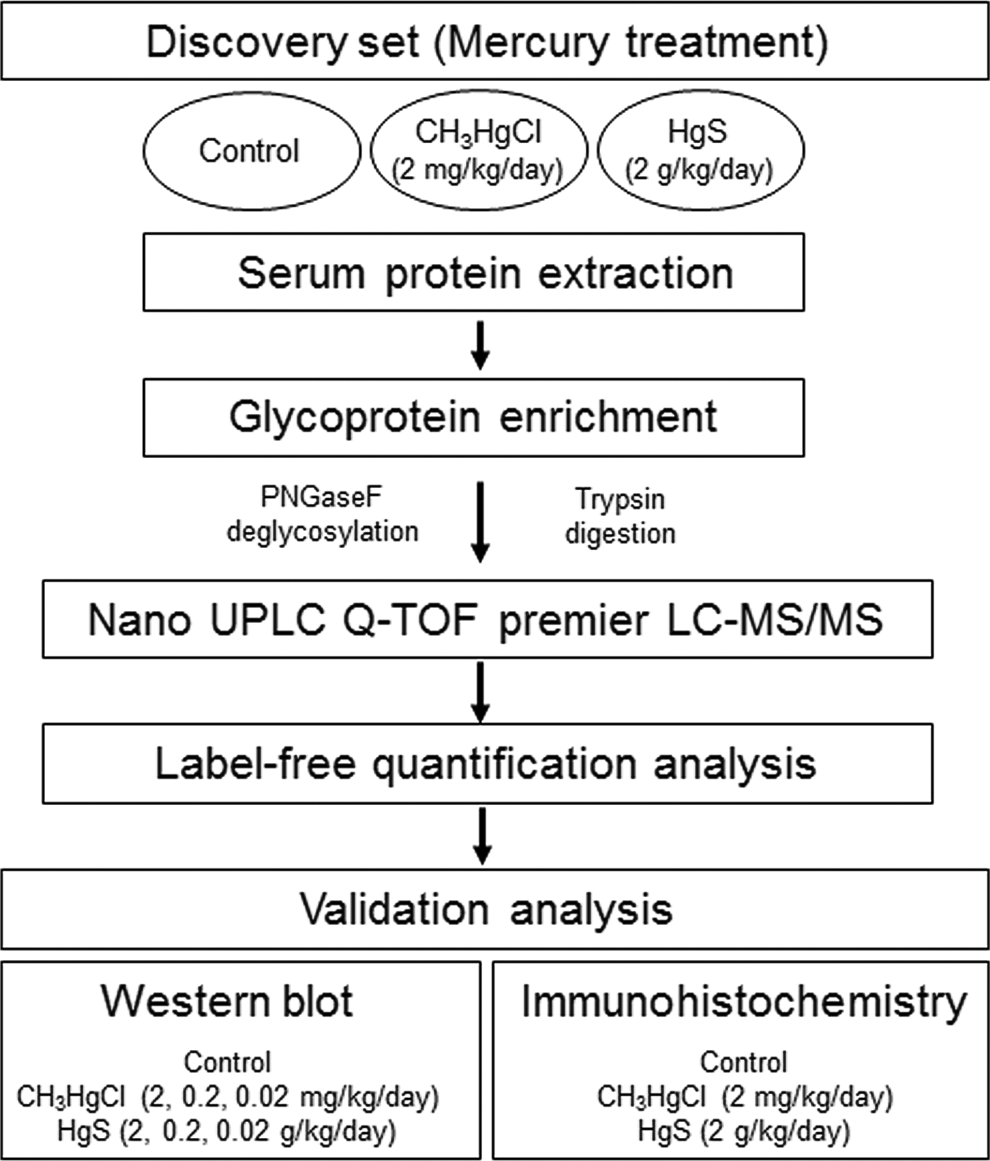
Schematic presentation for analysis of differentially expressed serum glycoprotein in mercury-treated mice serum.
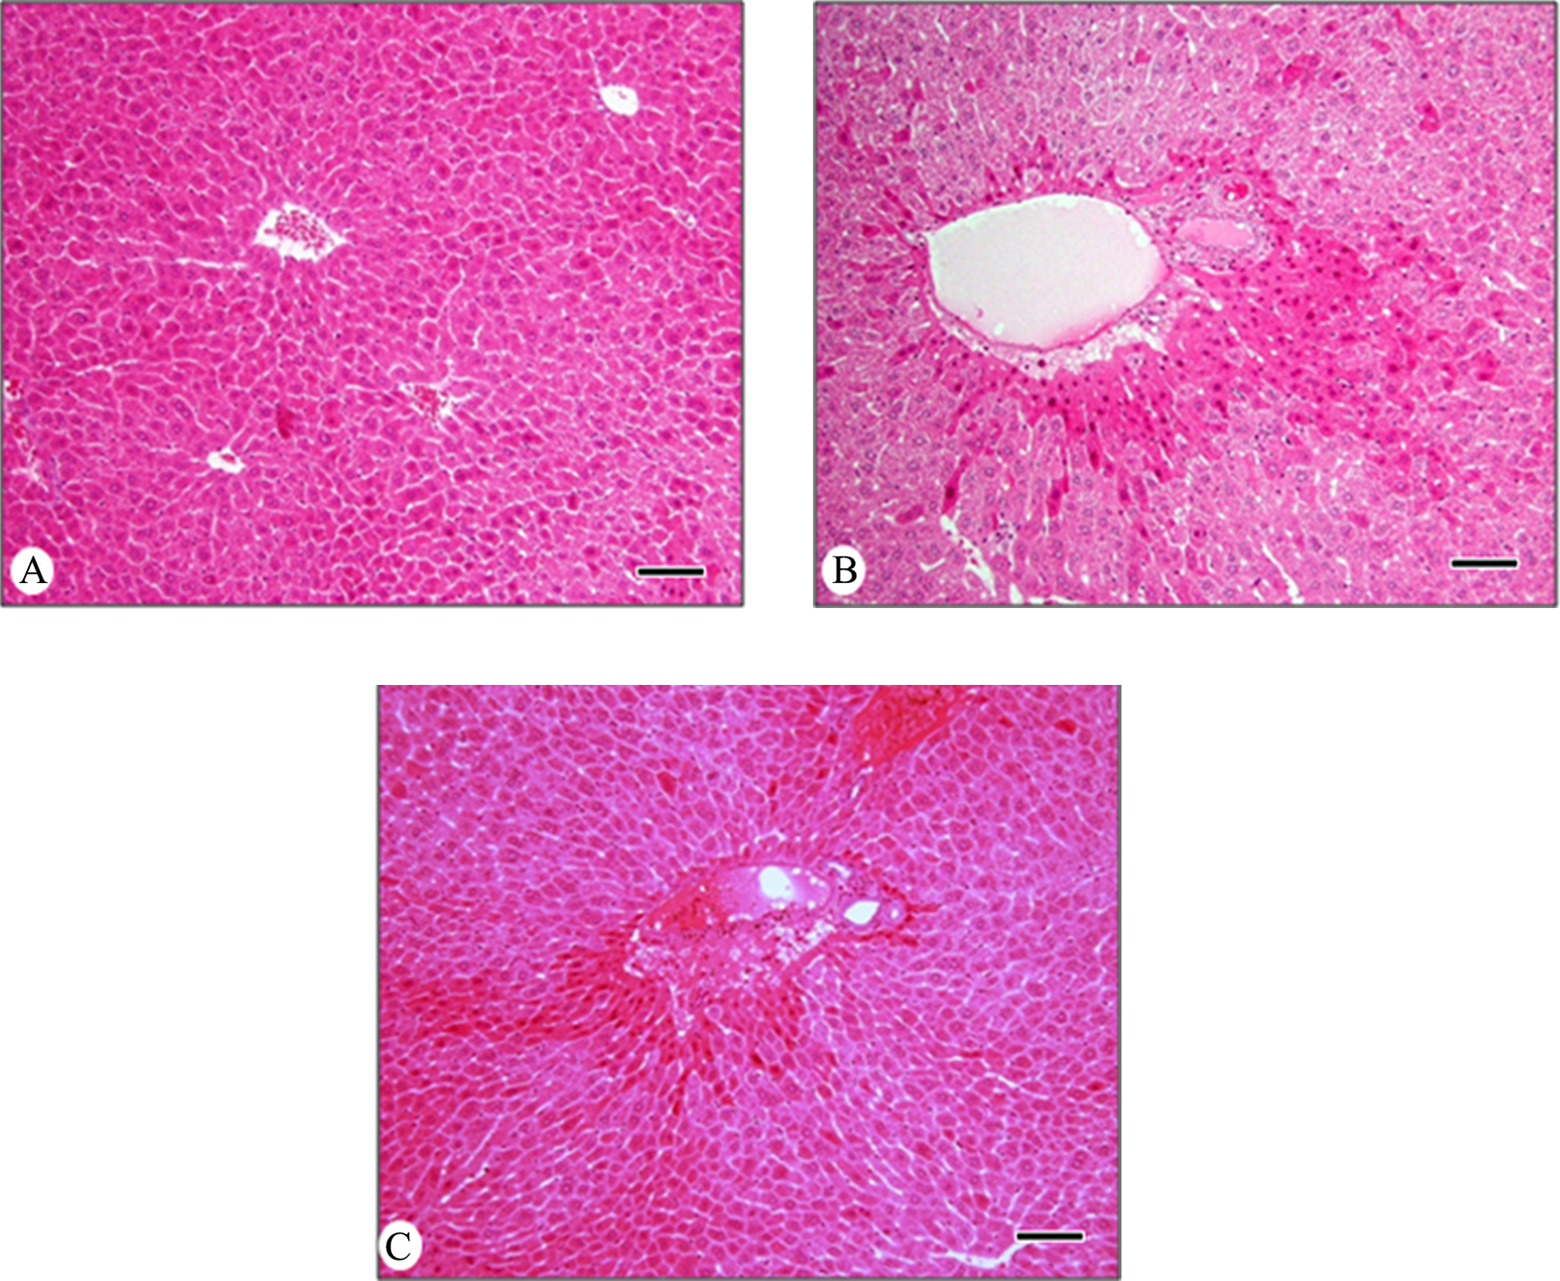
Photomicrographs of mice liver exposed to 2 types of mercury orally for 4 weeks. Liver sections were stained with hematoxylin and eosin. A, Control, (B) 2 mg/kg/d of CH3HgCl, and (C) 2 g/kg/d of HgS. Scale bar: 50 μm.
Differentially Expressed Glycoproteins in Control and Mercury-treated Mice Serum.
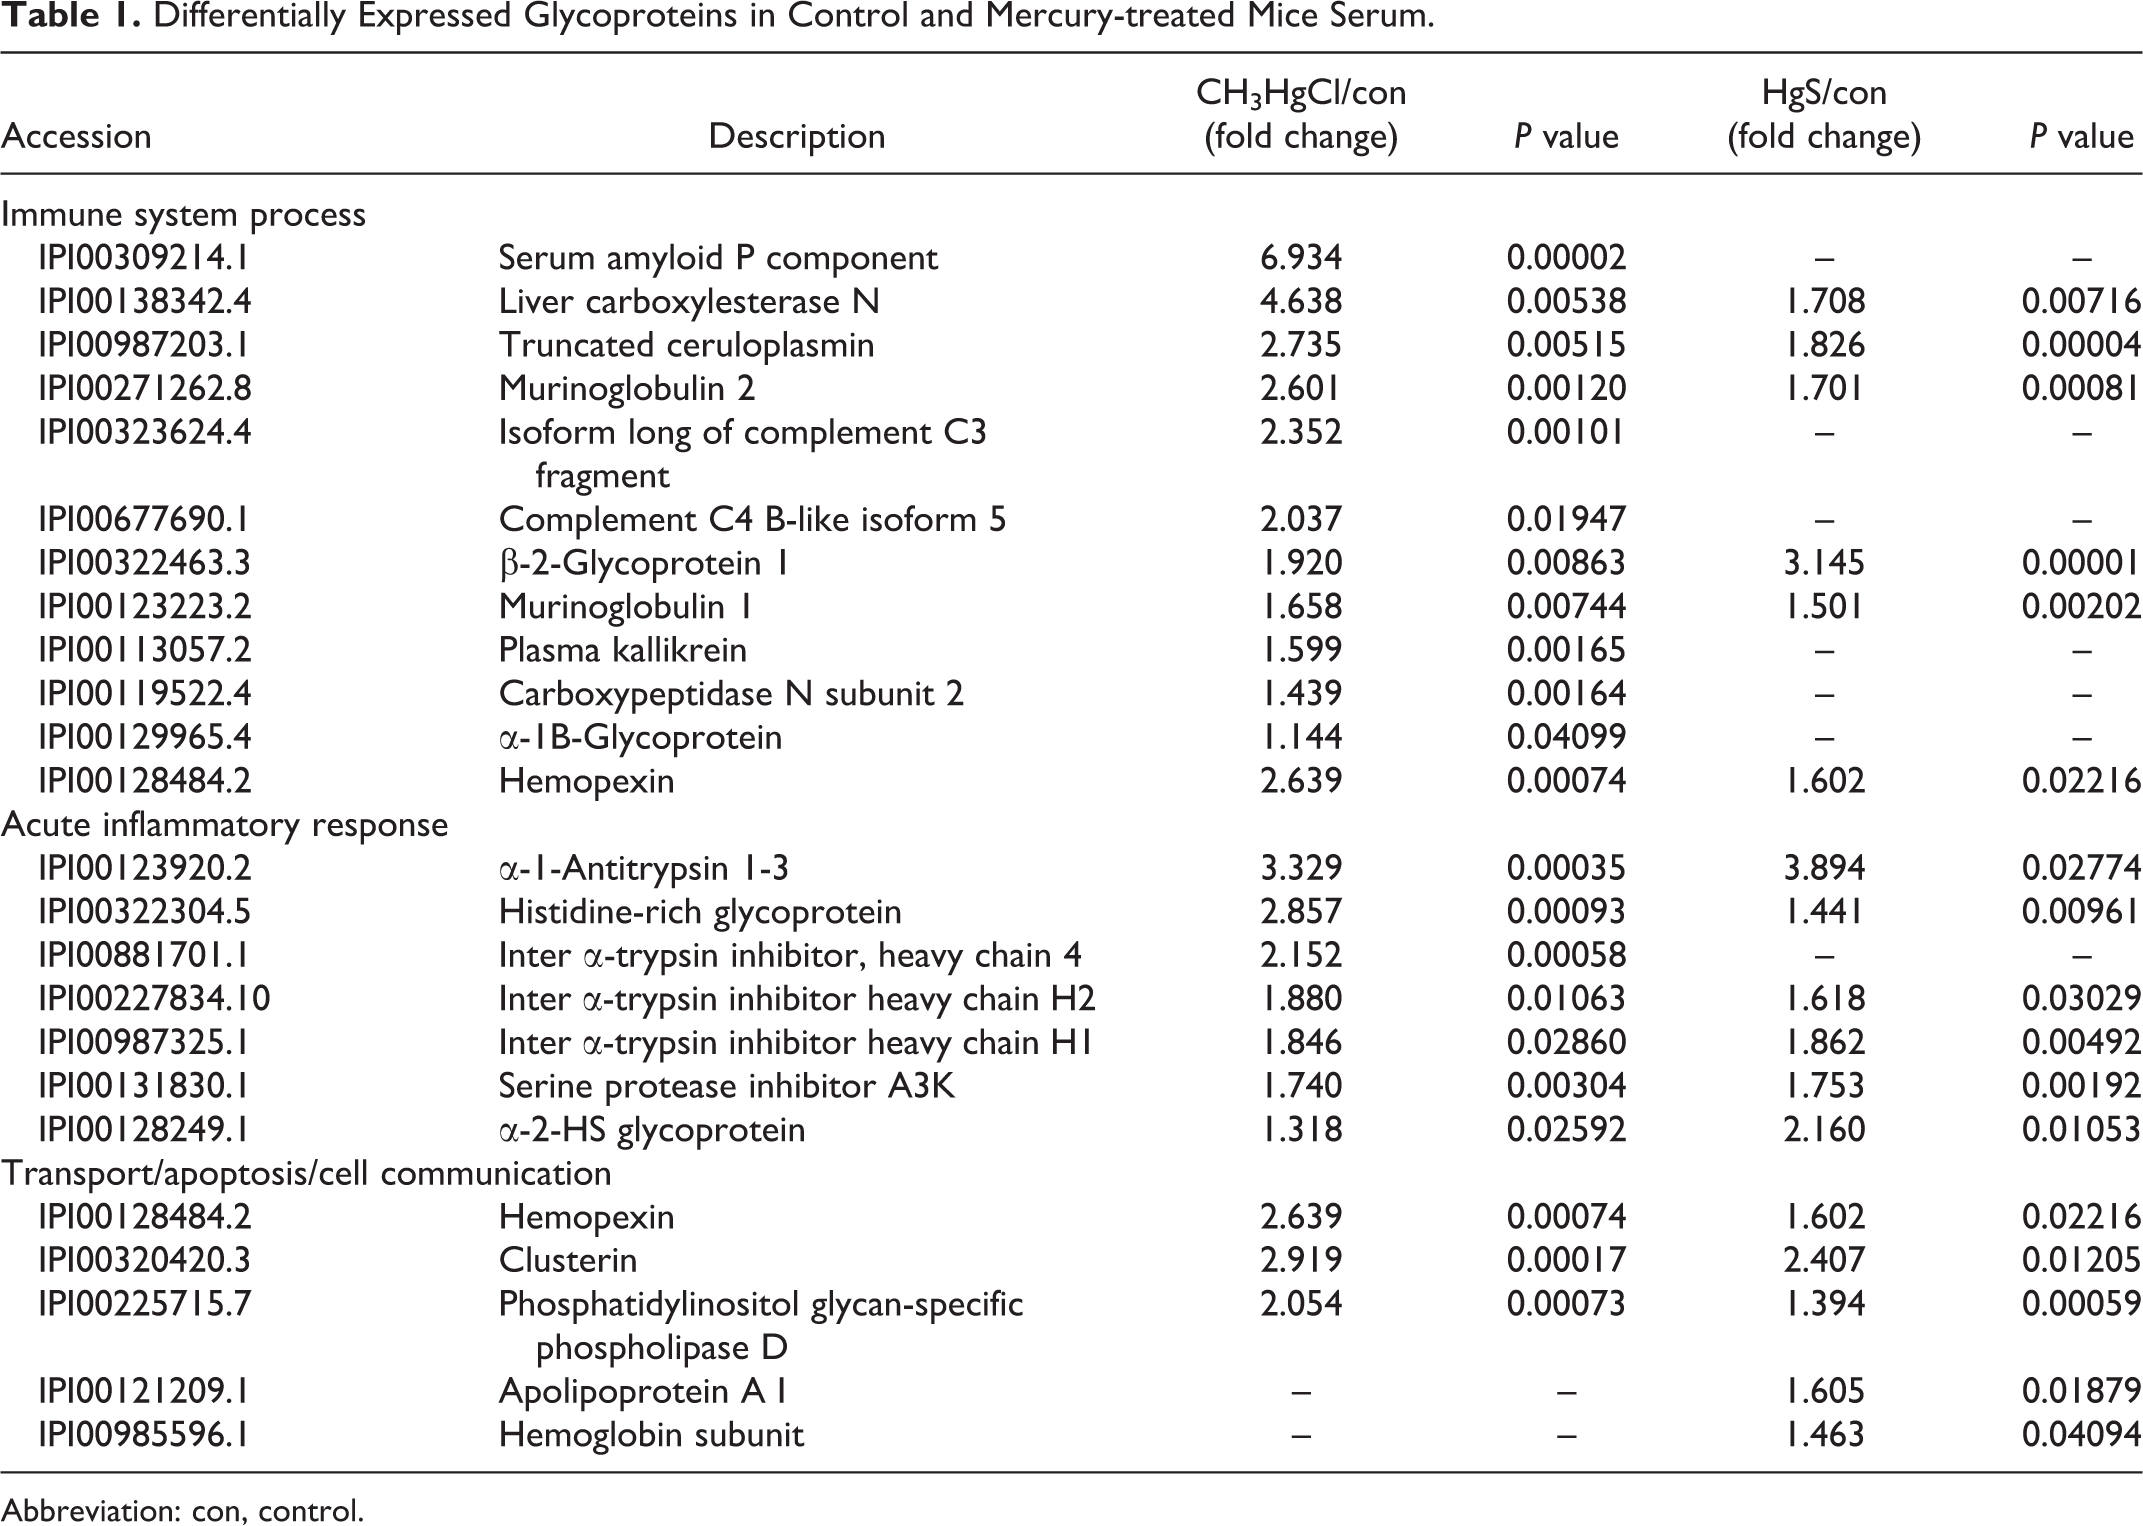
Abbreviation: con, control.
First, for identification of differentially expressed serum proteins using a proteomic approach, we used animals treated with a high dose (CH3HgCl: 2 mg/kg/d and HgS: 2 g/kg/d), and then candidate proteins, as potential serum biomarkers, identified by proteomics were validated using 3 animals treated with 3 different doses of both types of mercury.
Enrichment of N-Glycoproteins and LC-MS/MS Analysis
Serum samples were obtained from control and mice treated with both types of mercury, and glycoproteins were enriched using a Con A lectin affinity column. As a result, approximately 15% to 18% of starting serum protein in weight was eluted by this step. To efficiently identify and facilitate ionization of peptides by LC-MS/MS, enriched N-glycoproteins were deglycosylated by treatment with PNGase F and digested in solution using trypsin.
Tryptic peptides (0.6 μg) were analyzed in triplicate along with enolase (50 fmol) by LC-MS/MS. The MS/MS data were searched against the IPI mouse protein database (version 3.47), and identified proteins are shown in supplementary Table 2. The identification probability of proteins was more than 95%, and the 209 proteins identified were quantified. Between control and mercury-treated samples, 54 proteins were identified in at least 2 of the 3 MS/MS data per condition sample for quantification analysis (supplement Table 2). The ratio for each protein was calculated by absolute quantification derived from the sum of normalized ion intensity and expressed as relative values (supplement Table 2).
Up-Regulated Proteins From Mercury-Treated Mice Serum
We showed the 24 proteins that were upregulated in the group treated with mercury compared with control (Table 1). Among these 24 proteins, 22 proteins were upregulated in the CH3HgCl-treated group, and 17 proteins were also upregulated in the HgS-treated group compared with control. We used bioinformatics tools, including Database for Annotation, Visualization and Integrated Discovery and Protein ANalysis THrough Evolutionary Relationships for identification of mercury toxicity-related biological processes. Bioinformatics analyses based on proteomic data showed various biological processes (Table 1), including immune system process, acute inflammatory response, transport, apoptosis, and cell communication.
Mercury is well known to cause oxidative stress, inflammatory diseases, and alteration in immune function; therefore, we focused on proteins associated with immune system processes and acute inflammatory response. 30 –32 Among them, SAP showed the highest fold change (6.9-fold) in CH3HgCl-treated mice serum compared with control. The SAP, a member of the pentraxin family, is expressed in the liver. 33 It exists in amyloid deposits, which show specific calcium-dependent binding to DNA under physiological conditions, and human SAP combines with chromatin during necrosis and in apoptotic cells. This complex of human SAP stabilizes chromatin and protects it from enzymatic degradation. 34 It has been recently reported that SAP gene deficiency develops antinuclear autoimmunity and proliferates immune complex glomerulonephritis in mice, and SAP depletion is related to Alzheimer disease. 35 These observations suggest that human SAP may show a quantitative alteration during mercury exposure in vivo.
We also observed that ITI-H4 is upregulated in mercury-treated mice serum. The ITI-H4, a 120-kDa plasma glycoprotein, was described as an acute-phase protein 36 and was also detected by proteomic analysis in serum from children, with higher levels of blood Hg, who consumed fish compared to children who did not consume fish. 37 The ITI family is a group of structurally related plasma protease inhibitors that originate from 5 different genes: ITIH1, ITIH2, ITIH3, ITIH4, and α1-microglobulin/bikunin, expressed in liver. 38 The ITI family is involved in regulation of inflammatory conditions and acute phase response. However, the specific function of ITIH4 is still unknown.
Recently, a study on proteomic analysis of human serum with low level of environmental Hg exposure has been reported. 37 Therefore, we compared proteins differentially identified in this study with those from human study. In all, 23 proteins and 14 proteins are differentially expressed from this animal study and human study, respectively. Among them, 4 proteins, including ITI-H4, ITI-H1, complement C3, and plasma protease C1 inhibitor, are upregulated in both the studies. This result suggests that increased Hg levels in blood are associated with inflammatory processes caused by acute inflammatory response proteins in human and animal studies.
Validation of Biomarker Candidates
In addition, to investigate the effect of different doses of mercury on the 2 proteins in serum, serum of 3 mice treated with 3 different doses of 2 forms of mercury, 0.02, 0.2, and 2 mg/kg/d of CH3HgCl; and 0.02, 0.2, and 2 g/kg/d of HgS, were used. Serum proteins from each animal were separated on sodium dodecyl sulfate polyacrylamide gel electrophoresis and analyzed by Western blot (Figure 3).
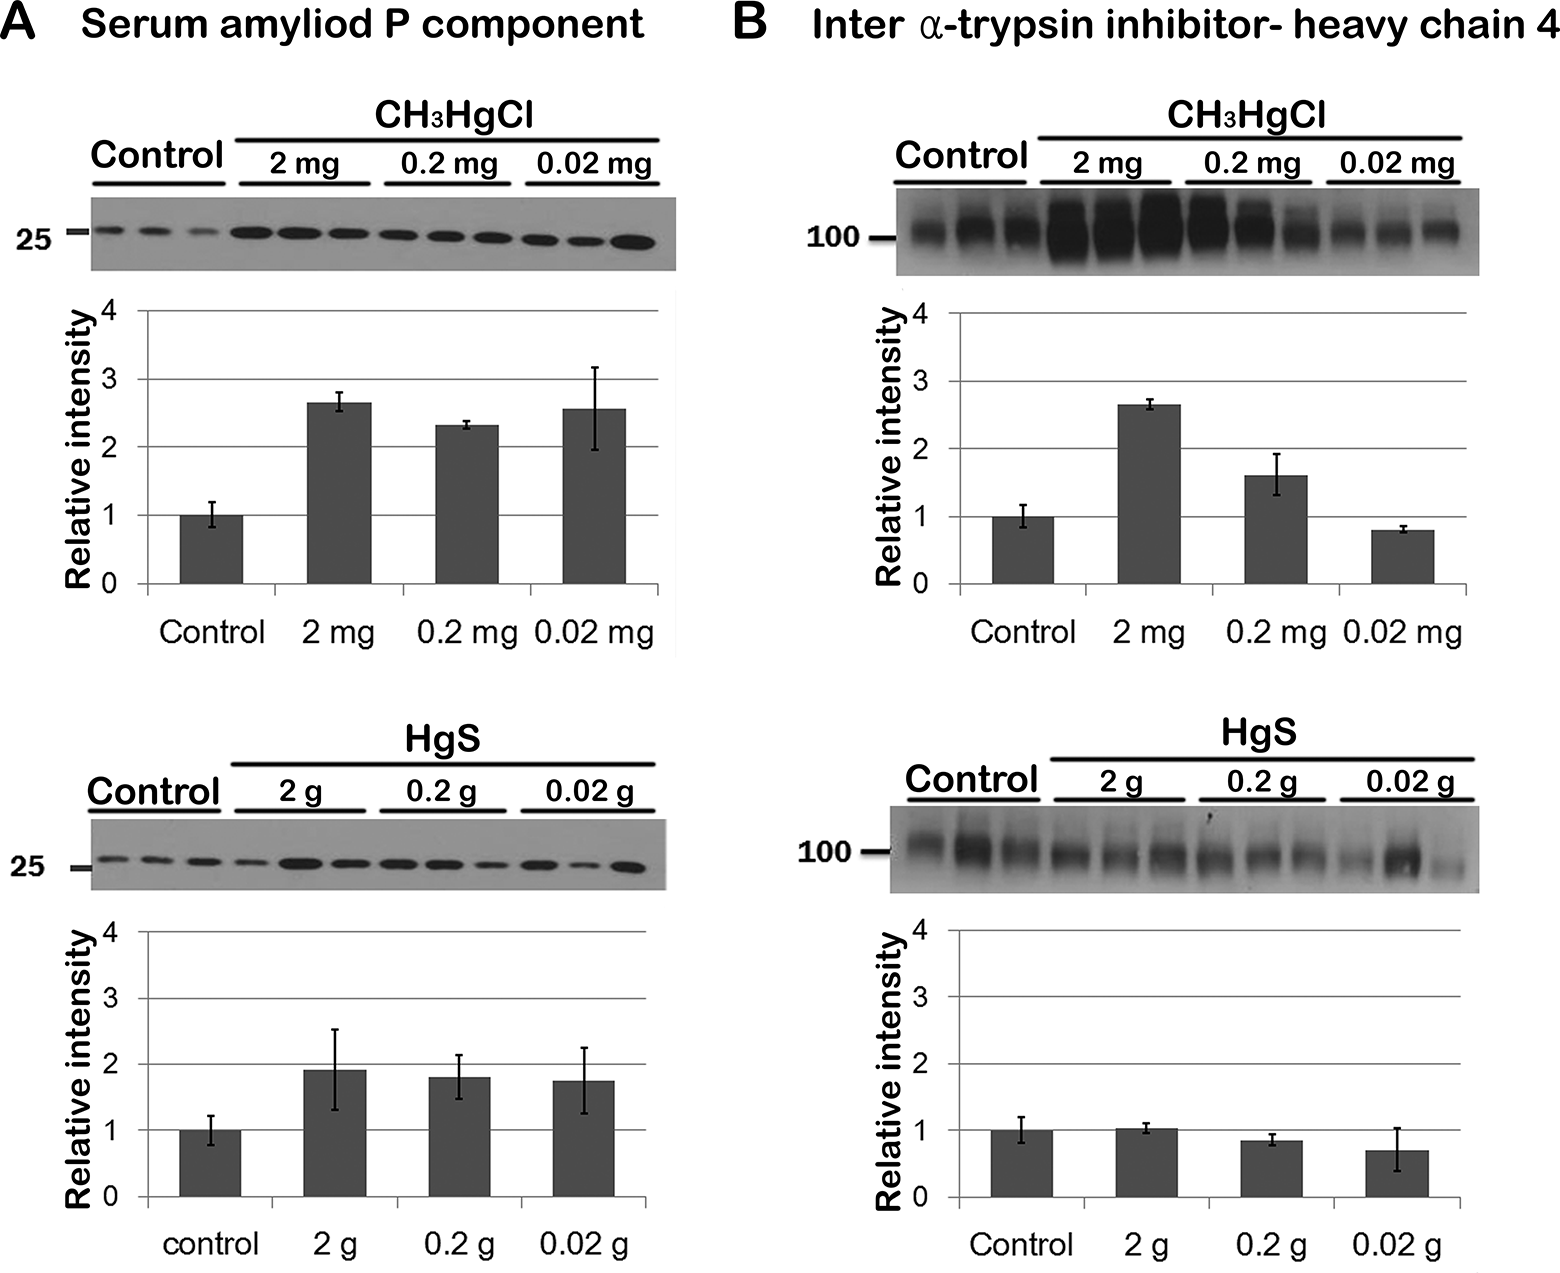
Validation of differentially expressed proteins (serum amyloid P component and inter
Predicted molecular size of SAP protein was approximately 25 kDa and that of ITI-H4 protein was 100 kDa. Compared with the control group, expressions of SAP (∼2.66-fold) and ITI-H4 (∼2.66-fold) were significantly elevated in CH3HgCl (2 mg/kg/d)-treated mice serum. However, about 2.66-fold, not 6.9-fold (shown in proteomic result), of increase was documented for SAP. In the case of HgS (2 g/kg/d) treatment, SAP showed a slight increase (1.92-fold); however, it was not statistically reliable, and no differences in ITI-H4 were observed compared to the control group. These findings indicated that relative quantification strategy and Western blot gave somewhat similar results for expression of SAP and ITI-H4 in mercury-treated mice, suggesting the potential of SAP and ITI-H4 as biomarker candidates for CH3HgCl exposure.
To further confirm the biomarker candidates for CH3HgCl exposure, we stained liver tissues with antibodies for SAP and ITI-H4 (Figure 4A and B). In SAP staining, hepatocytes surrounding the central vein in the CH3HgCl group (Figure 4A) showed strong immunoreaction for SAP compared to the control group. In ITI-H4 staining, strong immunoreaction for ITI-H4 was shown by hepatocytes surrounding the central vein in the CH3HgCl group (Figure 4B) but not in the control group. These immunohistochemistry data supported the validity of SAP and ITI-H4 as biomarker candidates for CH3HgCl exposure.
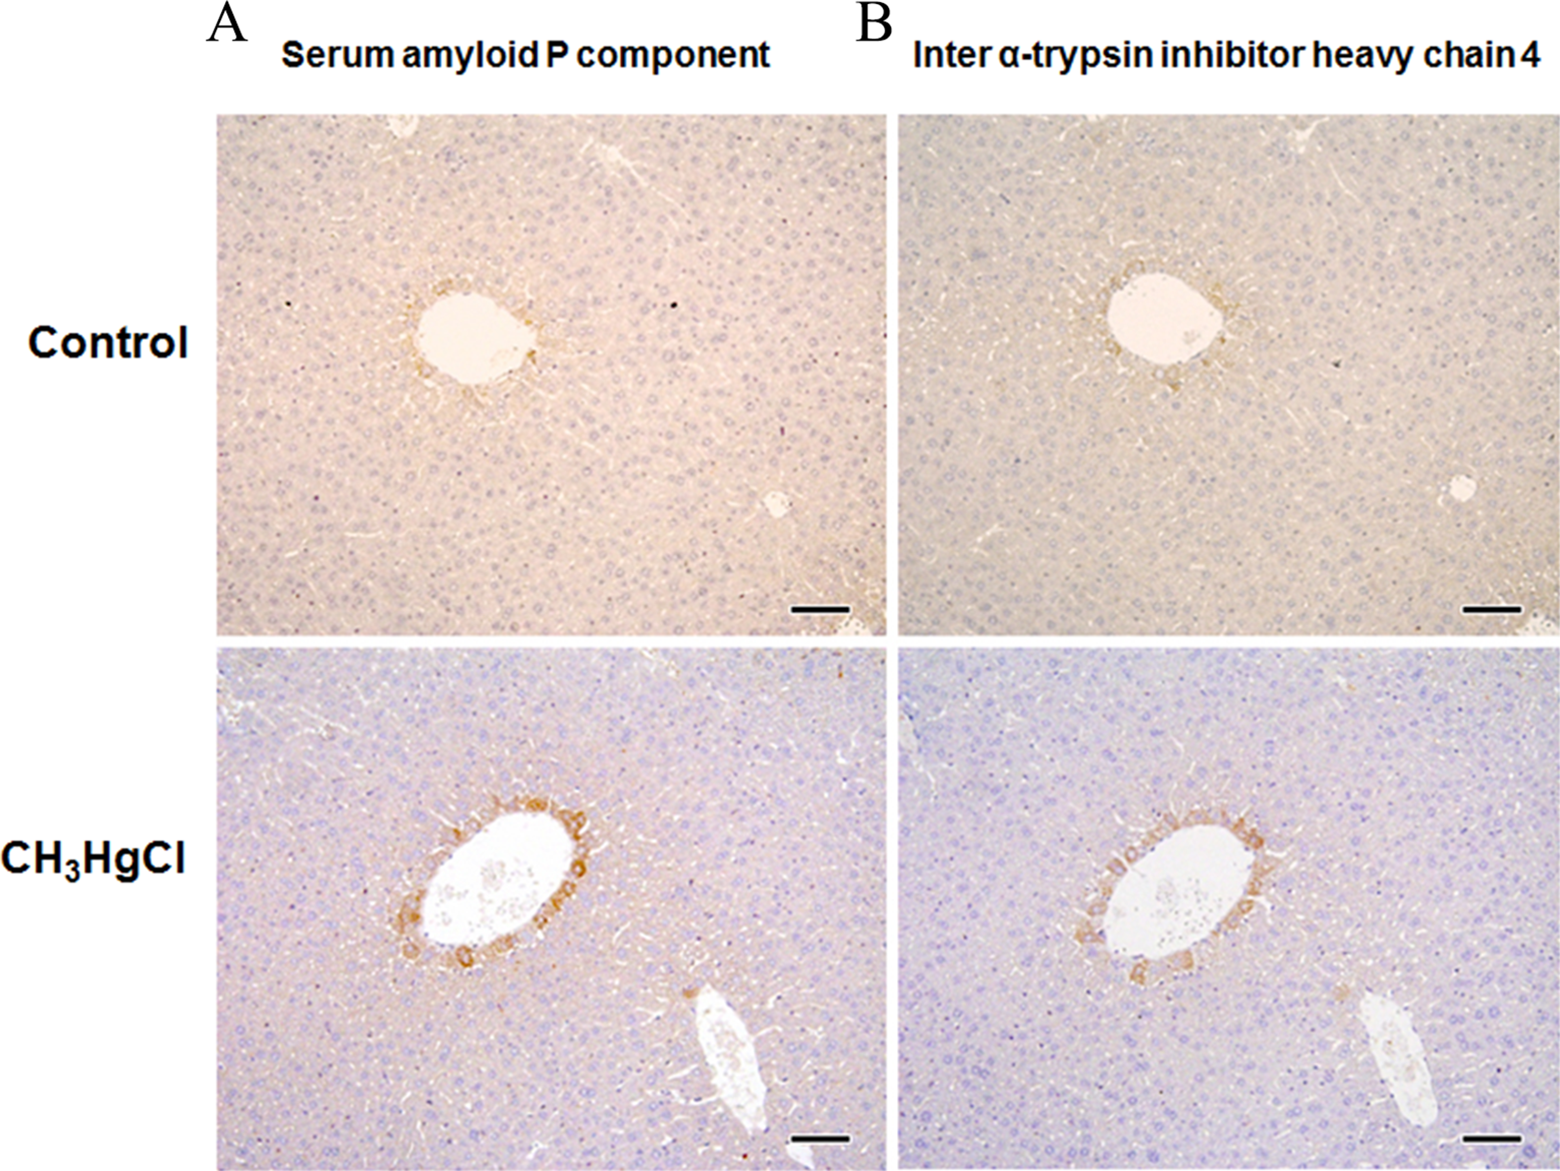
Immunohistochemistry for amyloid P component and inter α-trypsin inhibitor heavy chain 4. Liver sections (n = 3) were stained with the antibody for amyloid P component. Top: control, bottom: 2 mg/kg/d of CH3HgCl. Scale bar: 50 μm.
In summary, for identification of specific serum biomarkers of mercury exposure, we used a lectin affinity column for reduction of complexity from serum protein, analysis of glycoprotein abundance with label-free quantification using nanoultra performance liquid chromatography LC-MS/MS, and detection of some important serum proteins that showed correlation with results of the toxicity study. Here, among them, SAP and ITI-H4 were confirmed by Western blot analysis and immunohistochemistry of liver tissue. This is the first proteomic study using an animal model to find serum biomarker candidates for mercury exposure; a further study using clinical subjects is needed.
Footnotes
Authors’ Note
Bong-Hwa Kim and Pyong-Gon Moon contributed equally to this work.
Declaration of Conflicting Interests
The author(s) declared no potential conflicts of interest with respect to the research, authorship, and/or publication of this article.
Funding
The author(s) disclosed receipt of the following financial support for the research, authorship, and/or publication of this article: This work was funded by the grant from the Korea Food and Drug Administration, and by the grant from the Korean Reach Institute of Standard & Science (12011019).
Supplementary Materials
Supplemental Data files located at ![]() Supplemental Table 1: Description of animals. Supplemental Table 2: Absolute-Quantification: List of proteins identified quantified among CH 3HgCl, HgS, and control. For each protein, they show IPI accession number, protein description, concentration (fmol) from each run, and mean of concentration (fmol) from each group.
Supplemental Table 1: Description of animals. Supplemental Table 2: Absolute-Quantification: List of proteins identified quantified among CH 3HgCl, HgS, and control. For each protein, they show IPI accession number, protein description, concentration (fmol) from each run, and mean of concentration (fmol) from each group.
References
Supplementary Material
Please find the following supplemental material available below.
For Open Access articles published under a Creative Commons License, all supplemental material carries the same license as the article it is associated with.
For non-Open Access articles published, all supplemental material carries a non-exclusive license, and permission requests for re-use of supplemental material or any part of supplemental material shall be sent directly to the copyright owner as specified in the copyright notice associated with the article.