
Abstract
We present here the development of a triethanolamine (TEA) nanocomposite-based chemiresistive gas sensor for detecting NO2 in the ambient environment. The detection mechanism is based on measuring resistivity changes that occur in a nanocomposite due to the absorption and continuous reaction of NO2 gas molecules with TEA. By incorporating carbon nanoparticles into the nanocomposite, NO2-induced resistance changes are amplified by the nanocomposite and measured. Based on calibration, the sensor has a calculated sensitivity of ∼50 parts per billion (ppbv) (limit of detection) to NO2 with a response time of 2 min. Sensor did not react with exposure to NO, O3, CO, CO2, and SO2. Sensor prototype is compact, cost effective, and has the capability of being modularized for field deployments, which are the key requirements for developing portable sensor technology for air quality monitoring.
Keywords
Introduction
Nitrogen dioxide is a ubiquitous air pollutant produced by numerous processes (such as combustion) in air. At elevated levels in the atmosphere, NO2 can cause harm to human health and ecosystems. 1 –5 Spatially intensive monitoring of important air pollutants, such as NO2, is severely limited due to the lack of cost-effective monitoring systems. Most air quality management districts monitor for regional air quality with only a handful of monitoring sites. This situation increases the reliance of air quality management on modeling and emission control, strategies which may not generate the most cost-effective approach to achieving regulatory standards. Furthermore, this limitation in monitoring capability is increasingly problematic as health studies document the importance of local scale health and ecosystem impacts near unmonitored air pollution sources. 6 –11 Clearly, the development of readily deployable, cost-effective sensors for detecting dynamically varying amounts of air pollutants, such as NO2, would address critical needs in air quality management.
Over the last decade, numerous solid-state devices have been developed to measure NOx at high levels (10–100 ppmv). 12 –16 However, for ambient measurements in the urban atmosphere, sensitivity on the order of 1 ppbv is desirable. 17 Chemiluminescence-based instruments were developed in the 1980s 18 and are the EPA-approved instruments for monitoring NO and NO2 in ambient air. 17 These instruments are based on detecting photons emitted from NO2 in the reaction between NO and O3. The instruments are large (2 ft3), weigh over 50 lb and require 300 W of power. The sensitivity and selectivity of these instruments are very good although significant chemical interferences have recently been identified for NO2. 19,20
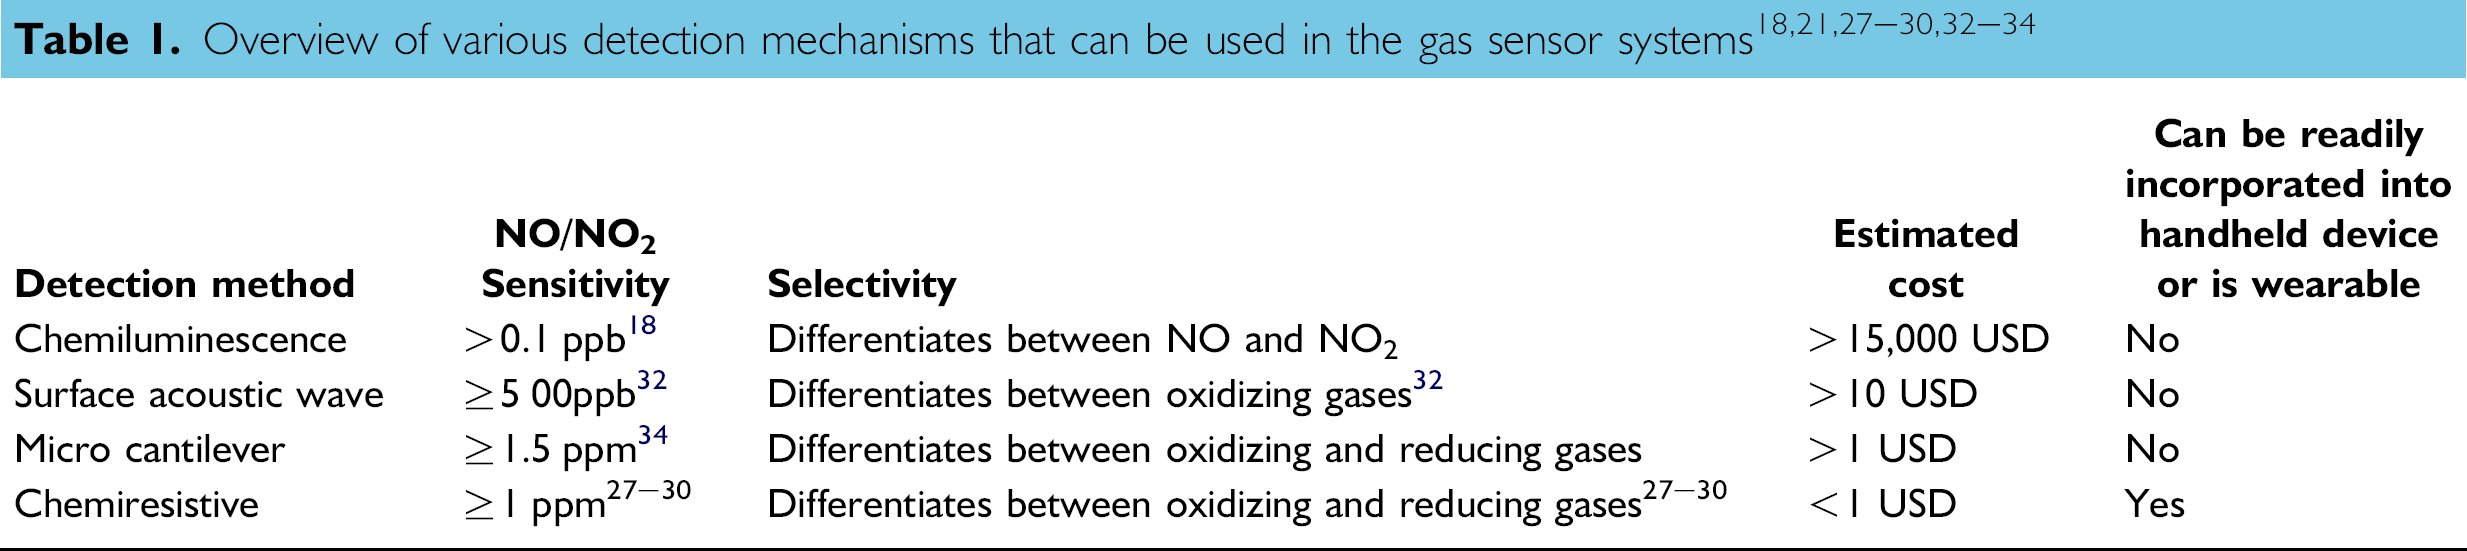
Nanotechnology has enabled the use of nanomaterials and nanostructures in sensors and sensor systems. These nanoscale entities have enhanced the detection capabilities of existing trace gas sensing technology by improving the surface area to volume of the active sensing surface 21 and have improved the signal strength of the response. 21 –23 In addition, nanotechnology-enabled sensors have also enabled miniaturization in sensor technology that is critical for developing field deployable devices/systems. Due to these advantages afforded by nanotechnology, there has been significant advancement in the domain of trace gas sensing technology. Nanotechnology-enabled sensors have been built using various detection techniques. The detection techniques vary in the measured parameter that is modulated as a result of the interaction of the trace gas on to the sensor surface. These include, optical, 18,24,25 electrical/electrochemical, 20,26 –31 electromagnetic, 32,33 and mechanical 34,35 modulation. Optical detection techniques are mainly based on either emission/adsorption of light or a change in color when the analyte gas reacts with a reagent. Electrical/electrochemical detection mechanisms are based on the change in electrical properties of the reagent when it is exposed to a particular gas analyte. This change in electrical properties can be either due to the adsorption or reaction of the analyte with/by the reagent. Electromagnetic detection mechanism is mainly based on the change in properties of surface acoustic wave that travels across the surface of a reagent when exposed to a particular analyte. Mechanical detection mechanisms are based on micro cantilevers in which the resonant frequency changes due to mass loading or due to the force constant. Out of these, electrical parameter-based detection techniques are currently one of the most widely used detection methodologies in portable trace gas detection due to improved signal-to-noise ratio and the availability of electronics that can be integrated to the sensor platform enabling portability. Table 1 provides a brief overview of the detection methods used in trace gas detection and the associated performance parameters using these techniques.
Nanocomposites are one of the most widely used material systems that function as the active sensing area in nanotechnology-enabled trace gas sensors. Nanocomposites are heterogeneous materials that are created by introducing nanomaterials into macroscopic base materials. Nanocomposites have been known to enhance various physical properties of the base material. These physical properties include electrical, mechanical, thermal, and optical properties of the macroscopic base material. Due to the nanocomposites' enhanced physical properties, as well as the improved surface area to volume in comparison to the base macroscopic material, they are commonly used for trace gas detection. 21
By proper tailoring of these nanocomposites, one can achieve preferential detection of a specific gas analyte. For selective detection of any particular gas analyte, the macroscopic material in the nanocomposite should be sensitive/reactive toward that particular gas analyte. When the nanocomposite is exposed to the trace gas molecules, the macroscopic base material adsorbs/reacts with the gases molecules, which results in the change in the physical properties of the macroscopic base material. In the work presented in this article, we have used the changes to the resistivity of the triethanolamine (TEA) macroscopic base material due to the interaction of NO2 gas molecules with TEA and amplified this electrical response by incorporating carbon nanoparticles (CNPs) into TEA. Hence, the TEA—CNP nanocomposite demonstrates preferential selectivity to NO2 and we demonstrate the following performance parameters: Limit of detection (LOD) ∼50 ppb, demonstrated dynamic range of detection of 200–1800 pbbv, response time of 2 min (averaging time of 5 min), and selectivity with respect to O3, CO, NO, CO2, SO2, and CH4. Moreover, due to its detection mechanism and simple electrical circuitry, this NO2 sensor can be tailored as a wearable sensor or it can be integrated into handheld devices.
Experimental Section
Nanocomposite
For the selective detection of NO2, we developed a novel nanocomposite mixture containing TEA (2,2′,2′-nitrilotriethanol (C2H4O)3N) (98%, Sigma-Aldrich, St. Louis, MO), CNPs (99% CNPs, American Elements, Los Angeles, CA), distilled water, and a surfactant (Brij 35, Sigma-Aldrich, St. Louis, MO). TEA is an organic chemical compound, which has been used as an absorbent for sampling NO2 since the 1970s. 36 Under aqueous conditions, TEA reacts with absorbed NO2 to form Nitrosodiethanolamine, resulting in the formation of NO2 − and NO3 − ions. 37 CNPs (average size of ∼30 nm) function as sensitive resistive elements in the composite. 38 –42 As nitrite and nitrate ions form from the reaction of gas-phase NO2 with TEA, the resistance characteristics of the nanocomposite changes and is measured. To improve the dispersion of the CNPs and TEA, a surfactant was added to the nanocomposite. This also improved the resistivity characteristics of the nanocomposite matrix. 43
Microelectrode Array
A printed circuit board-based microelectrode array (MEA) functioned as the base platform on which the nanocomposite was drop coated to measure the electrical changes. The microelectrode platform was fabricated using standard processing techniques and enabled the rapid, continuous measurement of electrical voltage changes associated with the resistivity changes of the nanocomposite due to the interaction of NO2 gas molecules with the active sensing (Fig. 1).
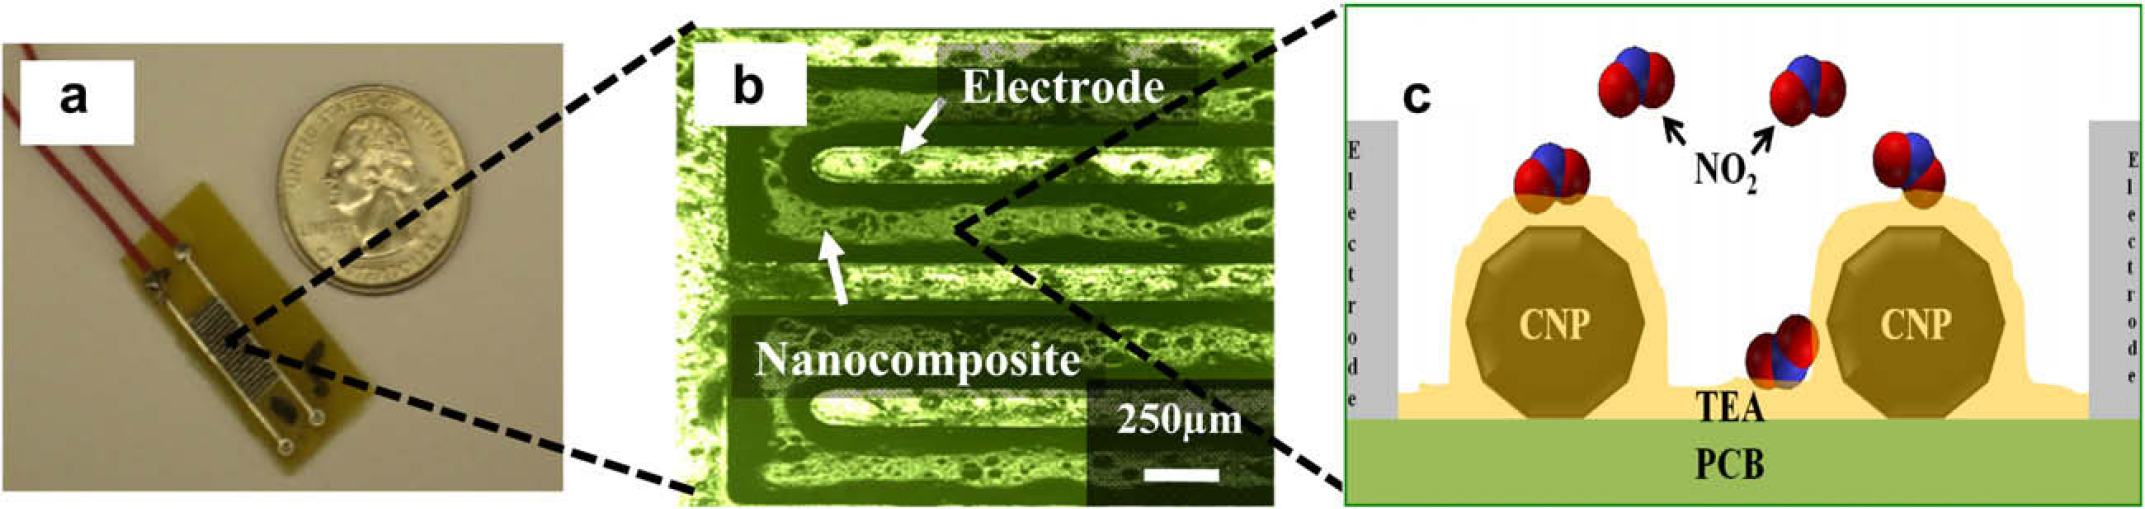
(a) Picture of prototype NO2 sensor. (b) Optical micrograph of metallic interdigitated electrode base electrode coated with the carbon nanocomposite. The width of each finger in microelectrode array was 180 μm and the spacing between two fingers was 250 μm. The thickness of the nanocomposite was ∼50–60 nm. (c) Schematic representing the reaction and transducer functions of the nanocomposite.
The MEA is comprised of an interdigitated pattern with 20 digits. The width of each digit is ∼180 μm and the separation between two adjacent digits is ∼250 μm. The MEA was designed to maximize the coverage on the base platform and maximize the electrical voltage signal strength obtained from the nanocomposite. These individual digits in the MEA platform were fabricated from an alloy of aluminum and copper to improve signal conductivity and minimize signal loss.
Equivalent Electrical Circuit of the Chemiresistive Sensor
In the domain of electrochemical sensor systems, there are a broad range of electrical parameter-based detection mechanisms such as chemiresistive, potentiometric, voltammetric, and amperometric. Resistance, voltage, and current are measurable parameters that can be modulated during the process of trace gas detection. In the present application, we used chemiresistive detection, where we measure the changes to the resistivity of the nanocomposite by continuously monitoring the resistance changes that occur due to the interaction of the trace gas species (NO2) onto the nanocomposite surface. The chemiresistive detection methodology was selected as it has robust measurement capabilities over a large dynamic range (parts per billion–parts per million) for a number of reactive trace gases. 27 –30
The principle of operation of the chemiresistive sensors is based on the measurement of resistance change associated with the adsorption/reaction of trace gas analyte by/with the nanocomposite material. 27 –30 Figure 1 shows the simplified equivalent circuit of the NO2 chemiresistive gas sensor. In this technique, a Wheatstone bridge was used for detecting the change in electrical resistance of the nanocomposite. The MEA with the nanocomposite was connected to one arm of the Wheatstone bridge and the entire nanocomposite-coated MEA functioned as a resistor. Whenever the sensor chip was exposed to NO2, there was an observed change in the electrical resistance of the nanocomposite. This change in electrical resistance resulted in an imbalance of the Wheatstone bridge. So, there was a corresponding change in voltage at the output terminals of the circuit, which was measured using a two probe-measuring device.
In other words, when the Wheatstone bridge was balanced, the total current from the voltage source Vin (in Fig. 2) was equally divided between the two branches (I 1 = I 2). But when the nanocomposite-coated sensor chip was connected to one leg of the Wheatstone bridge, the total current (It ) was divided depending on the electrical resistance of the sensor chip. When the sensor chip was exposed to NO2, there was decrease in electrical resistance of the chip resulting in increased electrical current passing through the chip. Lower the resistance higher the current passing through the chip.
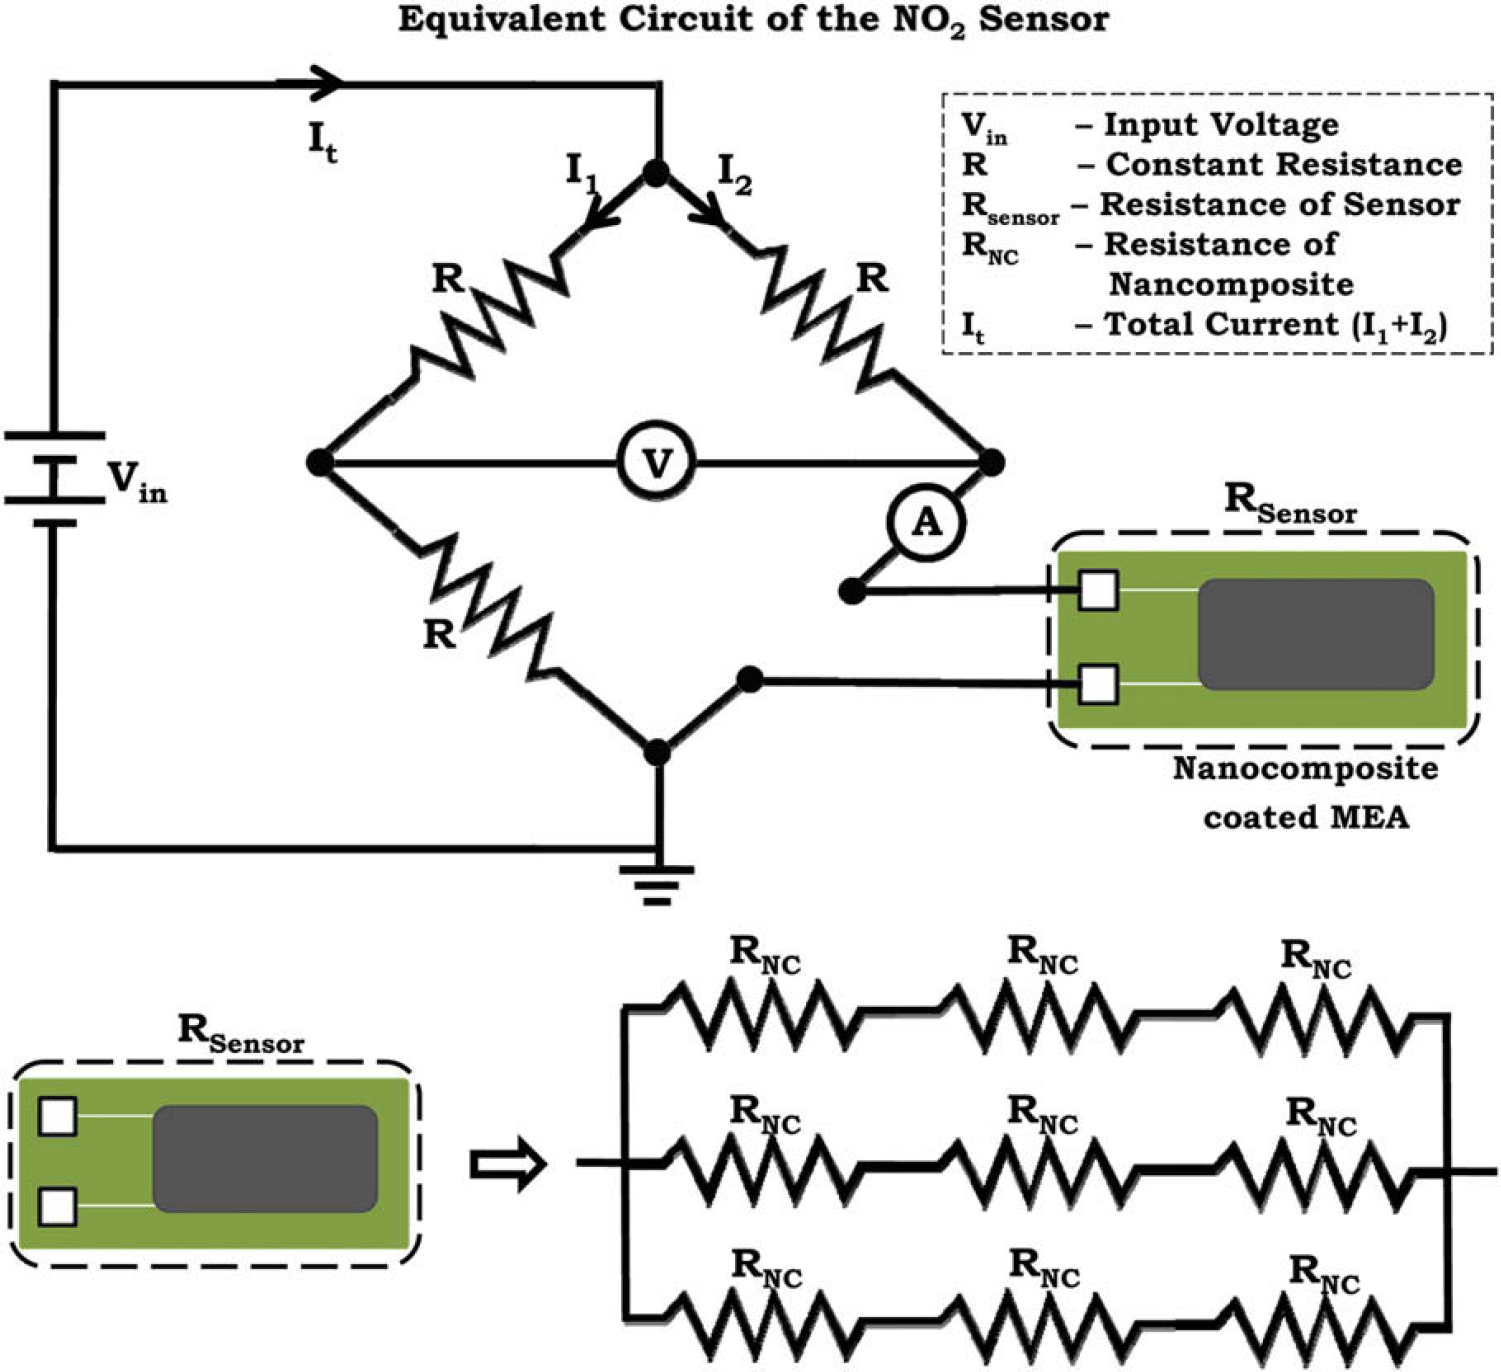
The equivalent circuit of the entire chemiresistive gas sensor and equivalent resistance of the nanocomposite. The resistor Rsensor in the Wheatstone bridge circuit is the equivalent resistance of the nanocomposite. Nanocomposite forms bridges between the microelectrode array at various points on the chip, which resembles a series parallel equivalent resistance.
Experimental Test Bed
The experimental test bed consisted of a 200-L glass chamber into which the prototype sensors were introduced (Fig. 3). The ambient environment was simulated by introducing potentially interfering gases. The sensor prototype was connected to a Wheatstone bridge circuit. Changes to the electrical resistance of the nanocomposite were converted to an electrical voltage change that was indicated by the imbalance in the Wheatstone bridge. The voltage levels varied between 0.1 and 10 mV, which in turn translated into a resistance change of 50–500ω. The output of the Wheatstone bridge was connected to an analog to digital converter (ADC), which was connected to a PC. The ADC converted the analog signals from the Wheatstone bridge to digital signals and routed those converted signals to a PC. The composition of the gas and the gas concentration within the chamber were monitored by standard air quality monitoring instrumentation (Thermo Scientific, Model 42C Trace Level NO-NO2-NOx Analyzer, Waltham, MA).
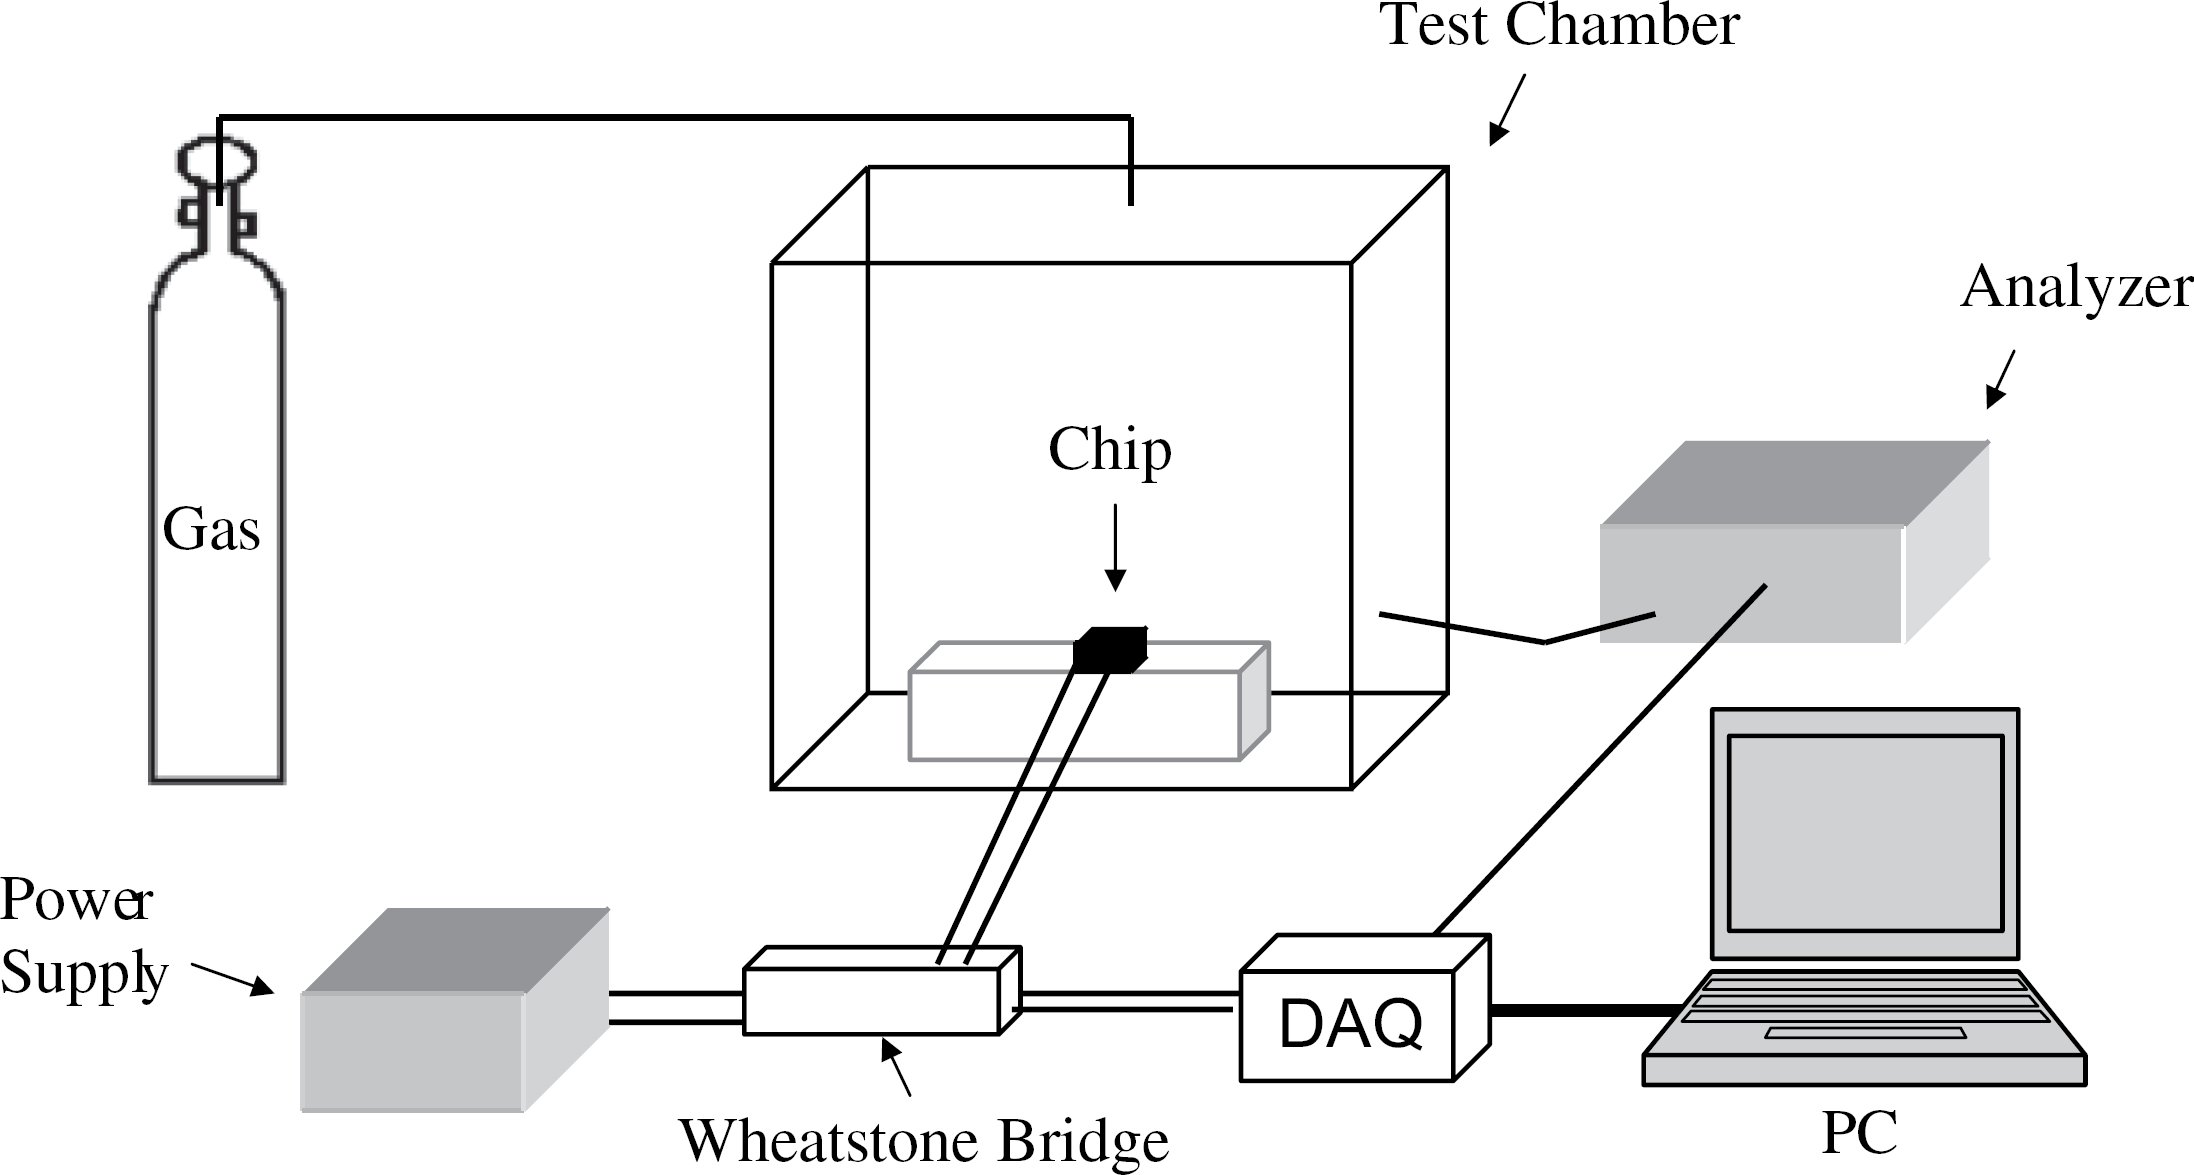
The figure shows the schematic of experimental test bed. The test bed consists of a glass test chamber in which the sensor is tested, a chemiluminescence trace gas analyzer, which is used for monitoring the analyte gas concentration level in the test chamber and electrical circuit that is used for monitoring the change in electrical resistance of the sensor when it is exposed to analyte.
Experimental Test Cycle
The nanocomposite-coated MEA chips are placed in the glass test chamber filled with clean air produced from compressed ambient air passed through a laboratory-constructed Purafil/Activated Charcoal/Molecular Sieve filtration pack. The resulting air was ozone free, NOx <1 ppb, total volatile hydrocarbons <1 pbb, and dew point −0.6 °C. Finally, the purified air was passed through a FeSO4 cartridge to convert residual higher oxides of nitrogen to nitric oxide. The resistances of these chips were monitored continuously using a Wheatstone bridge and ADC. After collecting the baseline resistance of each chip for around 20 min, test gases were introduced into the chamber to test the sensitivity of the nanocomposite toward a test trace gas. The test gases tested were NO2, NO, O3, CO, CO2, CH4, and SO2. The changes in the electrical resistance of the nanocomposite-coated chips due to reaction between nanocomposite and test gases were monitored using the same Wheatstone bridge and ADC. Response curves were plotted as function of percentage change in voltage and time. We define percentage change in voltage as:

where, Vt is the voltage measured from the chip at a specific time instant t, V t+Δt is the voltage measured from the chip after a time interval Δt.
Results
Sensitivity toward NO2
Optimization of the nanocomposite mixture was investigated in the test chamber with NO2. TEA concentration, CNP concentration, and surfactant levels were varied to achieve the most sensitive mixture. The optimal mixture was determined to be 10% TEA, 0.1% CNP, and 0.0001% Brij in water. Decrease in the sensitivity was observed with either increase or decrease in the concentration of the CNP and Brij. Increase in CNP concentration results in forming a secondary conductive path between the two fingers of MEA, resulting in reduced sensitivity. Decrease in CNP reduces the amplification capability of the nanocomposite. Increase in the Brij makes the nanocomposite purely conducting, which reduces the sensing capability of the sensor (ideal resistance of the nanocomposite for sensor should be in semiconducting range). Decrease in the Brij results in improper dispersion of CNPs and highly viscous TEA. Each MEA was coated with 10 μL of nanocomposite. Increase in the quantity of the nanocomposite increases the concentration of CNPs between the two fingers, which results in decrease of sensitivity. Decrease in the quantity used for coating results improper formation of conductive path between the two fingers.
Sensitivity of the optimized nanocomposite mixture was determined by exposing chips in the test bedchamber under varying concentrations of NO2. Nitrogen dioxide levels were monitored by the chemiluminescence instrument. Three chips were tested at each concentration. Because the quantity of TEA present on the chip is essentially constant, the rate of change in electrical resistance varies with variation in the NO2 concentration. So, the concentration of NO2 can be determined by the percentage rate of change in voltage level at the output terminals of Wheatstone bridge circuit. This rate of change in voltage can be clearly observed in Figure 4a for NO2. The rate of decrease in voltage level depends on the concentration of NO2 in the environment. This dynamic change in voltage in the presence of NO2 is calculated using slope of percentage change in voltage versus time (Eq. 1). The change in slope is negative because the resistance of the nanocomposite decreases when it is reacting with NO2. For a particular concentration of NO2, the rate of change in resistance of the chip or the rate of change of voltage across the Wheatstone bridge is constant for around 12–14 h.
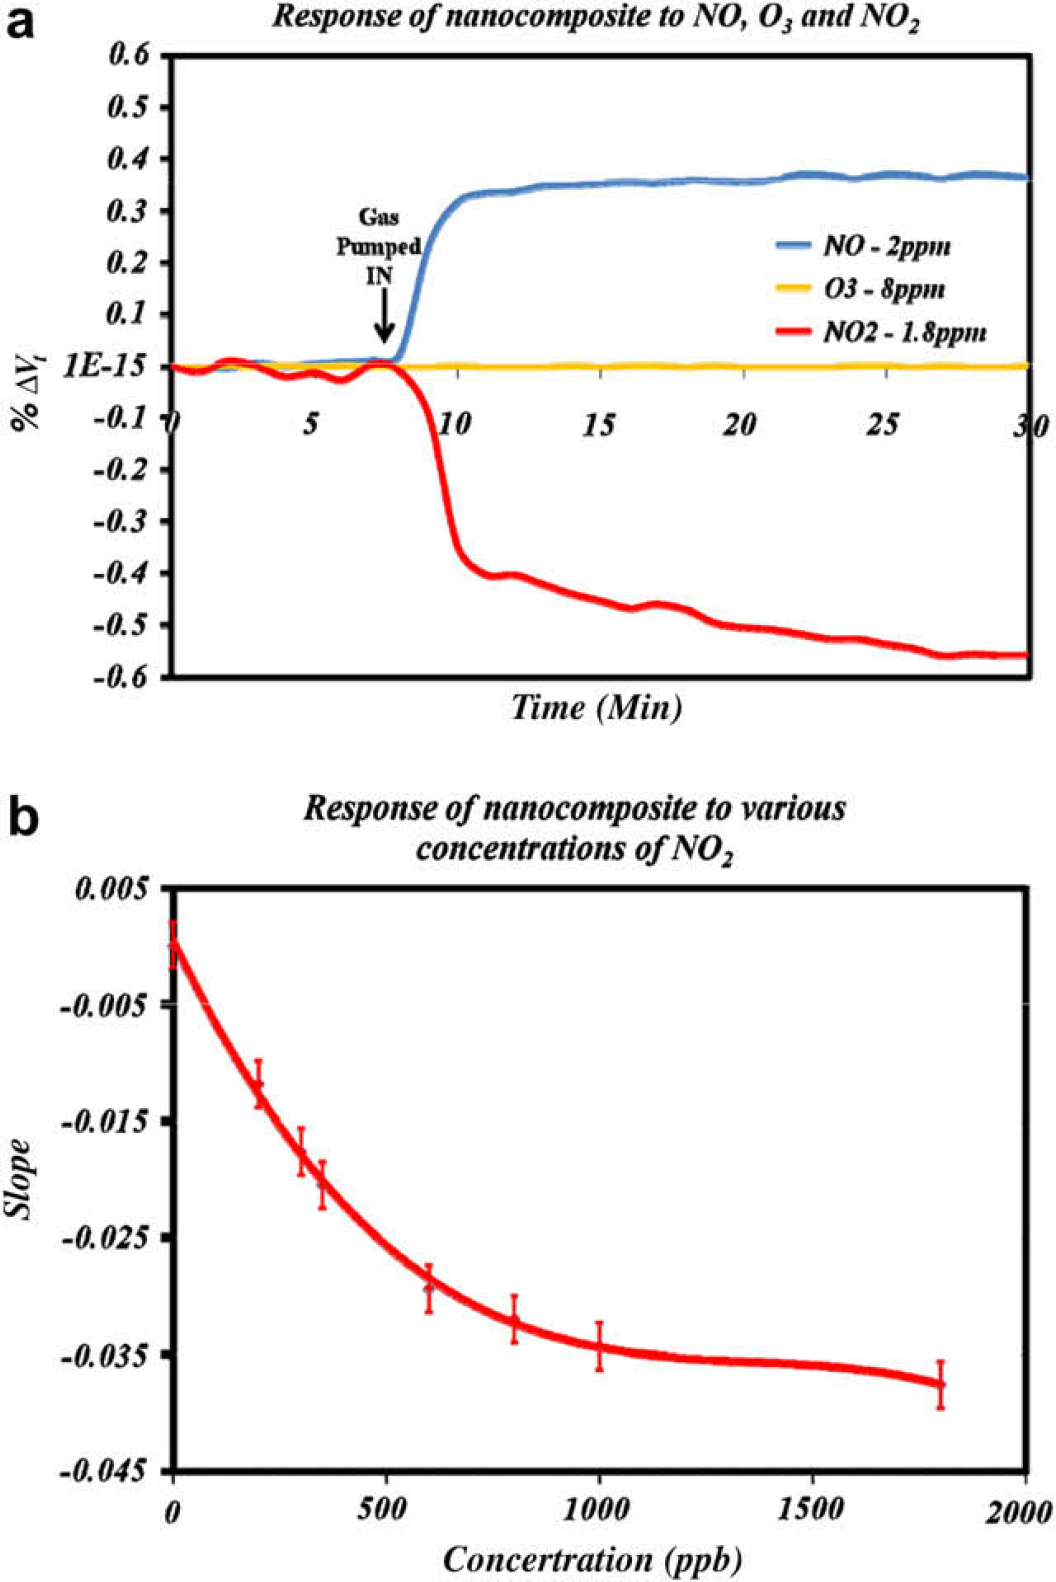
(a) Shows the change in signal from the nanocomposite with NO, O3, and NO2 in three separate experiments. It is observed that the dynamic voltage of the nanocomposite decreases, while the other two gases show only transient behavior (2-min running average). (b) Nonlinear calibration curve for prototype NO2 sensor.
Selectivity toward NO2
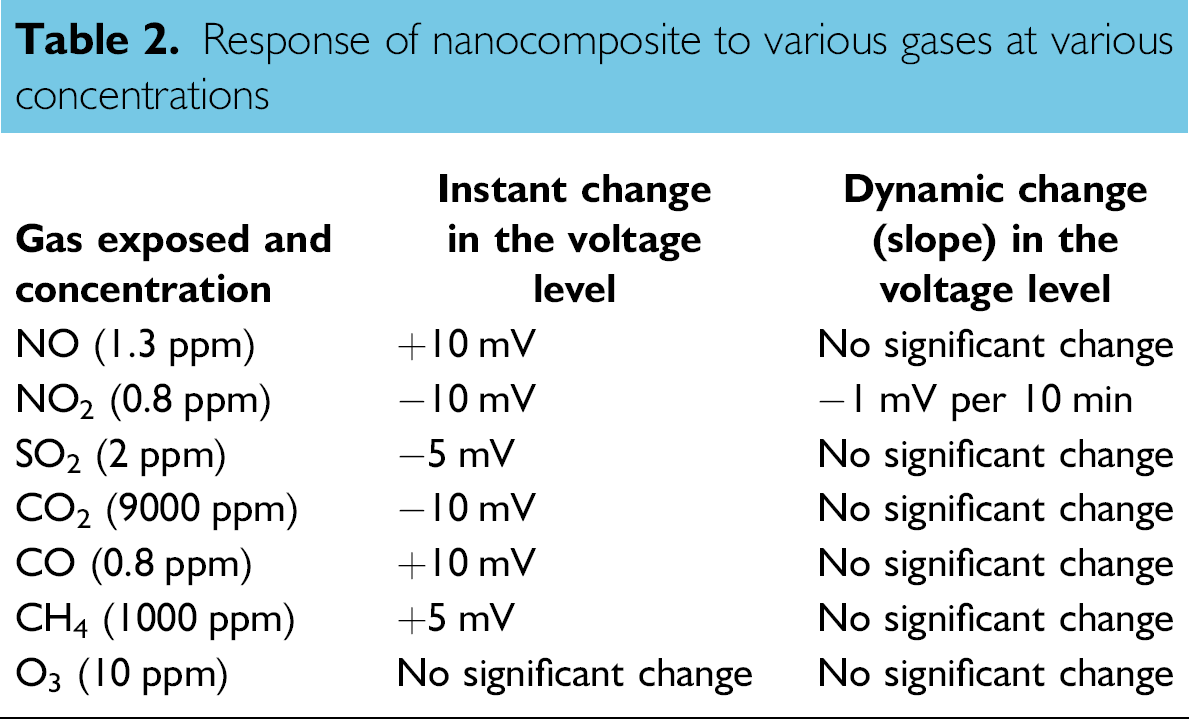
Table 2 shows the response of the nanocomposite to various other gases that are typically present in the environment along with the NO2, albeit at much lower concentrations. The nanocomposite shows a transient change in resistance when it is exposed to gases other than NO2 (Fig. 4a). The dynamic response is unique to NO2 compared to the other gases investigated (Table 2).
Response of nanocomposite to various gases at various concentrations
Discussions and Summary
The prototype sensor functions on the chemiresistive principle in which variations in the resistance of the nanocomposite as a response to NO2 were observed and measured. Resistance changes in this particular nanocomposite occurred due to selective adsorption and reaction of NO2 with TEA releasing negative ions into the nanocomposite. We observed strong correlation between the decrease in the resistance of the nanocomposite to the increase in concentration of NO2 impinging on the nanocomposite surface. The electrical properties of the negative ions between the interdigitated digits of MEA pattern are believed to be the cause of the dynamic (continuous) decrease of the chip resistance.
We also observed a transient response of the sensor to presence of other gases. This is believed to occur due to the diffusion of the gas along the surface of the active sensing area thus facilitating the interaction of the reactive gas species with the loosely bound electrons at the surface of the nanocomposite. These stray electrical effects due to diffusion of gases may be reduced by desiccating the nanocomposite to reduce the solvent in the nanocomposite. However, desiccation resulted in a drastic decrease in the sensitivity as the free electrons are thought to contribute to the trace gas induced electrical voltage (resistance) changes as well. Although, there is a transient response of the sensor to competing gases, the response does not change appreciably over time. On the other hand, the relevant response pertaining to the NO2 trace gas detection has been identified with the dynamic response of the nanocomposite due to continuous reaction of NO2 with TEA. Based on these measurements, we conclude that the TEA nanocomposite showed preferential selectivity toward NO2.
The nonlinearity of the calibration curve (Fig. 4b) is likely to be related to a combination of Wheatstone bridge voltage/resistance characteristics and the reaction rate between gas-phase NO2 and liquid-phase TEA. This nonlinear relationship was established by exposing multiple replicates of the sensor prototype with the active nanocomposite sensing area to, various concentrations of NO2. Based on the standard deviation of replicate experiments, the LOD of the current device is ∼50 ppbv. At present, due to limitations of our gas-handling equipment and electronics, concentrations below 200 ppbv cannot be experimentally investigated. This LOD can be improved postdetection by using various electronic signals conditioning circuitry for improving the signal-to-noise ratio. The baseline electrical noise present in the circuit is in the order of millivolts.
Chemiresistive detection is a technique in which one can design a highly sensitive gas sensor, which is portable, sensitive, and cost effective. The main drawback with the chemiresistive detection technique is its lack of selectivity toward a particular gas analyte. Chemiresistive sensors have been designed to differentiate between oxidizing and reducing gases; 27 –30 however, in the presence of both reducing and oxidizing gases, such as in the atmosphere, this simple selectivity would be problematic. We describe and test a chemiresistive gas sensor, which can selectively detect NO2 in the environment.
Because, the reaction between TEA and NO2 is not reversible; it is not possible to recover the sensor. In other words, this is a disposable, dosimeter-style sensor and it can be used for a limited duration.
Future Work
In summary, we developed a portable, low-cost, NO2 gas sensor prototype, which can detect NO2 with high sensitivity (LOD ∼50 ppb) and preferential selectivity of detection in a simulated “real-world” environment with respect to NO, SO2, O3, CH4, CO, and CO2. We anticipate improving the sensitivity by incorporating electrical conditioning and amplification circuitry geared toward reducing noise background and improving signal conditioning, which can increase the signal-to-noise ratio and amplify the response obtained from the sensor prototype. The selectivity of the nanocomposite can be improved by compacting the nanocomposite to reduce stray electrical variations associated with loosely bound/free electrons.