
Abstract
DNA melting analysis for the identification of sequence is increasingly used in molecular diagnostics. Recent advances in DNA melting analysis, including high-resolution instrumentation and specialized fluorescent DNA-binding dyes, allow genotyping by whole amplicon melting without probes. With the popularity of melting analysis as a diagnostic tool, there is a need to characterize the ability of commercially available real-time PCR instruments to perform high-resolution amplicon melting analyses. Four real-time instruments varying in sample format, throughput, and heat transfer (Cepheid's SmartCycler, Idaho Technology's HR-1, and Roche's LightCycler 1.2 and LightCycler 2.0) were evaluated for their ability to differentiate homozygous genotypes at the human β-globin sickle cell locus. The melting transition was monitored by including the dye LCGreen Plus in the PCR, and the data were uniformly analyzed with custom in-house software. The wild-type and mutant homozygous genotypes differed by a theoretical Tm of 0.09°C and were best discriminated by the high-resolution HR-1 instrument. All instruments could identify a double single nucleotide polymorphism heterozygote by the heteroduplexes formed. However, signal-to-noise ratios varied from 260 to 3500, suggesting that melting instrument design (data acquisition, data density, thermal control) determines the accuracy of genotyping by amplicon melting. (JALA 2006;11:273-7)
Introduction
Originally introduced in 1997,1–3 melting curve analysis is now a common feature in real-time thermal cyclers for PCR. Although DNA-binding dyes are routinely used for monitoring and quantification of PCR amplifications, their utility for genotyping is controversial.4–8 Recently, saturating DNA dyes, such as LCGreen Plus, in conjunction with high-resolution melting instruments have been used to identify single nucleotide polymorphisms in amplicons up to 1 kb in length.9–11 Different PCR products have melting temperatures (Tm's) based on their sequence, length, and GC content. 2 Nearly all homozygous sequence changes have a shift in Tm compared with the wild-type sample.12, 13
In a previous study, 8 we compared nine different instruments that could be used for DNA melting analysis. In general, 96-well plate instruments performed suboptimally because of temperature differences across the plate. Furthermore, not all instruments could be heated at the same rate: some instruments required only a few minutes for melting, whereas others required over an hour. In the current study, we selected only those instruments that could heat continuously at 0.1°C/s, and also eliminated plate-based instruments to more systematically compare those instruments best suited for genotyping by Tm. Four instruments from three vendors, all compatible with LCGreen Plus, were evaluated. As the evaluation target, we selected the sickle cell mutation in the β-globin gene, an A > T transversion in the second nucleotide base of codon 6 (GAG > GTG). Nearest-neighbor thermodynamic calculations predict that the melting temperature of the wild-type (AA) 110-bp PCR product would be 85.80°C, whereas that of the homozygous mutant (TT) would be 85.89°C, the 0.09°C separation providing a stringent test for differentiation. In addition, an single nucleotide polymorphism double heterozygote from the same amplicon was studied.
Methods
Four instruments were evaluated: SmartCycler II (Cepheid, Sunnyvale, CA), HR-1 (Idaho Technology, Salt Lake City, UT), and the LightCycler 1.2 and the LightCycler 2.0 (Roche, Indianapolis, IN). All instruments could be used for PCR thermal cycling except the HR-1. The characteristics of each instrument are shown in Table 1.
Instrument and sample characteristics
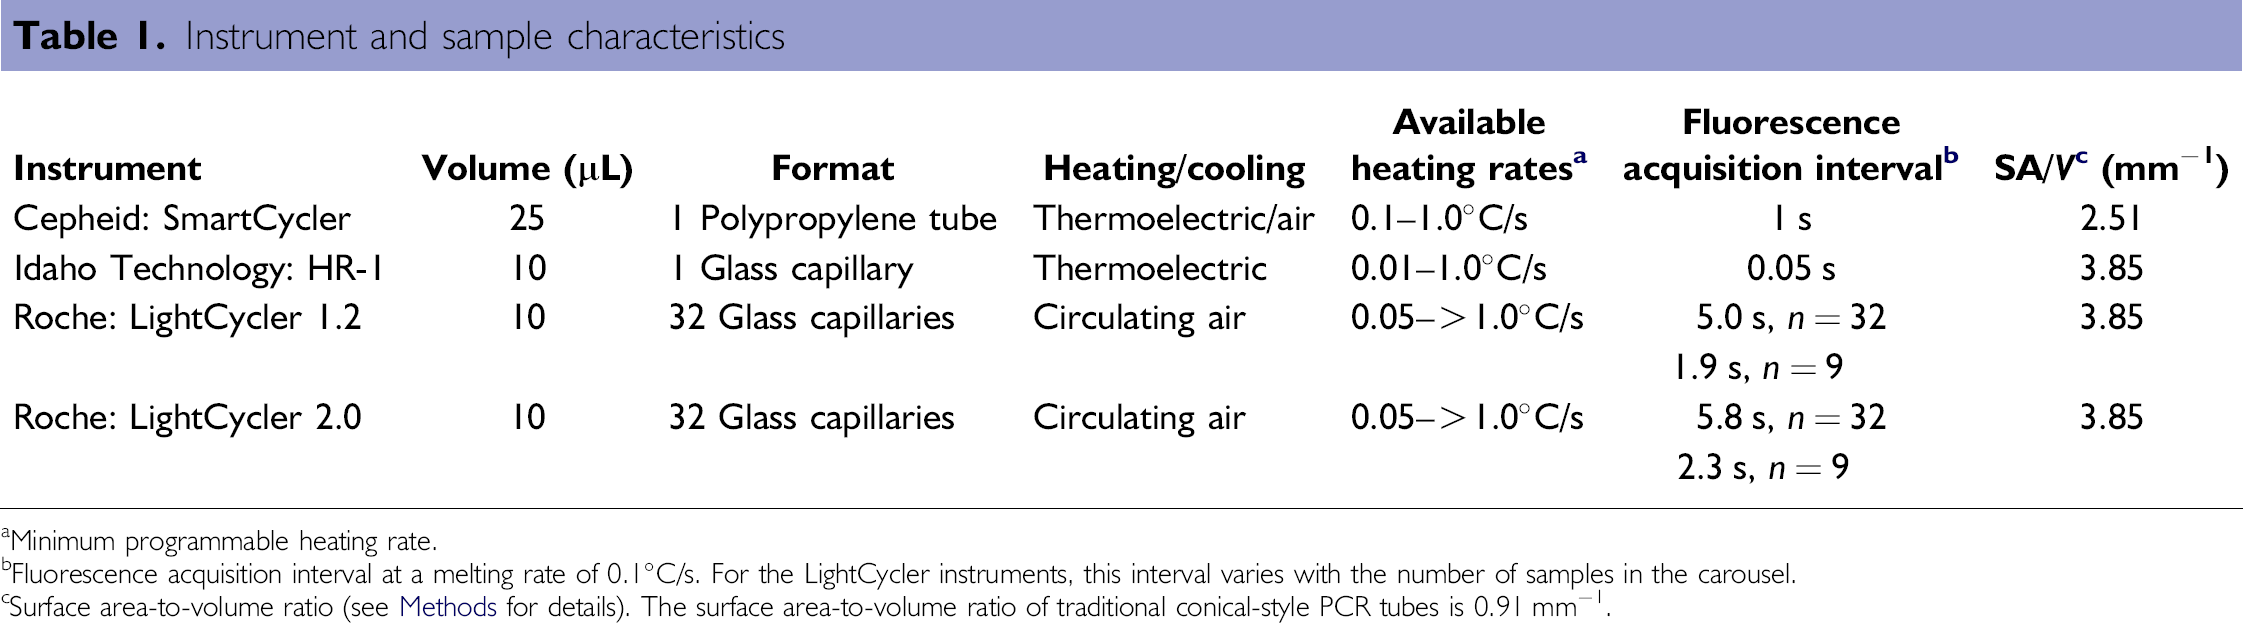
Minimum programmable heating rate.
Fluorescence acquisition interval at a melting rate of 0.1°C/s. For the LightCycler instruments, this interval varies with the number of samples in the carousel.
Surface area-to-volume ratio (see Methods for details). The surface area-to-volume ratio of traditional conical-style PCR tubes is 0.91 mm–1.
DNA was extracted using the QIAamp DNA Blood Mini Kit (Qiagen, Valencia, CA) from residual EDTA-anticoagulated whole blood, de-identified clinical samples (ARUP Institutional Review Board protocol #7275). A single patient sample was used for each genotype, identified through sequencing: wild type (AA), homozygous mutant (TT), and the double heterozygous mutant, codon 2 (CAC > CAT) and codon 6 (GAG > GTG). Amplification of the 110-bp target has been previously described, ending after 35 cycles with an extension phase. 8 Briefly, a whole plate of samples was amplified with 1× LCGreen Plus (Idaho Technology, Salt Lake City, UT) on a GeneAmp 9700 (Applied Biosystems, Foster City, CA), pooled by their respective genotype, and centrifuged to remove any precipitates. The samples were immediately melted without an additional denaturation step.
Each genotype was melted in triplicate on each instrument at the manufacturer's recommended volume, 10 μL for the LightCyclers and HR-1, and 25 μL for the SmartCycler. To accurately assess the Tm variation and signal-to-noise ratio on each instrument, only the wild-type genotype was analyzed in an additional 32 replicates. The sample capacity of each instrument dictated whether the replicates were intra-run (LightCycler), inter-run (HR-1), or mixed (SmartCycler— two runs of 16 samples).
After an initial hold at 60°C for 30 s, the samples were melted by increasing the temperature to 95°C at a rate of 0.1°C/s. All instruments captured fluorescence in a continuous acquisition mode, where the melting rate was held constant and the fluorescence was acquired as rapidly as possible. Original temperature and fluorescence data were extracted from each instrument, arranged in Microsoft Excel, and analyzed by custom software written in LabVIEW, designed for high-resolution melting analysis as previously described. 9, 14 All operations were strictly arithmetic without smoothing or manipulation of the data.
Melting curves were normalized by selecting linear regions before and after the melting transition. These regions defined two lines for each curve, an upper 100% fluorescence line and a lower 0% baseline. The percent fluorescence within the transition (between the two linear regions) was calculated at each temperature as the distance from the experimental data to the lower line compared to the distance between the extrapolated upper and lower lines. Tm's were interpolated from the normalized data as the temperature at 50% fluorescence. Signal-to-noise ratios (S/N) were obtained by dividing the signal (the difference between the upper and lower baselines at the Tm) by the noise (the average standard deviation of the points defining the upper baseline about their best-fit second-degree polynomial). The surface area-to-volume ratio (SA/V) was calculated using the internal surface area of the reaction cell as defined by the sample, divided by the sample volume. The surface areas were calculated using standard volumetric equations. 15
Results
Normalized melting curves from the four instruments studied are shown in Figure 1. Smooth curves are obtained on the HR-1, whereas jagged plots are observed on the other instruments. The apparent smoothness also correlates with the calculated S/N, with the HR-1 at 3500, the LightCycler 2.0 at 490, the SmartCycler at 310, and the LightCycler 1.2 at 260. The double heterozygous genotype is easily identified on all instruments, with a pronounced low-temperature transition resulting from heteroduplexes. It is much more difficult to distinguish between the wild-type and mutant homozygous samples, although it appears possible with the HR-1. Distinguishing between homozygotes is more difficult with the SmartCycler and the LightCycler 2.0, and appears impossible with the LightCycler 1.2.
Normalized melting curves on four different instruments. The melting profile of each genotype is displayed in triplicate for the four instruments evaluated. The wild-type genotype is displayed in green, the mutant genotype in red, and the heterozygous genotype in blue.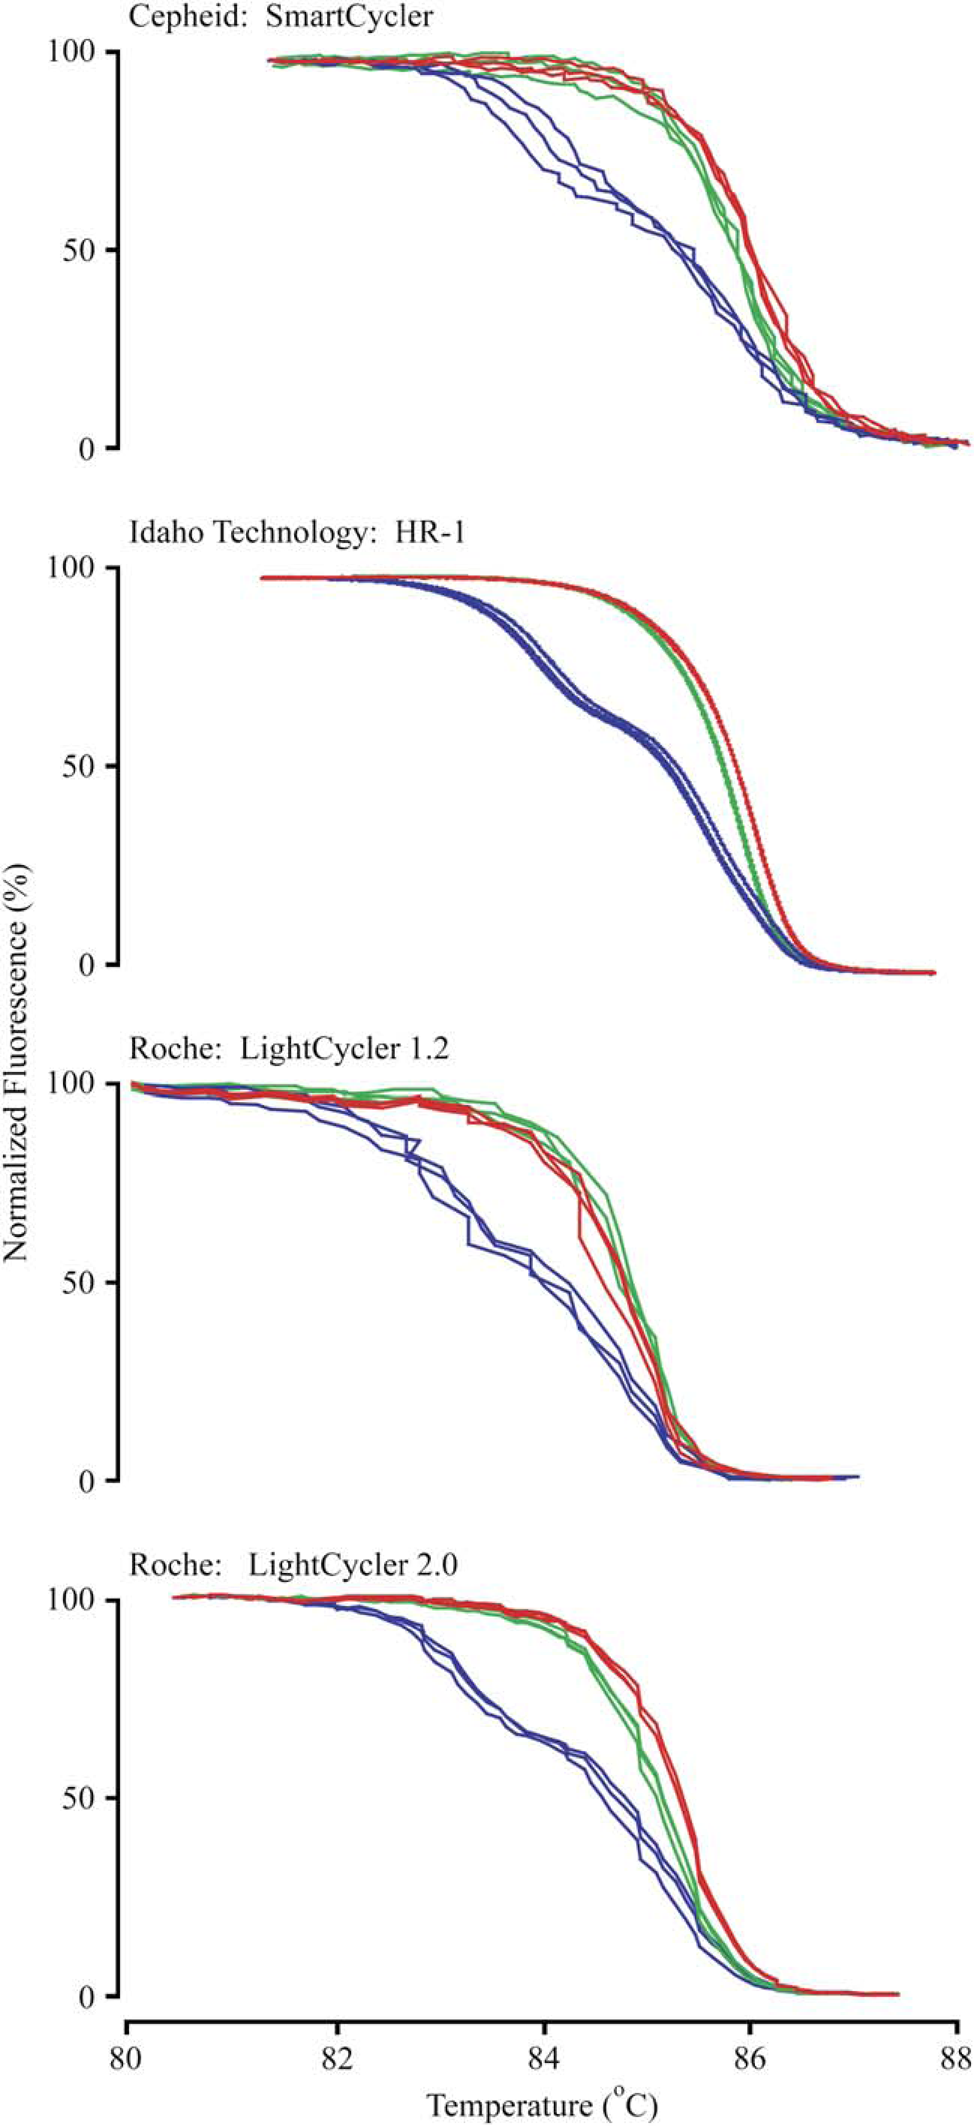
To more accurately assess the ability to differentiate homozygotes for genotyping, the Tm variation on each instrument was determined by analyzing 32 identical wild-type samples. Standard deviations varied nearly fourfold among the instruments evaluated. The HR-1 had the lowest standard deviation of 0.018°C, the LightCyclers had similar standard deviations of 0.045°C (LightCycler 1.2) and 0.047°C (LightCycler 2.0). The SmartCycler had the largest standard deviation of 0.065°C. A scatter plot of the Tm measurements on each instrument is shown in Figure 2.
Tm distribution of 32 replicates of the wild-type genotype on four different instruments. The observed scatter on each instrument correlates with the calculated standard deviations, shown below each scatter plot. The mean Tm of the LightCycler 1.2 was significantly lower than that of the other instruments (p < 1.0E–60 for each two-way comparison, heteroscedastic t test, two-tailed).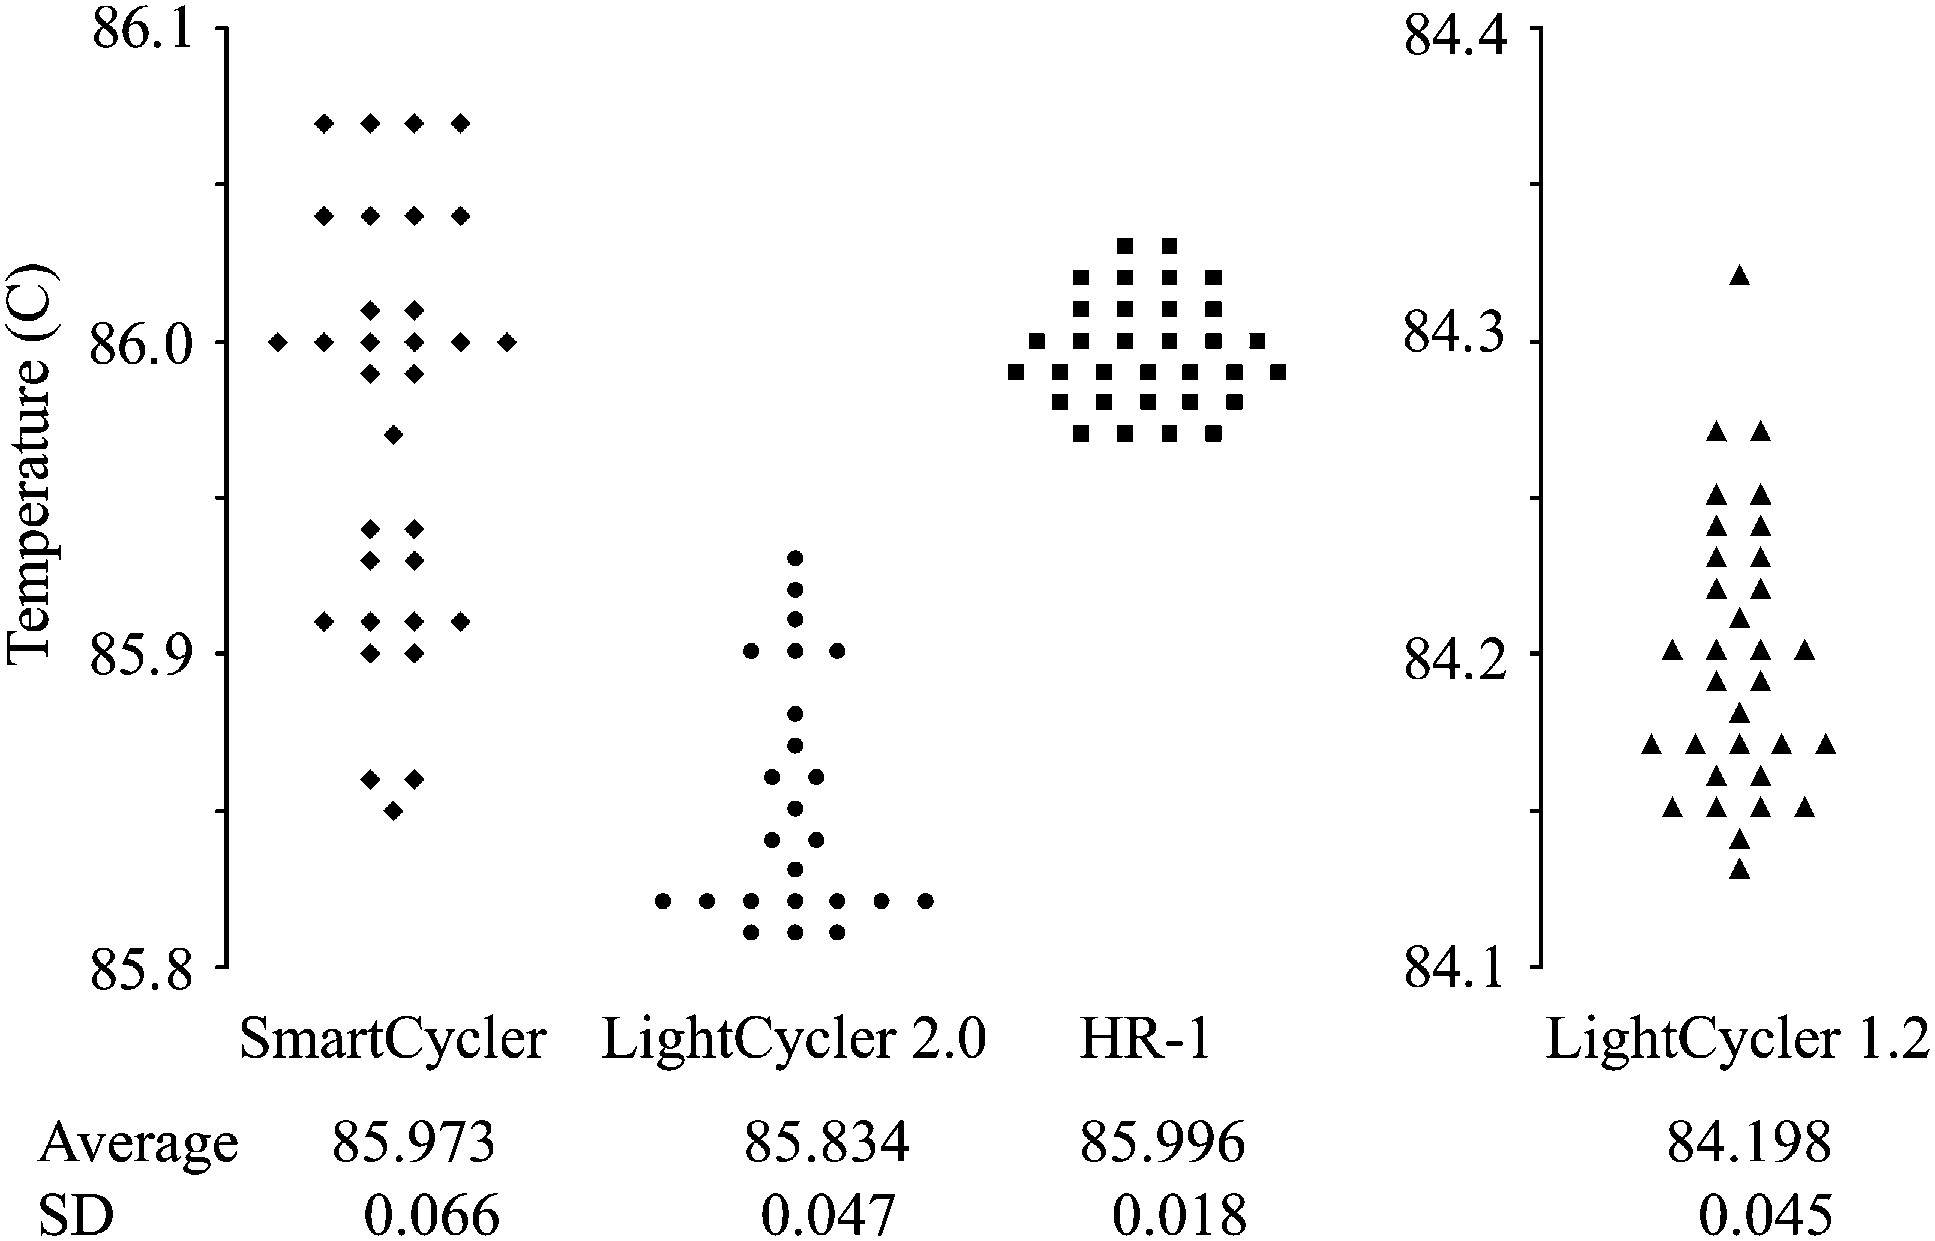
The sample area-to-volume ratio for glass capillaries used in the LightCycler 1.2 and 2.0, and the HR-1 instrument was 3.85 mm–1 for a 10 μL sample. The SA/V ratio for a 25 μL sample in the SmartCycler reaction tube was 2.51 mm–1.
Discussion
The use of DNA-binding dyes for interrogating sequence information of amplicons is controversial. Variable results have been obtained with SYBR Green I, the most commonly used dye in real-time PCR.4,6–8 More robust results are obtained with the LCGreen family of saturating DNA dyes.8,9,12,13,16 A critical aspect of genotyping by simple amplicon melting is data resolution. For example, if fluorescence is acquired every 0.5°C during melting, 4 heterozygotes may be identified by a change in shape of the melting transition, but small Tm differences between homozygotes (such as the 0.09°C difference in our current study) are not likely to be detected. Out of the four instruments evaluated here, only the HR-1 is capable of this level of performance. Obtaining high-resolution melting curves is dependent on multiple factors, including control of temperature homogeneity, temperature resolution, and fluorescence resolution.
The instruments in this study each have a unique format for temperature control and fluorescence acquisition. The SmartCycler is a single-sample thermal cycler. The reaction tube is a thin square chamber (4.3 × 4.3 × 1.3 mm) sandwiched between two ceramic thermoelectric heaters. Ambient air is passed over this sandwich for cooling. Sample excitation and fluorescence emission is captured at right angles through the 1.3 mm sides.
The HR-1 is a single-sample, melting instrument. Heating is obtained by passing current through a wire wrapped around an aluminum cylinder surrounding a 1.55 mm diameter glass capillary tube. Sample excitation and fluorescence emission is obtained paraxially by epi-illumination. The tip of the capillary is at the apex of a cone cut into the bottom of the heating cylinder.
Both LightCycler instruments are thermal cyclers handling up to 32 samples. The 1.55 mm diameter glass capillary tubes are suspended in a chamber of cycling turbulent heated air. Sample fluorescence is captured by epi-illumination through the capillary tip as in the HR-1.
Sample volume and geometry are additional factors that affect temperature homogeneity within a sample. Smaller sample volumes and increased surface area-to-volume formats facilitate accurate temperature control through rapid heat transfer and limit the formation of temperature gradients within the sample.17, 18 The sample geometries in the containers used (narrow cylinders and thin squares) have surface area-to-volume ratios greater than traditional conical-style PCR tubes (4.2 and 2.7 times greater, respectively).
Another factor influencing temperature control is the melting rate. Slower melting rates allow for improved Tm accuracy and precision because the correct temperature can be more accurately matched to the acquired fluorescence. Melting rates in this study were all set at 0.1°C/s as the lowest rate possible on all instruments. This allowed evaluation of other instrument factors that affect melting curve resolution. The melting rate of the LightCycler instruments can further be reduced to 0.05°C/s, and that of the HR-1 can be reduced an order of magnitude to 0.01°C.
Melting curve resolution also depends on the signal intensity, integration time, electronic noise, and the bit depth of analog-to-digital conversion. The superior performance of the HR-1 instrument can be partly attributed to efficient optics with 24-bit analog-to-digital conversion of both temperature and fluorescence, and a data density of 200 points per °C. The other instruments have relatively low data density. This concern is exaggerated in the LightCycler instruments when many samples are present in the carousel. The LightCycler 2.0 appears to be an improvement over the LightCycler 1.2 with better differentiation of the homozygous genotypes (Fig. 1) and higher S/N values.
The robustness of genotyping by amplicon melting depends on the instrumentation. As instruments with greater resolution are developed, this simple technique should become more and more popular as a minimalist approach to genotyping that requires no external processing, probes, real-time PCR, or allele-specific amplification.
Footnotes
Acknowledgments
The authors extend their appreciation to Maria Erali and Dr. Noriko Kusukawa for manuscript review. Aspects of melting analysis are covered by issued and pending patents owned by the University of Utah and licensed to Idaho Technology. CTW holds equity interest in Idaho Technology.