
Abstract
Recent advances in microfabrication techniques, sensing methods, and miniaturization have enabled automated analysis of samples using microfluidic systems. Each unique application requires successful custom development of integrated lab-on-a-chip devices. This involves design, analysis and characterization of individual components, (pumps, valves, mixers, separators, sensors) and the integrated system. In this regard, first-principle-based simulations of the underlying complex multiphysics phenomena can provide detailed understanding of device function. An overview of modeling and simulation-based analysis for the design and development of microfluidic devices is presented. In particular, we highlight some key factors affecting the performance of lab-on-a-chip systems such as surface tension effects, analyte dispersion, Joule heating, and mass transport limitations, and delineate the parameters that influence them. The limitations of these modeling techniques and future needs are discussed.
Need for Simulation-Based Design Analysis and Optimization
Lab-on-a-chip systems (also known as biochips, integrated microfluidic devices, biomicrosystems, bio-MEMS devices, or simply microfluidic devices/ systems) are miniaturized devices based on a combination of microfabrication technology and life sciences. They use miniaturization of biological separation and assay techniques to an extent that multiple and complex analyses can be accomplished on a “chip” small enough to fit the palm of the hand,
1
the so-called micro-total analysis systems. Tiny quantities of samples and reagents are transported through the chip's micrometer-sized channels, where they undergo separation, mixing, reaction, etc., and are subjected to analysis through application of a variety of analytical techniques. The components of a typical lab-on-a-chip can be classified into two groups based on their functionality:
Sample preparation and transport: components that deal with sample injection, dispensing, mul tiplexing, preconcentration, separation, as well as pumping and fluidic control. Sample sensing: mainly electrochemical, and optical.
All the components are usually connected via channels, or interconnects, with suitable valves to control the transport of materials (sample, buffer, cells, etc.) across various components. In addition, electrical components such as electrodes and power sources are also required if the transport and sensing are enabled via electrokinetic and electrochemical means. Interfacing with “macroworld” components is also necessary. Microfluidic devices are characterized by high surface-to-volume ratios, low throughput (small flow rates), low Reynolds number, and very high surface interactions (mass/momentum/heat fluxes). Major design challenges involve mixing of various reagents and buffers, elimination of bubbles, surface compatibility issues as related to biochemical assay design, interfacing with the macroworld, packaging and testing, and reliability.
Integrated biomicrosystems are complex devices, featuring an interplay between several components. Consequently, design techniques based purely on experiments are prone to costly delays and failure. High-fidelity multiphysics-based simulations have emerged as an alternative to design various biochip components and subsystems. These simulation tools (e.g., CFD-ACE+ from ESI-CFD Inc., Huntsville, AL, USA) are now mature enough to analyze the interactions between fluid flow, heat and mass transfer, electrokinetics, liquid filling, electrostatics, magnetics, particle transport, electrochemistry, biochemistry, and structural mechanics. The numerous benefits of multiphysics simulations include a better understanding of coupling between the various physicochemical phenomena, access to spatiotemporal information that would otherwise be experimentally unattainable, reduced need for extensive experimental testing that is often time consuming and expensive, and exploration of more design possibilities. Sections “Governing Equations” and “Simulation Methodology” present the governing equations describing fluid flow, electric field, and analyte transport. Section “Design of Microfluidic Components” analyzes commonly encountered design issues related to liquid filling and dispensing, sample transport, and dispersion. The “Conclusion” addresses the need for system-level design tools.
Governing Equations
In microfluidic devices, the transport is usually enabled via pressure-driven or electrokinetic means. Electroosmotic flow (EOF) refers to the bulk movement of an aqueous solution past a stationary solid surface due to an externally applied electric field. EOF is dominant in micrometer-sized channels due to the increased surface-volume ratio. Simulation of pressure-driven and EOF pumping mechanisms involves solving the Navier-Stokes equations along with the continuity equation. The following assumptions are also usually made (although they can be easily relaxed) in the formulation of the mathematical model for the system:
The fluid is assumed Newtonian and incompressible. Dilute electrolyte approximation is used, ie, the hydrody-namic interaction between the suspended charged particles/ions and the surface charges is accounted for only through modification of zeta potential. The electric double layer is extremely thin so that double layer relaxation and distortion are neglected (ion convection effects neglected).
The governing equations for the fluid flow are the conservation equations for mass (continuity equation, Eq. (1)) and momentum (Navier-Stokes equations, Eq. (2))
2
:


where θ is the surface coverage, ka, kd, and kir are adsorption, desorption, and irreversible adsorption coefficients, respectively, and cw, the concentration of the analyte near the reaction surface. Analyte mass flux conservation near the reaction surface is expressed as

where Ps is the surface concentration of formed complex.
Simulation Methodology
The commercial software package, CFD-ACE+ (ESI-CFD Inc., Huntsville, AL, USA), has been used to perform the simulations discussed in this paper. In this software, an implicit finite-volume technique discussed in detail by Patankar 4 is used to solve the governing equations. This involves discretization of the governing partial differential equations on a computational grid, the formation of a set of algebraic equations, and the solution of the algebraic equations. The simulation methodology requires specifying boundary conditions on the domain of interest. To study electrokinetic transport effects, usually the walls of the channel are assumed to be insulated and impermeable and the electroosmotic mobility is specified. At the inlet, volumetric flow rate of the buffer, concentration of the analyte, and applied voltage are specified. Similarly, on the outlet, while prescribing the applied voltage, the pressure is set to atmospheric value.
Design of Microfluidic Components
This section discusses some key design issues that affect the performance of a microfluidic device:
Surface tension effects play a key role in the priming of microfluidic biochips where complete filling without leaving any air bubbles in the device is necessary. Analyte dispersion can occur due to a variety of reasons depending on the mode of operation. The result will be a decrease in the peak concentration leading to a reduced separation efficiency, or in extreme cases the concentration falling below the limit of detection. Joule heating is a major concern in electrokinetic biochips. The resulting thermal gradients can induce dispersion, as well as generate secondary flows. Mass transport limitations need to be overcome to ensure efficient delivery of the analyte to the reaction surface.
For each of these design issues, we use multiphysics simulations to investigate the role of geometric conditions (channel width, depth, and shape) and process conditions (flow rates, electric field) on the biochip performance.
Liquid Filling/Dispensing Process
Liquid filling or priming is the first step in any biochemical assay protocol. This involves pushing the buffer through a series of interconnected components such as microdispensers, winding channels, valves, and multiplexers. In most applications, priming will be done as a precursor to dispensing a precise, predetermined amount of analyte, usually in pico to nanoliter volumes, contained in the buffer. The filling process critically depends on the hydrophobic or hydrophilic nature of the surface and the surface tension of the liquid-air interface with respect to the material of the system. The hydrophilic or hydrophobic nature is determined by the contact angle, which is a quantitative measure of the wetting of a solid by a liquid. It is the angle formed by the liquid at the three-phase boundary where a liquid, gas (or a second immiscible liquid), and solid intersect. For a hydrophilic surface, the contact angle θ is less than 90° and for a hydrophobic surface it is greater than 90° (Fig. 1). The following three nondimensional parameters
5
are used as guidelines in estimating the effect of various forces, such as gravity, viscous, inertia, and surface tension to optimize dispensing or filling process:
1/We = σ/(ρu2r) is the ratio of the surface tension forces relative to the momentum forces, where We is the Weber number, σ, the surface tension ρ, the liquid density, u, the velocity of the advancing liquid-air front, and r, the characteristic dimension of the system. Fr/ We = (u2/gL) (σ/ρu2r) is the ratio of the surface tension forces relative to the gravity, where Fr is the Froude number, g, the gravity, and L, the length of the liquid column. Re/ We = (ρuL/μ) (σ/ρu2r) is the ratio of the surface tension forces relative to the viscous forces, where Re is the Reynolds number.
The most important challenge in optimizing a liquid filling process is to avoid the formation and trapping of air bubbles inside the device. The success critically depends on three factors: (a) the surface property of the material, (b) geometry (avoiding sharp corners, turns, etc.), and (c) protocol (filling rates). In the case of (b), a simple geometric modification usually suffices to fix the problem, and (c) may involve extensive computational study.
Definition of a liquid droplet on a (a) hydrophilic and (b) hydrophobic material surface.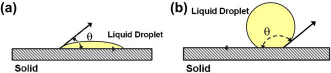
Role of Surface Effects in Filling.
Surface effects such as those of hydrophobic or hydrophilic nature play a critical role in designing a bubble-free system. Let us consider a microdispenser designed for graduated fixed-volume measurement. 6 Here, a precise volume of liquid, defined by a microfabricated reservoir, is dispensed through external means (pneumatic or pressure driven). Fluid is introduced into the reservoir via the fluidic inlet. A sequence of fluidic dispensing is simulated and the results are summarized in Figure 2. The dispenser is 300 μm long and 200 μm wide. The filling process in a hydrophilic reservoir (contact angle 60°) is shown in Fig. 2a, and that in a hydrophobic reservior (contact angle 120°) is shown in Fig. 2b and c.
As the liquid front moves through the hydrophilic system under a constant velocity of 0.5 m/s, we notice (Fig. 2a) that the reservoir fills up without the formation of any bubbles.
Effect of Flow Rate on Filling.
Figures 2b and 2c illustrate filling of a hydrophobic microdispenser under various flow rates. The liquid is pushed at a velocity of 0.5 m/s and 0.1 m/s (Figure 2b and c, respectively). The position of the liquid front (moving from left to right) clearly indicates that slower flow rate leads to bubble-free dispensing. This is because the liquid-air interface negotiates the corner effects more efficiently when it is advanced slowly due to the reduced inertial forces. Similar observations will be made in the context of liquid filling processes in various geometries.
Effect of Geometry on Filling.
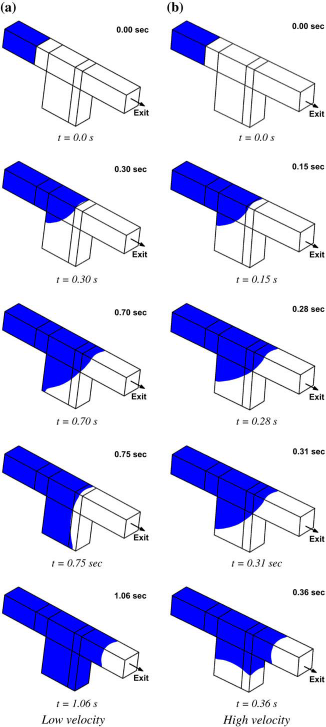
To illustrate the effect of geometry, we simulate the liquid filling in a microchannel of a 115 μm2 cross-section that has a microwell of 230 μm depth located at the bottom (see Fig. 3 for the geometry). The geometry parameters are height, width, and depth of the well, and the process parameter is the liquid flow rate. The challenge is to optimize microwell geometry so that bubble-free filling is achieved. In Figure 4a and b, the location of the liquid front (shown in blue) at various time levels is shown for a narrow well (180 μm long) at two different filling rates, 0.795 and 1.59 μL/min. In both cases, before the liquid fills up the microwell, the advancing front makes a contact with the opposite wall and traps a bubble. The inertia does not seem important in the filling process. However, when the well is made longer (230 μm long), at a flow rate of 0.795 μL/min (Fig. 5a), the advancing front continues to wet the entire microfluidic channel, scooping all the air out of the system, and leaves no bubbles. When the flow rate is doubled to 1.59 μL/ min (Fig. 5b), the inertia of the flow becomes important because it leads to the advancing front contacting the opposite wall (before touching the bottom of the well), and in the process, trapping a bubble. This illustration shows how simulations can be used in optimizing the geometry of microwells and microarrays.
Effect of surface properties on filling—blue represents liquid; gray represents air. Description of the microwell geometry.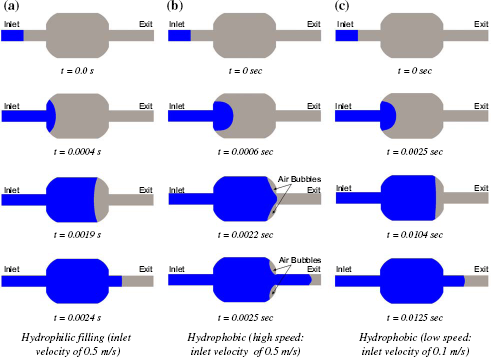

Sample Transport And Dispersion
The buffer consisting of analyte(s) of interest can be injected into a microfluidic system either continuously or discretely as plugs (referred to as sample plug). In the first scenario, mixing of analyte with other reagent buffers is of interest, and in the second scenario, understanding the dispersion of the sample plug is of significant value to chip designers. Dispersion may potentially cause a decrease in the peak concentration, leading to a reduced efficiency or a weaker signal. The sources of the dispersion are molecular diffusion, pressure (Taylor), thermal effects due to Joule heating, electromigration, interaction of biochemical species with the wall, and irregularities in the geometry. 8
Dispersion In Pressure-Driven Flows.
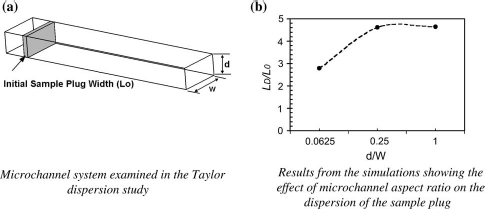
The Reynolds number in a typical microfluidic system is usually very low (often less than one), meaning that the flow always stays laminar. A parabolic velocity profile is typical of such systems. This means that the liquid at the center of the channel will move faster than that near the wall. Suppose that, somewhere inside the channel, a sample plug containing analytes of interest is introduced; the flow field will cause the plug to disperse in both axial and radial directions, thus broadening the plug. Sample dispersion due to the velocity profile (Taylor dispersion) has been well documented in the literature. This effect strongly depends upon the aspect ratio of the channel. A simulation-based analysis of Taylor dispersion in channels with different aspect ratios is shown in Figure 6b, where the ratio of the length of the dispersed sample plug (LD) to that of the initial length (L0) is shown at different aspect ratios (d/w). Here d is the depth of the channel and w is the width of the channel (see Fig. 6a). In all the simulations, the channel cross-sectional area is kept constant. The analyte profiles were measured at the same position downstream. The simulations predict that the maximum dispersion occurs at the aspect ratio of one; this has been confirmed in literature via experiments.
9
As the aspect ratio is reduced, the velocity profile becomes flatter from the original parabolic profile leading to reduced cross-diffusion. Hence, it is prudent to have the aspect ratio significantly less than one (thin wide channels) to minimize dispersion in pressure-driven microfluidic systems.
Filling in a narrower microwell. Filling in a wider microwell.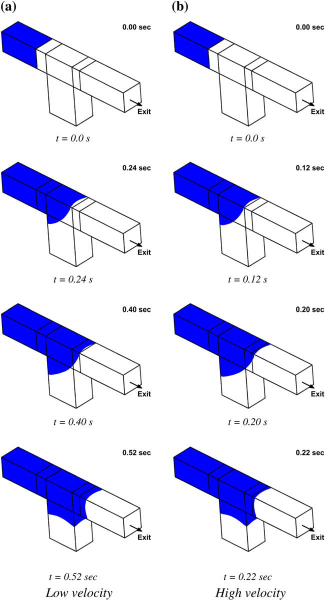
Electrokinetic Dispersion.
Capillary electrophoretic (CE) devices have been successfully fabricated on microchips for biological/chemical separation applications. Microchip implementation of these devices has the advantages of compact size, integrated functions of separation and detection, low cost due to batch production, and potential use for parallel analysis. Electroosmosis and electrophoresis are two physical phenomena that occur in fluids containing ions under the influence of external electrical field. This requires the existence of a charged double layer that forms near the surfaces of commonly used materials, such as silicon, glass, polymers, etc., when they are brought in contact with a polar medium. The EOF produces a flat velocity profile across the channel. Hence, modifying the surface charges 10 or varying the electric field (e.g., applying an electric field perpendicular to the wall, 11 transverse electrokinetic effects 12 ) will result in EOF variations, which could be optimally manipulated for enhanced transport processes as well as analyte mixing. Electrophoresis, on the other hand, does not produce bulk motion, but moves charged species in the buffer solution under the action of an applied electric field. Velocity of the specie depends on the electrophoretic mobility and local electric field.
Even though the induced velocity is uniform across the channel cross-section, sample dispersion can still be induced due to the geometry. A nonuniform electric field occurs primarily due to the curvature in the channel geometry. This will cause the different regions of the sample to migrate at different velocities.13,14 In Figure 7, we present the results from the simulation of dispersion in an S-shaped channel. It is 25 μm wide; bends have an outside diameter of 300 μm, and straight channels are 500 μm long. An electric potential of 15 V is applied at the inlet and grounded at the exit. An electro-osmotic mobility of 10−8 m2/V-s is used. The shape of the sample plug at different time levels is shown in Figure 7. As the sample plug moves through the channel, higher current density along the inner wall of the bend causes the inner region of the band to move faster than the outer region (racetrack effect). This results in an asymmetric profile and eventually causes band broadening (Fig. 7e). As the sample continues its journey, more band broadening occurs. As it completes the journey around the first bend, the sample shape becomes that of a highly distorted parallelogram (Fig. 7g). This has been observed in experiments and reported in the literature. 15 As the plug continues its journey through the second bend, the outer region of the sample in the first bend becomes the inner region and, hence, is accelerated due to a higher electric field. Thus, the distorted sample shape is corrected, to some extent, by letting the sample go through another bend of equal and opposite curvature (Fig. 7i).
To summarize, the channel geometry plays a critical role in controliing dispersion of the sample plug, in both pressure-driven and electroosmotic flows. If external pressure is used to transport the plug (e.g., syringe pump), care should be taken while selecting the channel cross-section dimensions. A shallower channel (cross-section aspect ratio greater than one), which is preferred, results in less distortion of the sample plug because of the flat velocity profile. Channels with sharp turns should be avoided as much as possible while designing a microfluidic network.
Joule Heating And Electrothermal Effects
Application of electric field results in Joule heating. The amount of heat generated is proportional to the electric field (
Taylor dispersion: effect of channel aspect ratio on dispersion.
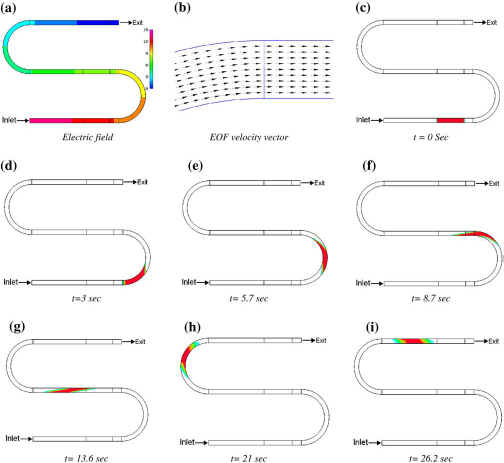
Flow of a sample plug in an S-shaped microchannel: the shape of the plug is shown at different time levels.
Mass Transport Limitations In Bioanalytical Systems
Integrated microfluidic devices are currently being intensively investigated for drug screening as well as biosensing or diagnostic applications involving biochemical or electrochemical assays. Present day gold-standard protocols primarily use static incubation in microwell formats in a lab automation environment. The growing need for long-term, multianalyte measurements as part of high-content screening motivates the use of microfluidics, especially for cell-based assays. In this context, an assay optimized in a 96, 384 or 1536-well microtiter plate system may not yield expected results in a microfluidic, flow-through environment. This is due to the fact that the assay extent is determined through a delicate balance of intrinsic kinetics and rate of convective-diffusive transport to the sensing surface. In contrast with the microwell plate, wherein the target molecules are transported to the probe surface only via molecular diffusion, in microfluidic implementations, the target is transported to the near-surface environment by lateral flow as well. This increased transport into the vicinity of the probe layer can often favorably impact assay speed and sensitivity. The strength of convective transport (as compared with molecular diffusion) is assessed via the Peclet Number (Pe = uL/ D). Value substantially less than unity indicates a diffusion-dominated static system whereas values largely exceeding unity indicate that convective effects are important.
The nondimensional parameter, “Damkholer Number” (Da), is widely used to classify sensing assays based on the kinetic and transport rates. It is defined as the ratio of the characteristic time scale associated with diffusion (static systems) or convection (dynamic system) compared with that of the biochemical reaction. It is mathematically defined as:
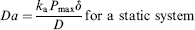
When reaction kinetics is slow (DNA hybridization > 50 bases for instance) compared to effective transport rates (Da < < 1) the system is categorized as kinetically limited. Instances where the intrinsic reaction kinetics is fast (bio-tin-avidin mediated events, high affinity antigen-antibody recognition), compared with transport rates (Da > > 1) are termed as mass transport limited. Based on the above two parameters, it is readily seen that the overall speed and sensitivity of the assay will depend both on the biochemical nature as well as device design and flow protocols.
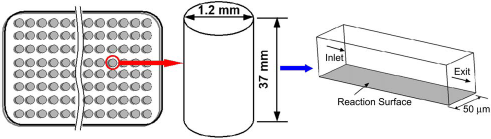
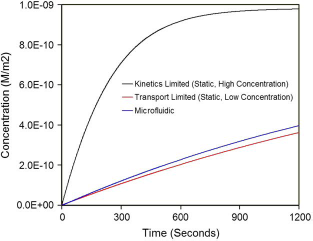
To illustrate the importance of these considerations when migrating from a microwell (static) format to a microfluidic (dynamic) format, we present the following idealized situation. We consider a microwell of 37 mm height and 1.20 mm inner diameter as part of a candidate microwell system (Fig. 9). A monoclonal antibody (mAb) patch specific to green fluorescent protein (GFP) is immobilized at the bottom of the well at a surface concentration of 10−9 moles/m2. We consider three different scenarios. In the first case, the GFP is introduced into the microwell at 0.01 μM concentration. In the second case, the concentration is reduced by an order of magnitude (0.001 μM). In the third case, the GFP of reduced concentration is introduced into a flow-through microfluidic channel (Fig. 9b) of 50 μm square cross-section at 5.18 μL/min (equivalent to the sample volume in the microwell flow over a period of 15min). The simulations use an association (on) rate constant of 5 × 10⁵ M−1s−1 and dissociation rate constant of 0.0001 s−1 Figure 10 summarizes the results from a model of the assay, where the surface concentrations of the bound GFP-mAb complex are shown as a function of time. In the first case, the surface concentration of GFP-mAb complex almost approaches the maximum concentration of immobilized mAb (theoretical maximum) in less than 10 min. However, when the concentration of GFP is reduced by an order of magnitude, the delivery of GFP to the reaction surface is not sufficient to catch up with the loss of GFP near the wall via binding with mAb. However, when the system is incorporated into a microfluidic format, the binding efficiency goes up by 10%. This is directly attributed to the enhancement of the transport rates by the presence of convective effects (i.e., non-zero Peclet Number). Further optimization of the geometry and protocol may be performed to demonstrate the value, in increasing assay speed, of migrating from a microwell to a flow-through microfluidic format. In addition, calculations (or simulations) can provide insights for rational extension of microfluidic platforms developed for one assay/application to other applications. Furthermore, these approaches have been extended and used to investigate assay sensitivities in the presence of competing or inhibitory agents.
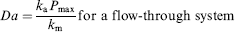
Electrothermal flow in a square cavity of 500 μm cross-section.
In addition to the beneficial effect of enhanced transport, counteracting effects also exist. The flow-through nature of microfluidic systems limits the residence time of the target in the vicinity of the probe (unless flow and stop protocols are used). This may impact the extent of completion of poorly implemented microfluidic assays. Sample dispersion into the transporting buffer is another consideration, as has been discussed earlier. In conclusion, the above discussion highlights the significance of considering the transport and biochemical assay elements together. Designs, using idealized representations of transport, may lead to suboptimal assay yields.
Schematic of microwell and microfluidic geometry used in the study on migrating biochemical assays from a microwell to microfluidic format.
Comparison of performance of a biochemical assay when migrating from microwell to microfluidic format.
These considerations are particularly important as microfluidics is beginning to make an impact on screening during drug discovery and clinical applications involving quantitative study of biomarkers. With the increasing thrust to reduce reagent consumption increase speed and sensitivity with ever greater automation, assay development scientists and engineers will do well to be mindful of the highlighted trade-offs and pitfalls. Given the complex and counterintuitive nature of these phenomena, use of high-fidelity multi-physics simulation software will greatly minimize the risk of a flawed microfluidic design impacting assay performance in a deleterious fashion. While this paper deals with microfluidic biochemical assays based on immobilized receptor species (such as an enzyme or antigen), the same approach can also be used to analyze nonspecific protein binding in microfluidic systems. 20 The very small concentrations of proteins make this is a serious problem, especially in miniaturized microfluidic systems, 21 where a loss of sample can significantly affect device performance.
Conclusions
This paper demonstrates the appilcation of multiphysics simulations in analyzing the role of geometric and process conditions on liquid filling, sample dispersion, Joule heating, and biochemical assays in lab-on-a-chip systems. This methodology has emerged as a promising complement to design approaches based on experiments alone. Together with advances in techniques for rapid prototyping of microfabricated devices,22,23 these methods have improved the design process by providing accurate estimates of chip performance. In addition, they allow coupled analysis of underlying physicochemical phenomena and provide detailed information regarding spatiotemporal variations of the field variables. The benefits of using simulation-based analysis include better understanding of the mechanics of complex biochip systems, the ability to obtain experimentally inaccessible information, reduced need for extensive experimental testing that could be time consuming and expensive, and opportunities to explore more design possibilities.
Footnotes
Acknowledgements
The authors wish to acknowledge funding from several agencies including DARPA, US Department of Defense, NIH, NIST, and NASA, and support from colleagues at the Biomedical Technology Branch, CFD Research Corporation, Huntsville, AL, USA.