
Abstract
Cell-based assays for identification of biologically active small molecules from chemical libraries are becoming increasingly popular for HTS aimed at a variety of drug targets. Functional assays require good coordination between several independent processes during the run. This article describes our custom designed, fully automated Thermo LAS robotic system with integrated FLIPRTETRA and several additional peripheral elements such as a BioTek ELX washer unit, a PE Evolution pipettor, and PE FlexDrop dispenser. The Thermo LAS robotic control software, Polara, ensures that each and every plate of sensitive cells in a large batch experiences the same procedure as an individual plate assayed in the hands of a scientist. Such robotic systems can process hundreds of plates a day and require large-scale automated support for cell preparation. The TAP SelecT is an automated robotic system that can plate 100– 300 plates of cells per day with defined accuracy and precision. In addition to plating cells, SelecT can also pass and expand cell lines. Here, we present a case study of a GPCR-mediated Ca-flux assay, where this robotic team enables high-throughput logistics even for an extremely sensitive cell-based assay.
Introduction
Our experience with multiple cell-based assays in screening suggests that the success of cell-based assays is largely determined by the biological status of the cells. Some assays are intrinsically more noisy simply because the biology of the cellular response is very sensitive to the general health of the cells. Other assays are tuned to detect subtle effects around critical inflection points in the targeted intercellular response, which also results in an increased sensitivity to the exact state of the cell. Both observations justify capital investment to enhance HTS capabilities by automating cell culture support and integrating high-performance readers into a fully automated process.
GPCRs and ion channels are very popular targets in research for new drug candidates. Measurement of rapid biological responses in cells using fluorescent dyes requires fluorescent plate readers equipped with liquid-handling automation. The Molecular Devices FLIPR (fluorometric imaging plate reader) enables the addition of liquid and subsequent kinetic monitoring of changes in fluorescence simultaneously in every well on a microtiter plate.1,3,4 Customer modifications of the FLIPR-384 into 1536-well format 2 demonstrated the feasibility and advantages of miniaturization of the intracellular calcium assay. MDC recently implemented a new design for simultaneous 1536 liquid transfers in the FLIPRTETRA.
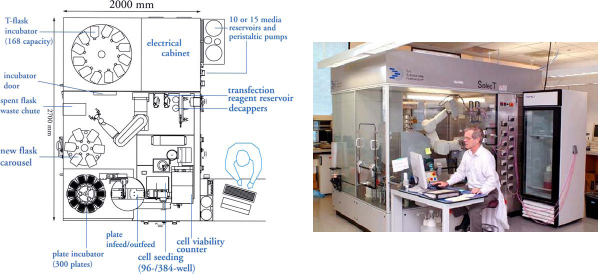
TAP SelecT. Schematic diagram and picture of automated cell culture system (TAP SelecT). It has incubator for 182 flasks T-175 cm2 Incubator for 420 microtiter plates; cell counter Cedex; carousel for empty flasks; noncontact multiformat cell dispenser TAP MFCD dispenser; pipette holder; and articulating robotic arm to move flasks and pipettor.
The TAP SelecT is an automated robotic system that can plate up to 300 plates of cells per day. In addition, it can also pass and expand different adherent cell lines. Automation of the cell culture process increases efficiency of scheduling HTS campaigns by eliminating the need to arrange for weekend shifts to prepare cells for weekday screening.
A high-speed distributed motion robotic system from Thermo Laboratory Automation Systems (LAS) was designed according to specifications provided by Wyeth Screening Sciences. This system not only increased through-put and efficiency of the daily process during the screening campaign, but also ensured a consistently timed treatment of each plate in each batch. An example of a very fragile and sensitive Ca-flux assay that has been successfully implemented in HTS with this new robot team is described in this article.
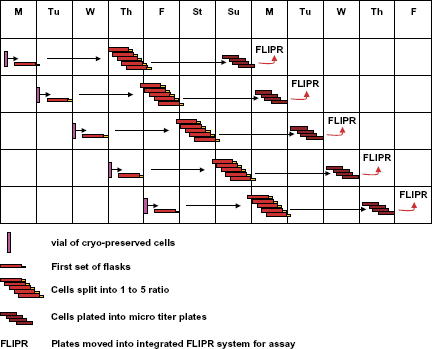
Flow chart for TAP SelecT. Schedule for handling cells, in SelecT cell culture automated system to support 5 day/week HTS campaign. One vial of cells is thawed every day 5 days a week, and seeded into eight T-175 cm2 flasks. In 3 days, those flasks are split into one to five by SelecT, yielding a total of 40 flasks. Those flasks are scheduled for trypsinization in 3 days. Trypsinized cells are pooled together from five flasks, counted by Cedex, and plated into 15 plates with a density of 20,000 cells per well. SelecT executes several different tasks daily and can operate unattended on weekends.
Materials and Methods
Instrumentation
TAP SelecT.
The Tap SelecT automated cell culture system (Fig. 1) has a capacity of 182 T-175 cm2 flasks. In the example shown, cells harvested from five flasks were pooled together, counted, and plated. Cedex flow cytometer is used to determine density and viability of harvested cells based on trypan blue exclusion. SelecT will support a well-defined protocol of cell culture and plating with uniform precision and consistent conditions for all flasks and plates produced during the multiple weeks of a screening campaign. The flow chart (Fig. 2) illustrates the schedule for handling vials with cryopreserved cells, tissue culture flasks, and finally assay plates 7 days a week, including unattended operations on weekends, to support 5 days a week of screening. The incubator racks of plated cells produced by the SelecT are interchangeable with incubator racks used on the Thermo LAS robotic assay systems and are quickly transferred in a manual operation on the day of use.
Thermo LAS Robotic System with Dual FLIPRTETRA.
Thermo LAS Integration of Dual FLIPR
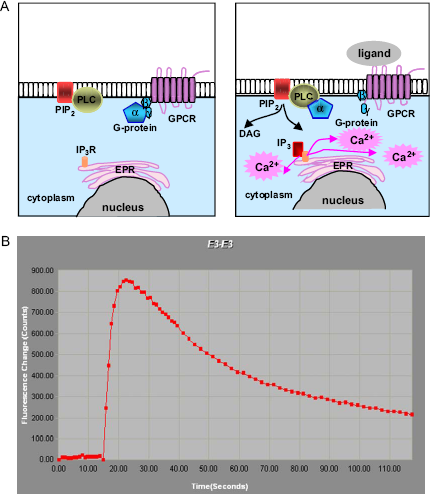
GPCR-induced Ca-flux detection assay. (A) Schematic illustration of GRCR-induced changes in the concentration of intracellular Ca2+. Ligand-dependent activation of G-protein coupled receptors triggers a cascade of events: translocation of the alpha subunit of G-pro-tein to phospholipase C; activated PLC converts phosphatidylinositol bisphosphate (PIP2) into diacylglycerol (DAG) and inositol triphosphate (IP3); free cytoplasmic IP3 binds to the IP3-gated Ca-channels in the endoplasmic reticulum membrane; and Ca2+ enters the cytosol. The dephosphorylation of IP3 and pumping of cytosolic Ca2+ out of the cell rapidly terminate the response. (B) Trace of the signal detected in one we II by FLIPRTETRA. The increase in the cytosolic Ca2+ could be detected using calcium-sensitive dyes (as Fluo-4 and its derivatives) loaded into cells in the nondisruptive manner. FLIPR detects the increase in fluorescence quantum yield upon binding of calcium to dye.
Polara. Polara is the Thermo LAS scheduling and control software. The Polara scheduler optimizes the timing of each individual step to maximize overall throughput and uniformity of parallel plate processing. To develop a schedule that has consistent timing for each plate in the run, the stagger time between samples is adjusted so that the standard deviation of the total run time to process each sample is minimized. Typical limit of sample time deviations was about 10 s or less. Polara also controls runtime communication for all elements of the automated system during assay (Fig. 5). It faciliates conversion of a multistep protocol into a detailed schedule for each plate of a 100-plate batch.
Cell Culture Protocols.
Manual Cell Culture. Gq-protein coupled receptor overexpressed in CHO-Dux cell line was used for Ca-flux assay (provided by Dr. R. Ring, Wyeth Research, US). Cells were continuously cultured in DMFM (GIBCO), 10% dialyzed FBS (HiClone), 1% nonessential amino acids (Cellgro), and 1% penicillin/streptomycin (Cellgro) in 37 °C 5% CO2 incubators. Then 95% confluent cells were dissociated from the flask with 0.05% trypsin/ FDTA (Cellgro) and suspended at 5 × F5 cells/ml. Cells were plated in 384-well plates (BD/Falcon) at a density of 20,000 cells per well and incubated for 12-16 h in 37 °C incubator with 5% CO2 prior to assay.
Automated Cell Culture with TAP Select. As described in legend to Fig. 2, a vial of 6 × 10⁷ cryopreserved cells was rapidly thawed in a 37 °C water bath and resuspended in DMFM (GIBCO) supplemented with 10% dialyzed FBS (HiClone), 1% no-essential amino acids (Cellgro), and 1% penicillin/ streptomycin (Cellgro). Cells were washed in the culturing media and resuspended in 40 ml. A total of eight T-175 flasks were seeded and imported into the SelecT system. Flasks were incubated in SelecT for 3 days, split 1-5, and returned for 3 more days of incubation. Cells were grown to 90-95% confluence. Cells harvested from five flasks were pooled together by the SelecT, counted in Cedex, and plated by multifunctional cell dispenser (MFCD) at a density of 20,000 cells per well into 384-well plates (BD/Falcon). Up to 120 plates were plated per day. In 12-16 h, racks with plates were moved from SelecT plate-incubator into Stericult (Forma scientific) incubator integrated in the Thermo LAS/FLIPRTETRA system.
FLIPR-based Ca-flux Detection Assay.
Assay Protocol to Validate FLIPRTETRA. Ca-3 dye kit (MDC, Sunnyvale, CA) was used to detect changes in intracellular Ca2+ upon ligand activation of the Gq-coupled receptor (Fig. 3). CHO-Kl cell line with recombinant muscarinic receptor 1 was generously provided by Julia Heinrich (Wyeth Research, US) and used for the validation of new FLIPRTETRA by comparison to traditional FLIPR-3. A general description of the FLIPR assay has been previously published. 3 For the validation experiments, 14,000 cells were plated in DMFM medium, supplemented with 10% dialyzed FBS (HiClone), 1% nonessential amino acids (Cellgro), and 1% penicillin/streptomycin (Cellgro) into the wells of 384 clear bottom black plates (Falcon, BD) 18-20 h before assay. On the day of assay, Packard PlateTrak aspirated media from the wells and dispensed 50 ul of diluted Ca-3 dye. One vial of express kit reagent was dissolved in 500 ml of HBSS buffer supplemented with 10 mM Hepes, pH 7.5, and 2.5 mM Probenecid. Probenecid was used to suppress pumping of the dye out from the cytosol. It was made fresh as a 500 mM stock solution in 1 N NaOH. Cells were incubated with the dye for 60 min at 37 °C in 5% CO2.
Ml receptor dose-response to acetylcholine was used to validate FLIPRTETRA by comparison of results to FLIPR-3. Data were exported as Max—Min value of change in raw fluorescent units. Fold induction was calculated as value of Max—Min for sample wells normalized to the average value of background signal in buffer-treated wells on the same plate (N = 24). The EC50 calculated using Graph Pad Prizm Project was similar across the two platforms and equal to 60 nM.
Protocol 1. Fluorescence Measurements Using Stacker-based FLIPR-3. One vial of Ca-3 express kit was dissolved in 500 ml of HBSS buffer supplemented with 10 mM Hepes, pH 7.5, and 2.5 mM Probenecid. Probenecid was made fresh as a 500 mM stock solution in 1 N NaOH. PlateTrak (Pakard/Perkin-Elmer) was used to remove media from wells and to dispense 50 ul of dye solution into the assay plate.
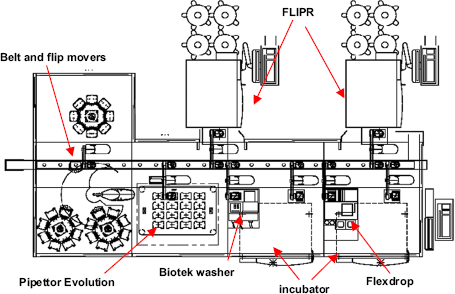
Fully automated Thermo LAS system with dual FLIPRTETRA. A centrally located, high-speed movable belt (the LPT or linear plate transport) moves plates from one part of the system to another; one vertical array loader (VAL), an articulated robotic arm, moves compound source plates from the two plate carousels (320-plate capacity each) to the LPT; eight Flip Mover robotic arms move plates from the LPT to peripheral instruments; two random access Stericult incubators (147-plate capacity) with plate elevators; one Biotek Plate Washer Elx 405; one Perkin-Elmer Flexdrop IV noncontact dispenser; one Perkin-Elmer Evolution EP3 pipettor; one eight-station lidder; one carousel with lidder/delidder; and two MDC FLIPRTETRA plate readers.
Plates were moved as a batch of 15 into at 37 °C in 5% CO2 incubator and incubated for 60 min. Plates were moved as a batch of five to 10 to cool down to room temperature and placed into stacker on FLIPR-3 for the measurement of Ca-redistribution response. Ligand solution (12 ul) was dispensed to 50 ul of dye in the assay well to activate Gq-cou-pled receptor. Data were treated as described previously.
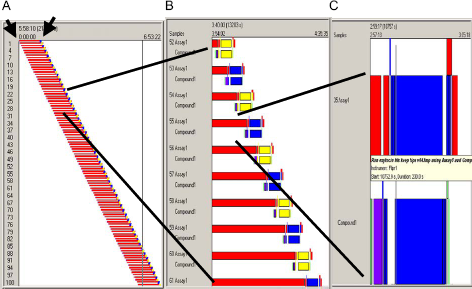
Polara Scheduler (Thermo LAS). Screenshots of the schedule protocol for 100 plates in the agonist assay. (A) An overview of the schedule for 100 plates. Each bar represents all the steps in moving single plate to and from different locations included in the automated system. (B) Magnified view of detailed schedules for 10 plates. Each red bar is a step of incubation in Forma Scientific Stericult incubator for each assay plate. (Blue and yellow) Boxes reflect alternating use of two FLIPRs. (C) Further magnified view of the end part of one assay and one compound plates schedule.
Protocol 2. Fluorescence Measurements Using Thermo/ CRS Integrated FLIPR. Cell plates prepared in SelecT (TAP, UK) were moved in racks into Stericult incubators (147-plate capacity). Schedule was developed for each plate with consistent timing step in the protocol. Each cell plate was moved up by plate elevators and placed onto LPT to be delivered into the Perkin-Elmer Flexdrop IV. Dye (60 ul) was diluted as described previously and dispensed into wells of the cell plate without media removal. The cell plate was then moved by flip mover back onto LTP to be delivered into the incubator. After 60 min of incubation with dye, cell plate was again lifted up onto LTP to be delivered to one of the FLIPR readers. At that time, a compound plate was moved from plate carousels to Perkin-Elmer Flexdrop IV. Compound was diluted with the assay buffer to the requested intermediate concentration, and the compound plate was moved on LTP to a FLIPR where it is incubated together with a cell plate.
We have used an advantage of FLIPRTETRA to successfully transfer smaller volumes of the ligand solution from the source plate into assay plate. Compound (4 ul) was dispensed into 80 ul in the assay well. To ensure better diffusion of the agonist, the pipettor was programmed to aspirate 10 ul more of the dye/media mixture from the assay well immediately after aspirating the agonist. Then, tips dispensed 19 ul of the mixture back into the assay well. This modification of the protocol had the following advantage: more efficient mixing effect was achieved in the assay well with less distortion of the cell layer than the traditional FLIPR mixture program.
Results and Discussions
Cell Culture Supply Logistics
Development of new targets for small molecule therapeutics using more complex, functional, cell-based assays is impeded by the increased sensitivity of the assays to the conditions of cell growth and handling.
The logistics of cell supply must become very reliable. A consistent cellular response must be maintained throughout campaigns that typically last 3-4 months. The increasing throughput requires batch runs of up to 200 384-well plates of cells per day. Finally, the cell supply should be sufficiently flexible to accommodate variations in HTS schedules, efficiently matching cell production to cell usage. The most convenient and reliable approach to uncoupling the screening process from daily cell culture routines is the daily use of individual aliquots of cells from a single bulk lot of cryopreserved cells. Several types of cell-based assays were adjusted to use cryopreserved cells directly in the assay (Fig. 6A). However, in some cases, the biological properties of the cryopreserved cells did not sustain the delicate conditions required to support the biological process of interest. Analysis of screening campaigns performed during several recent years revealed that there are some assays that are very sensitive to the conditions and state of the cells (Fig. 6B). A majority of those assays have a FLIPR-based format. This sensitivity requires keeping cells under optimal culture conditions for several days prior to plating into microtiter plates for assay. The requirement of continuous cell culture adds an extra variability to the assay by introducing two additional parameters: the culture interval and the specifics of the culture conditions. Figure 7 shows the FLIPR-3 traces for a Ca-flux assay under two different culture conditions of a CHO-Dux based cell line: in suspension and adherent to the flasks. The best results were achieved when the cell culture conditions matched the conditions used in the assay, that is, adherent cell monolayer. Growth rate, cell density, and passage history are only some of those variables that should be accounted for during the design of the culture strategy. The multiple individual aliquots of a single large frozen cell stock were used as seeds to start multiple, parallel cell cultures. This approach enables the harvest of identical cell batches with exactly the same passage history throughout the course of a screening campaign. The use of SelecT to support this strategy ensures uniform cell handling despite weekend and late night schedule. An example of this strategic design is described in the Materials and Methods section and illustrated in Figure 2. It helped to support an HTS campaign over 28 days with highly consistent batches of plated cells.
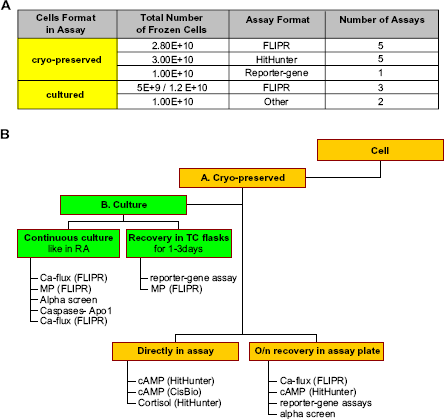
Decision tree. (A) Two different strategies for source of cells in HTS campaigns. Summary of several HTS campaigns done with cryopreserved or continuously cultured cells. (B) The decision chart. If cryopreserved cells (A) cannot be used directly in assay, then alternative paths (B) are evaluated. One option is to plate cryopreserved cells into culture flasks for recovery for a few days before plating into microtiter plates for assay. Another alternative is to seed a smaller number of cryopreserved cells and to carry them in culture for an appropriate length of time to achieve the cell number required for daily HTS campaign.
Continuous cell culture requires a lot of time, material, and resources even when supported by the automated TAP Select. The daily processing capacity of the Select robotic arm exceeds the carrying capacity of the onboard incubators so that the most efficient use of the overall system requires additional incubators for transient incubation of flasks between process steps. A second incubator in the SelecT can carry 420 plates. This is another limiting factor for daily operation, and the best practice is to move cell plates from the incubator to the point of use as soon after plating as possible.
The results-driven planning and decision-making guide (Fig. 6B) is used to predict the appropriate cell-source for each upcoming screen enabling efficient use of cell culture resources for HTS.
Ca-flux Detection Assay
New FLIPR TETRA .
We used a well-characterized Ca-flux detection assay to compare the results obtained on FLIPRTETRA with those obtained on our standard FLIPR-3 platforms. The changes in the intracellular calcium were induced by activation of muscarinic receptor 1 subcloned in the CHO-K cell line. The protocols for both platforms were developed to be as similar to each other as possible so the difference in results would be attributed exclusively to the difference in performance of the two readers (see Materials and Methods). The plate view of
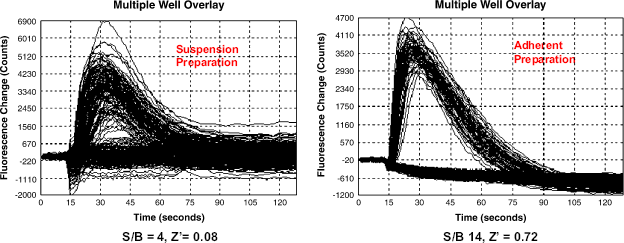
Cell culture conditions. Overlay of FLIPR-3 traces from multiple wells on a 384-well plate. Cells for agonist Ca-flux assay were cultured as suspension (A) or in adherent monolayer (B), harvested, cryopreserved, and used in experiments. Cells grown as suspension show less activation by reference agonist. Signal to background ratio is only four-fold with very high level of noise (Z‘ =0.08; N well-s = 192). However, the same cell line expanded as adherent monolayer and plated in the same assay shows signal to background ratio about 14-fold and very small deviation, Z‘ =0.72; N wells = 192.
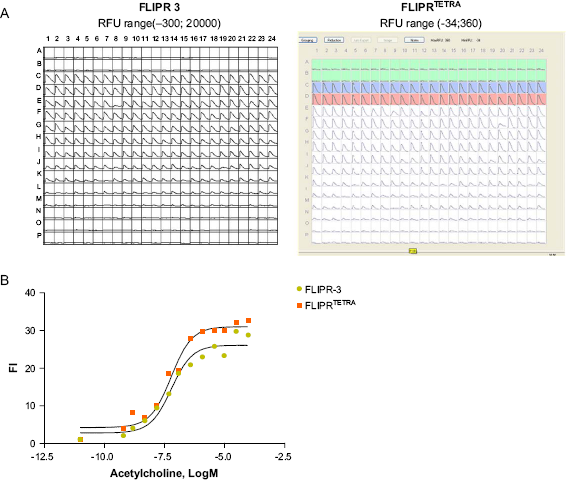
Comparison of FLIPR-3 and FLIPRTETRA. (A) Plate view of the traces from FLIPR-3 and FLIPRTETRA. Acetylcholine was titered with two-fold step dilution from row C down to row N. The range of raw fluorescent unit response is different for the two readers but can be normalized by calculating the ratio of signal to background, shown below. (B) Results of the dose-response to acetylcholine calculated as Fl of the Max—Min raw fluorescent units of treated wells over that of control wells. EC50 for acetylcholine was 60 nM for both curves.
The FLIPRTETRA produced comparable results to the FLIPR-3. However, it has reduced footprint and support requirements because there is no laser and laser cooling system. The good performance and rich feature set of FLIPRTETRA made it a model of our choice for integration with LAS robotic system. It can be conveniently rolled away from the automated platform for service or used in the manual mode for assay development and validation.
The Advantage of the Thermo LAS Automated System as Compared to Batch Treatment of Plates.
Analysis of Stacker-based Batch Treatment of Multiple Cell Plates. Assay plates with cells were taken from the incubator. Those plates were dye loaded as described in the Materials and Methods section for the FLIPR-3 protocol. Two parallel experiments were carried out to address potential artifacts caused by batch treatment. In the first experiment, the plates were taken out as a batch of five plates. In the second parallel experiment, the plates were taken from the incubator one at a time for assay. It was essential to cool down the plates to room temperature for 10 min to ensure a consistent sample temperature in all plates before placing them in the FLIPR-3. It is important to emphasize that when the plates were treated as a batch only the first plate was placed into the reader without a delay, in the same interval as the individually treated plate. The second plate from the batch experienced a 4-min delay. This delay accumulates for sequential plates, so the 10th plate in the stacker receives agonist with a delay of 44 min compared to the first plate. The scheme of this process is illustrated in Figure 9A. During this delay, the cells are exposed to room temperature conditions, which may affect the response to the activator. Indeed, as depicted in Figure 10A, the cellular response was very sensitive to the extra exposure to ambient conditions. The induction of Ca-flux promoted by agonist was dramatically reduced in each consecutive plate in the stacker. However, the plates from the parallel experiment, which were placed into the FLIPR-3 individually, demonstrated a consistent level of induction. The extra exposure to room temperature in the stacker-based protocol also affected the variability of the signal. The Z‘ factor, which reflects the statistical validity of the assay, was acceptable for the individually treated plates, but was dramatically reduced for each consecutive plate in the stacker (Fig. 10B).
The Thermo LAS Automation System. The Thermo LAS automation system was designed with the major goal of treating each plate individually, and scheduling every plate to be treated identically. The ideal scheme will be similar to the work that is usually done with a single plate in a manual protocol and is visualized in Figure 9A.
The stagger time between samples in the Polara protocol was adjusted so that the standard deviation of the total run time for each sample was minimized and did not exceed 10 s. Each red bar represents the schedule of all events for a single plate or the timeline for each plate. Part A is an overview of the schedule for 100 plates in the assay protocol for the CRS-automated FLIPR system described in Materials and Methods. The delays or discrepancies in the treatment of each plate would be reflected as disruptions in the stagger of the plate timelines. The similarity between the schematic model of manual single plate processing and schedule of the current protocol calculated by Polara (Fig. 4) reflects the success of this attempt. The robust induction of signal in the CRS-automated system is illustrated in Figure 11. The agonist response to the control ligand on each plate (high signal) was consistent for five consecutive plates. The tight clustering of the values for the high signal from well to well, as well as for the background signal, illustrates a very low variability in the assay.
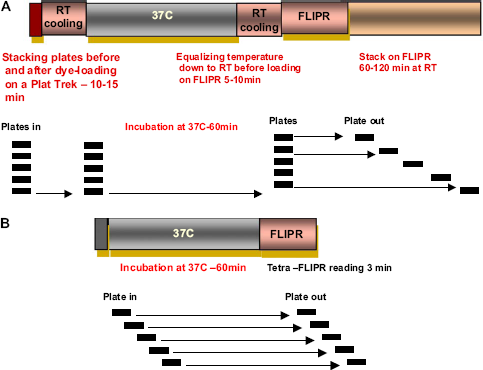
Schematic diagrams of two protocols: batch-based and individual. (A) Protocol for batch of plates using FLIPR-3 plate reader with stacker. Plates are handled in a batch of several (five in this example): from the incubator plates are manually moved as a batch to the Packard PlateTrack for dye dispensing. Then, the whole batch was returned into 37 °C 5% CO2 incubator for dye loading. After 0-60 min of incubation, the batch of plates is removed from the incubator and cooled down to ambient temperature for 10 min to ensure equal temperature of all assay plates coming into FLIPR. The batch of plates is then manually loaded into the stacker of FLIPR-3. Assay plates and compound plates were intercalated and loaded in the same stacker for sequential transfer into the FLIPR-3 for agonist addition and detection of intracellular calcium flux. (B) Protocol for a single plate handled manually or for sequential handling of individual plates by the automated Thermo LAS system.
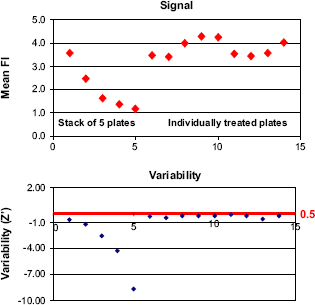
Detection of the signal using FLIPR-3 with stacker. (Top) A parallel set of experiments with two stacks of plates, treated as described in the Materials and Methods section. In the left panel, five plates entered the FLlPR sequentially after residing in the stacker for a variable interval that increased for each plate; in the right panel, each of nine plates was treated independently without variable delays. Mean was calculated for Max—Min values of raw fluorescent units detected over 3 min by FLIPR-3, N = 96 wells in 384-well plate. (Bottom) Variability was calculated as Z‘ 5 factor for each plate shown above.
The schemes in Figure 9 emphasize the difference between a stacker-based approach and the CRS integrated system. The integrated system has two crucial advantages. First, is the maintenance of cell culture conditions throughout most of the protocol. Second, the absence of variable delays between steps in the protocol, which increase from plate to plate in a stacker-based automation system; if the stack is large, the delay could accumulate to over an hour. The Thermo LAS/FLIPR system allowed us to support this fragile and sensitive assay for compound screening with a high throughput of up to 120 plates per day.
Results of HTS Using Thermo LAS FLIPRTETRA.
This high-throughput screen was targeted to find agonists for an over-expressed Gq-coupled receptor. Small molecules, 407,448, were tested at 10 μM concentration in 28 working days. Each 384-well assay plate had a column with positive control agonist and a column treated with buffer for background controls. The changes in fluorescent signal were analyzed as fold of induction (FI) above background, normalized to each plate. Calculations were done using median values for the change in raw fluorescent units in each well. The statistical analysis of control wells over the course of the screening campaign is presented as a histogram in Figure 12. The tight clustering of each group of controls and nice separation between positive controls and background illustrate robust performance of the assay throughout the whole campaign.
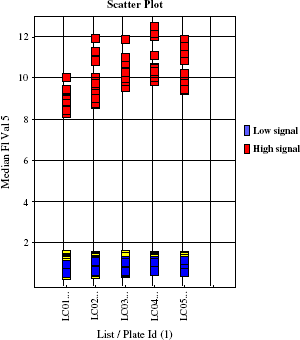
Results of the assay done using Thermo LAS FLIPRTETRA. Median calculated for Max-Min value for wells with agonist (high signal) and buffer-treated wells (low signal). Median value of buffer-treated wells was used to normalize values for each well (n = 192) and to calculate FI.
A histogram of the results from our entire library of test compounds over the whole campaign (Fig. 13) has a normal distribution with slightly extended right tail. An activity cutoff of Fold Induction ≥ 2 was selected based on three interquartile range (IQR) standard deviations from the median value for the population, using log transformation of the Fold Induction values. Of approximately 400,000 compounds tested, 13,804 wells had an FI value higher than 2, resulting in a primary hit rate of about 3.4%.
Of approximately 14,000 primary hits retested, 4877 hits were confirmed in a five-dose titration in triplicate, with the high dose replicating the primary screening concentration of test compound. Figure 14 demonstrates the correlation in a scatter plot of the triplicate confirmation runs with each other. However, 3633 confirmed hits also showed above 2 FI in an assay with the parental cell line, lacking the target GPCR. Thus, only 593 hits were confirmed to have statistically significant, target-specific activity.
CONCLUSION
The TAP Select provided very meticulous cell culture handling and consistency in cell plating. The Thermo LAS system handled plates identically with fixed intervals for all steps of the biological assay. The FLIPRTETRA produced comparable results to the FLIPR-3 but had reduced footprint and support requirements. This robotic team of TAP SelecT Robotic Tissue Culture System and Integrated Thermo LAS Robotic Assay System with Dual FLIPRTETRA enabled high-throughput logistics for a very sensitive cell-based assay.
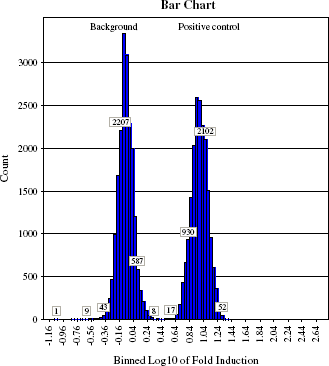
Induction of agonist response in positive control and background control wells over the entire campaign. The logarithm of fold induction binned and plotted as a histogram for background wells (left peak) and agonist-treated positive control wells (right peak).
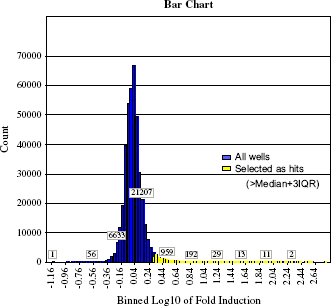
Fl values for entire screening library and campaign statistics. Data points, 407,448, were analyzed. Fl was calculated using sample Max—Min of RFU divided by the median value of Max—Min RFU for low control wells on each plate, n = 16. Yellow color highlights result values greater than or equal to 3 IQR SD above the population median fold induction value. These were selected as primary hits.
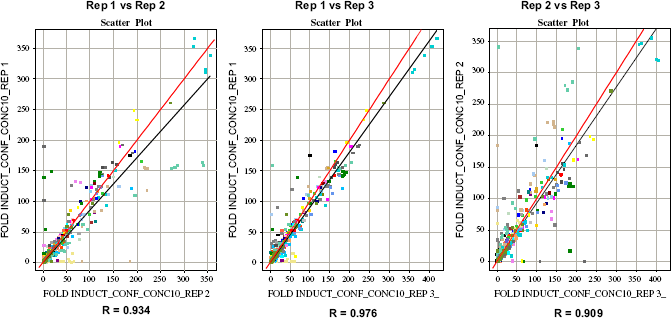
Correlation of the triplicate runs during confirmation of the primary hits.
Footnotes
Acknowledgment
Authors would like to acknowledge Dr. Jeff Paslay and Dr. John Morin for support of this project as well as for critical review of the material. We would like to thank Linda Heydt, Gary Kalgaonkar, Dorothy Paul, Wei Cong, Craig Lamison, and Nadya Smotrov for expert technical assistance, and Robert Ring, Zia Rahman, Dianne Kowal, and Tim Lock for target selection, vahdation, and development of the FLIPR-384 assay formats.