
Abstract
Prosecution of positive allosteric modulator (PAM) targets demands a specialized assay toolset. Many GPCR or ion channel targets are adaptable to functional assays whereby PAM efficacy can be inferred from left or rightward shifts in the concentration-response curves of orthosteric agonist. The inherent emphasis on throughput and occasional paucity of radioligands for a diverse array of allosteric modulator targets yields a need for an enhanced throughput agonist potency shift assay. Here, we describe a process by which such an assay was automated with robust, reproducible in vitro pharmacology. In direct comparison with a manual CRC shift assay, the enhanced throughput automated platform described here delivered near identical rank orders (r2 = 0.75) at ~4-fold throughput/assay iteration. Correspondingly, average cycle time/plate decreased from 104 to 72 minutes. We also observed reductions in assay interference associated with compounds exhibiting ago-allosterism, which we attribute to preread compound incubation periods which are more precisely time-constrained under automation control. By leveraging automated laboratory technology, we have achieved meaningful throughput with no sacrifice of precision. Rather than to be target-class specific, the present process was specifically designed to serve as a platform template for a variety of cell-based functional allosteric modulation assays.
Introduction
Positive allosteric modulators (PAMs) are a rapidly emerging drug discovery target class that have engendered a new pharmacological vocabulary, as well as specialized assay tools designed to be consonant with the unique characteristics of PAMs. As described in the evolved two-state model of receptor activation described by Hall, 1 PAMs are typified by their ability to increase both potency and efficacy of an orthosteric ligand. Because the action of a “pure” PAM is wholly dependent on the phasic, physiological release of an endogenous transmitter, PAMs confer therapeutically advantageous enhancement of receptor signaling pathways in a manner that temporally and anatomically mirrors the endogenous tone associated with discrete release of the endogenous neurotransmitter.2,3 This mode of action stands in contrast with the in vivo behavior of full or partial orthosteric ligand-gated ion channel (LGIC) or G-protein-coupled receptor (GPCR) agonists, which is decoupled from the physiological rhythm of receptor pathway activation and often attended by desensitization liability and reduced safety margins. Because orthosteric sites tend to be better conserved across receptor families than allosteric sites, the PAM approach also presents potential advantages in subtype selectivity. 4
A primary example of the efficacy and safety benefits of the PAM approach in the treatment of human disease is the benzodiazepine class of γ-aminobutyric acid type A (GABA-A) receptor PAMs, which provide sedative/anxiolytic action without the toxic respiratory suppression characteristic of the direct-acting barbiturate class due to the characteristic “effect ceiling” of PAMs (e.g., that the dependence on physiological concentrations of an endogenous orthosteric agonist for PAM activity to be manifest self-limits PAM activity even at very high exposure levels).5,6 Among other therapeutic applications for ligand-gated ion channel PAMs, recent reports have described the efficacy of subtype-selective GABA-A modulators in chronic pain.
7
N-methyl-
In the GPCR space, a growing literature describes the development and potential therapeutic implications of metabotropic glutamate receptor (mGluR) PAMs of various subtypes for the treatment of schizophrenia.8,10-13 Among family A GPCRs, Valant et al. 14 recently described the pharmacology of a series of adenosine A1 receptor PAMs, and numerous authors have reported on PAMs and/or allosteric agonists of the muscarinic acetylcholine receptors15-17and the GABA-B receptor.18,19
Although the current literature is enriched with CNS-focused approaches, the basic benefits of the PAM approach apply to any receptor system, and as such, the horizons of PAM research in drug discovery appear to be extremely broad. For instance, positive modulation of the parathyroid calcium-sensing receptor (CaR) has been comprehensively described.20-22 The CaR PAM cinacalcet is approved by the Food and Drug Administration (FDA) for use in hyperparathyroidism and parathyroid cancer, the first GPCR modulator approved for clinical use.
As drug discovery has embraced PAMs for multiple indications, a unique set of requirements for early in vitro prosecution of these unique and often challenging targets has emerged. Numerous highly specialized techniques for characterizing the pharmacological nature of allosteric modulation have been described, most notably varied applications of the seminal Schild analysis of receptor binding. Indeed, in cases where a radioligand is available, displacement binding can be employed to estimate relative potency of candidate allosteric molecules in a manner identical to the classical approach to the identification of orthosteric ligands. However, very few radioligands for allosteric sites on GPCRs or LGICs have been described. Radioligand availability notwithstanding, filtration binding assays are throughput limited relative to plate-based functional or second-messenger accumulation assays. Moreover, binding assays do not resolve efficacy, which in PAMs, perhaps more than any other target class, because of the nature of their action to magnify endogenous agonist responses, is of paramount importance. For these reasons, functional assays are critical tools for operating in the allosteric space.
Commonly employed functional assay techniques for endogenously Gq-coupled GPCRs, or receptors amenable to Gq-coupling via chimera, prominently include Fluorometric Imaging Plate Reader (FLIPR)–type functional Ca++ release assays run in PAM detection format similar to that described by Kennedy et al. 23 Modulatory activity at LGICs can be assessed via ion flux fluorescence or fluorescence quench assays, depending on channel biophysics and ion permeability. Regardless of target class or signal transduction, essential elements of PAM functional assays (hereafter, the “PAM CRC” assay to distinguish from other assay formats) are conserved. In a typical PAM concentration-response curve (CRC) functional assay, a low concentration of orthosteric agonist (~EC10–20), which approximates the minimum threshold for eliciting a biological response in the assay, is applied following preincubation of cells expressing the receptor of interest with serially diluted PAM molecules. In this manner, a CRC of PAM modulation of the agonist response can be described. Efficacy is quantified by the maximum gain response relative to an interassay control of experimenter choosing. Commonly, this interassay control takes the form of a saturating concentration of a known agonist, but data can also be benchmarked against the maximum response of an agonist ~EC10 to a known PAM.
The PAM CRC approach couples potency information in a functional assay context with an assay format that can be easily adapted to run in multiple detection modes by simple changes in compound addition sequence (e.g., test compound coaddition with an agonist ~EC10 in PAM mode, acute addition of test compounds in agonist mode, and coaddition with an ~EC90 of agonist in antagonist mode). This versatility allows the assay triage to be tailored to the chemical space around the target of interest, in which PAMs as well as partial or full allosteric agonists (the so-called ago-allosterics), 24 negative modulators (NAMs), 2 or silent modulators (SAMs) 25 may exist with various prevalence depending on target class biology. The first and perhaps best characterized published example of this facet of modulator pharmacology is the so-called molecular switch identified by Sharma et al. 26 in the process of toggling between 3- and 4-methyl substitution of a series of derivatives of the mGluR5 NAM 2-methyl-6-(phenylethynyl) pyridine (MPEP). In this setting, the 3-methyl derivative was a noncompetitive antagonist with an IC50 of ~0.008 µM, whereas the 4-methyl derivative was a PAM with an EC50 of ~3.0 µM and 99% efficacy relative to L-glutamate in a functional assay. Indeed, the identification and optimization of the structure-activity relationship (SAR) factors that delineate different forms of modulatory activity are often a critical early determinant of lead progression.
Although the PAM CRC approach is a valuable tool for assigning rank-order potency and identifying the pharmacological fingerprint of test compounds, experience has shown that efficacy determinations (e.g., the feature corresponding to the Ymax value in the PAM CRC format) can vary across multiple test occasions of the same compounds. This relates to a number of factors, including the tendency of certain compounds to display overlapping PAM and agonist activity, which causes apparent desensitization and the phenomenon of curves that “crash” or turn over very rapidly without reaching a consistent plateau. Other factors include variability in the receptor-modulated “gain” of the intracellular Ca++ response, which can be associated with fluctuations in receptor density, receptor-effector coupling, or the overall metabolic robustness of a particular cell preparation.
To address this variability in efficacy determination, we sought a functional assay approach by which rank-order efficacy could be assigned with maximum accuracy and precision, as well as equal the throughput of a 384-well PAM CRC assay, wherein 32 PAM test compounds can be dosed out per plate. The approach we sought leverages the inherent properties of PAMs to increase the potency and/or efficacy of orthosteric agonists. This action has the net effect of left-shifting an orthosteric agonist CRC in a manner that is proportional to the efficacy of the PAM and returns greater precision versus efficacy determination via the PAM CRC method. Here we describe the design and validation of a functional agonist CRC shift assay with fully automated plate prep, reagent prep, and offline data extraction and handling. This platform can be applied to the prosecution of GPCR and ion channel modulator targets across multiple indications and functional assay categories.
Materials and Methods
Creation of source plate for ECHO CRC
A REMP (TECAN US, Durham, NC) plate was prepared with 40 µL DMSO (Sigma, St. Louis, MO) to columns 2 and 3 and 1 mM agonist in column 1. A threefold dilution was performed by removing 20 µL from column 1 and adding and mixing it into column 2, then column 2 to column 3 (as depicted later in Fig. 5A ). Next, a multichannel pipette was used to add 6 µL of column 1 to columns 1 and 11 of an ECHO low-dead volume (LDV) COC plate (Labcyte, Sunnyvale, CA). This was the ECHO source plate. Then, 6 µL of column 1 of the REMP plate was added to columns 1, 11, and 24 of a second LDV ECHO plate, the ECHO destination plate. Column 2 of the REMP plate, containing in this representative example 0.33 mM of the agonist in DMSO, was added to columns 2 and 12 of the ECHO destination plate. Column 3 of the REMP plate was added to columns 3 and 13 of the ECHO source plate.
ECHO CRC process
A custom method was developed for the ECHO 550 acoustic dispenser (Labcyte) to dispense different volumes from columns 1 and 3 to achieve a 10-point 1:3 dilution of the agonist compound. The first seven concentrations came from column 1 or 11 containing 1 mM of the agonist, ranging from volumes of 770 to 30 nL. The remaining concentrations came from column 3 or 13, dispensing volumes ranging from 25 to 2.5 nL. Once the ECHO destination plate had been prepared, it was backfilled using the BioRAPTR (Beckman Coulter, Brea, CA). The BioRAPTR filled the wells with DMSO up to 7 µL/well, yielding a constant DMSO volume across all wells. Because of the liquid class of DMSO, the speed of the BioRAPTR dispense must be set to 30 to dispense to an ECHO LDV plate.
ECHO printing
The ECHO destination plate was now the source plate in the transfer of the agonist to the REMP plate, 500 nL/well. Once complete, the REMP plate was diluted with 100 µL of assay buffer per well. In an automated method controlled by a Polara laboratory automation scheduler, a given volume of agonist solution from this plate (varies with final reaction volume) was then added to the cell plate via the FLIPR (Molecular Devices, Sunnyvale, CA).
Cell plating for the FLIPR functional assay
HEK 293 cells expressing GPCRs or ion channels of interest were plated in 384-well black-walled clear-bottomed poly-D-lysine-coated plates (VWR, Radnor, PA) at a density of 20 000 to 30 000 cells/well in minimum essential medium (MEM) and incubated overnight at 37 °C at 5% CO2.
PAM compound plate preparation
The 384-well REMP plates were provided with source compound(s) (max = 4) already delivered to the plate. Each source compound was represented by 10 replicates at a uniform concentration, as required by the assay, in columns A and G, rows 1 and 11. The dilution sequence was carried out using the TECAN EVO Multi Channel Adapter (MCA) block replication liquid handling instrument. Then, 20 µL DMSO was added to all wells in rows B through F, as well as H through P, in advance of the row-based serial dilution process. For this process, a special 384-well row/column adapter plate was required to enable the instrument to use one row of tips (384-well tip box format) for each pipetting operation. A custom pipetting script was written to carry out a 1:3 dilution process down the plate from rows A (initial concentration) through F and again from rows G (second row of compounds at initial concentration) through L, where 10 µL of compound was aspirated and dispensed into the subsequent row on the REMP plate containing 20 µL DMSO. For each pipetting sequence, a mix of the transferred sample was carried out to improve delivered compound and DMSO homogeneity before the next dilution sequence in the process. All sample plates were sealed using the Velocity11 (Menlo Park, CA) PlateLoc and spun down to remove any trapped air bubbles and reduce the possibility of compound creep along well walls. Prior to assay, 2.5 µL of the six-concentration PAM plate was stamped into a 384-well REMP plate using a Velocity11 liquid handler. Then, 75 µL Hank’s balanced salt solution (HBSS; GIBCO, Carlsbad, CA) was added to columns 1 to 20 and 23 to 24 of the PAM plate, and 2.5× top agonist concentration (final agonist dilution varies with final assay volume) was added to columns 21 and 22 of the PAM plate to serve as normalization control.
Automated functional agonist shift assay
On assay day, growth medium was removed from cell plates by aspiration with an Aquamax (Molecular Devices) plate aspirator. Then, 20 µL Calcium 4 dye was added by a Combi (Thermo Scientific, Waltham, MA). Plates were then incubated in a Heraeus Cytomat (Kendro Laboratory Products, Newtown, CT) at 37 °C 5% CO2 for 60 min. In a process controlled by a Polara automation scheduler driving a track-mounted robot arm (Staubli, Duncan, SC), two 64-position plate carousels, an Aquamax plate washer, an FX liquid handler (Biomek FX, Beckman Coulter), two banks of multidrop Combis (Thermo Fisher), and a FLIPR (Molecular Devices), the agonist stock solution in DMSO was transferred by acoustic dispersion into a SV384W REMP aqueous source plate. The aqueous source plate was loaded with assay buffer via Combi and placed in a holding position. Contemporaneously, media-loaded cell plates were aspirated on the Aquamax, dye-loaded via Combi, and transferred to a holding position for dye incubation. After an appropriate interval, PAM compound plates prepared in a separate workstream (see above) were diluted on the Combi, transferred to an appropriate volume into the dye-loaded cell plate via the FX liquid handler, and set aside for a time-constrained PAM incubation interval. After incubation with test compounds, 20 µL of the buffer-diluted CRC aqueous source plate was transferred into the assay plate via the 384-well dispensing head on the FLIPR 384 for a final assay volume of 50 µL followed by fluorescent read and data extraction.
FLIPR protocol
In total, 20 µL of the just-in-time (JIT) agonist plate was aspirated at 20 µL/s. The 20 µL was then dispensed at a height of 30 µL at 10 µL/s into the cell plate. A baseline image was captured before agonist was added to cell plate. Emission was filtered using a 510- to 570-nm filter. Images were captured during two intervals. The first interval was captured at 1-s intervals for 50 s. The second interval was captured at 3-s intervals for 40 s for a total time of 3 min. The peak of the response was normalized to columns 21 to 22 (EC100 of agonist) with interassay quality control (QC) by Z′. Raw data were extracted to an offline software suite and fitted via a four-parameter logistic equation.
Results
Multimodal Functional Assay Formats for PAM Characterization
We developed functional assays to classify the multivalent in vitro pharmacology of GPCR allosteric modulators. Figure 1 depicts raw data from a representative group C GPCR Ca++ detection assay run in both PAM CRC (test compounds preincubated) and agonist modes (test compounds applied acutely to assess intrinsic orthosteric or ago-allosteric activity). Note that in the concentration region where PAM and agonist activity overlap, the PAM responses desensitize as a result of concomitant ago-allosteric activity.
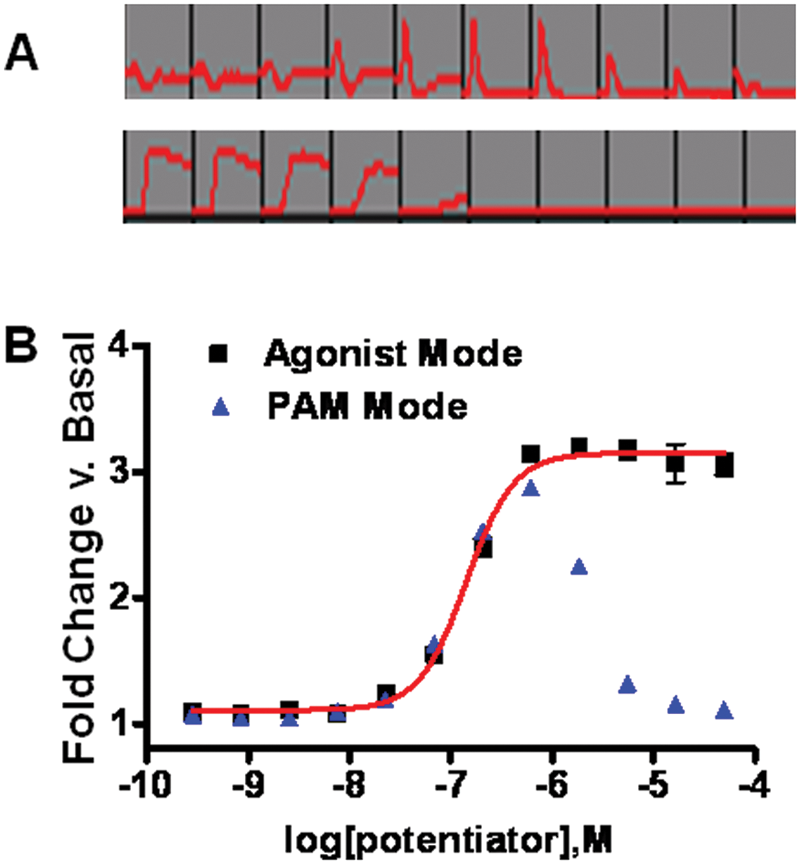
Data from a representative assay run in both positive allosteric modulator (PAM) and agonist detection modes. (
Because the magnitude of the PAM-induced shift in agonist EC50 is proportional to the extent to which functional responses are magnified (e.g., the efficacy of a PAM compound), agonist shifting is considered a correlate of PAM efficacy. To address variability in efficacy determinations by the PAM CRC technique described in Figure 1 , we developed an automated approach to agonist CRC shift determination. Figure 2 depicts representative agonist CRC shift data from a group C GPCR. Underscoring the more predictive nature of the agonist CRC shift format in efficacy determination, the observed correlation between Ymax efficacy in a PAM CRC assay versus identical compounds tested in the agonist CRC shift assay was weak. Figure 3A depicts representative correlation data from a group C GPCR (r2 < 0.1). Figure 3B depicts a representative statistical comparison of Ymax variability in a PAM CRC assay versus an identical measure of SD/mean of the agonist fold-shift value for the identical compound (p < 0.001). Because the variability in the shift factor (control agonist EC50/agonist EC50 in presence of PAM) is inherently lower than in Ymax determinations, more discrete efficacy rank orders can be achieved using CRC shift assays.
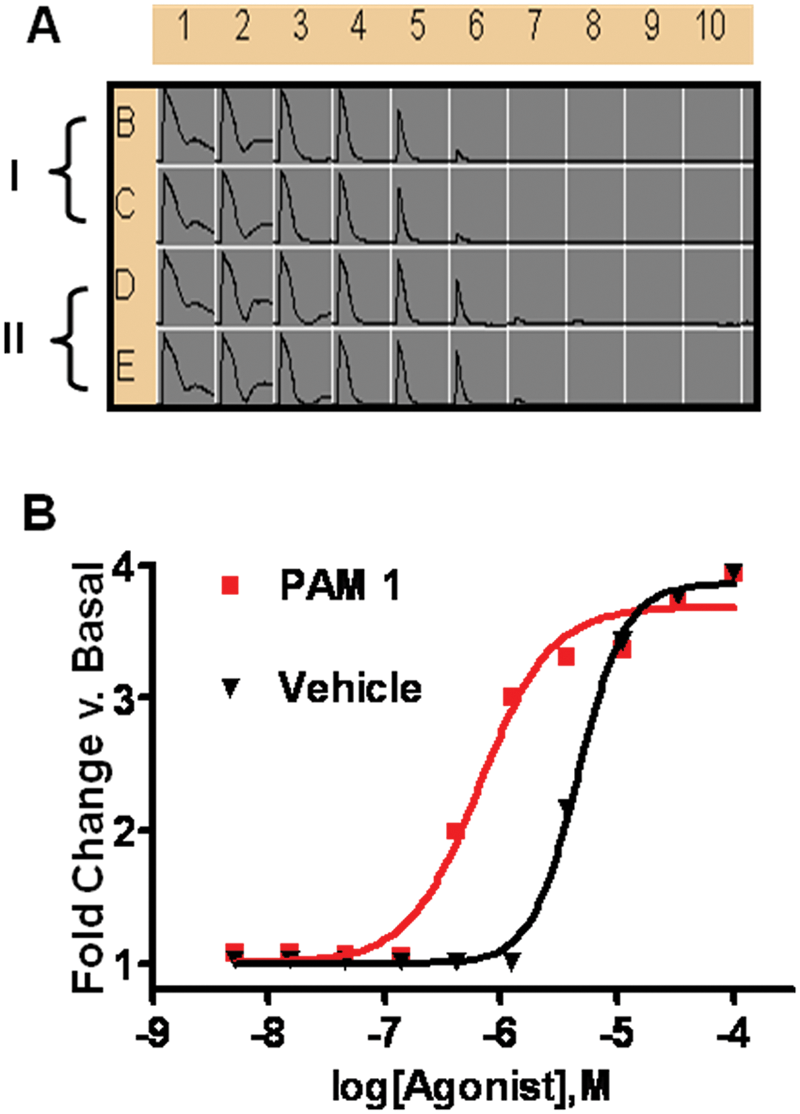
Representative agonist concentration-response curve (CRC) shift data. (
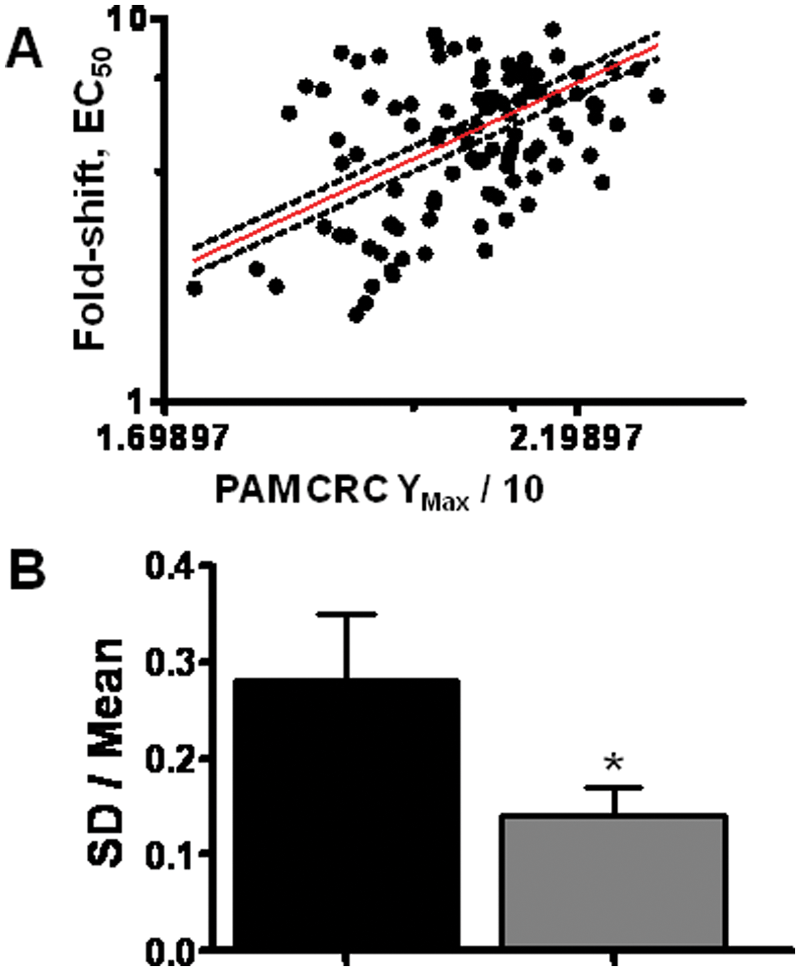
Positive allosteric modulator (PAM) concentration-response curve (CRC) data do not meaningfully correlate with the magnitude of PAM-induced agonist CRC shift values. (
Development of the automated agonist CRC shift assay
The basis of the agonist CRC shift assay format described here is 32 ten-point agonist CRCs that are transferred into a 384-well assay plate after preincubation of PAM test compounds with cells expressing the target of interest. The assay plate is divided into four test compound quadrants, each containing six concentrations of a single PAM test compound, one per 10-well row for a total of 24 of 32 rows. The remaining 8 rows receive vehicle only and are used to establish the baseline agonist EC50 within each plate. Data are normalized within each plate to a min/max established by a vehicle-only “Blanks” column and a “Totals” column containing an EC100 of the agonist of choice. Figure 4 depicts plate format. The assay as described here can accommodate 12 to 16 CRC shift determinations with two replicates per assay run with an approximate cycle time of 70 min/plate inclusive of dye loading.
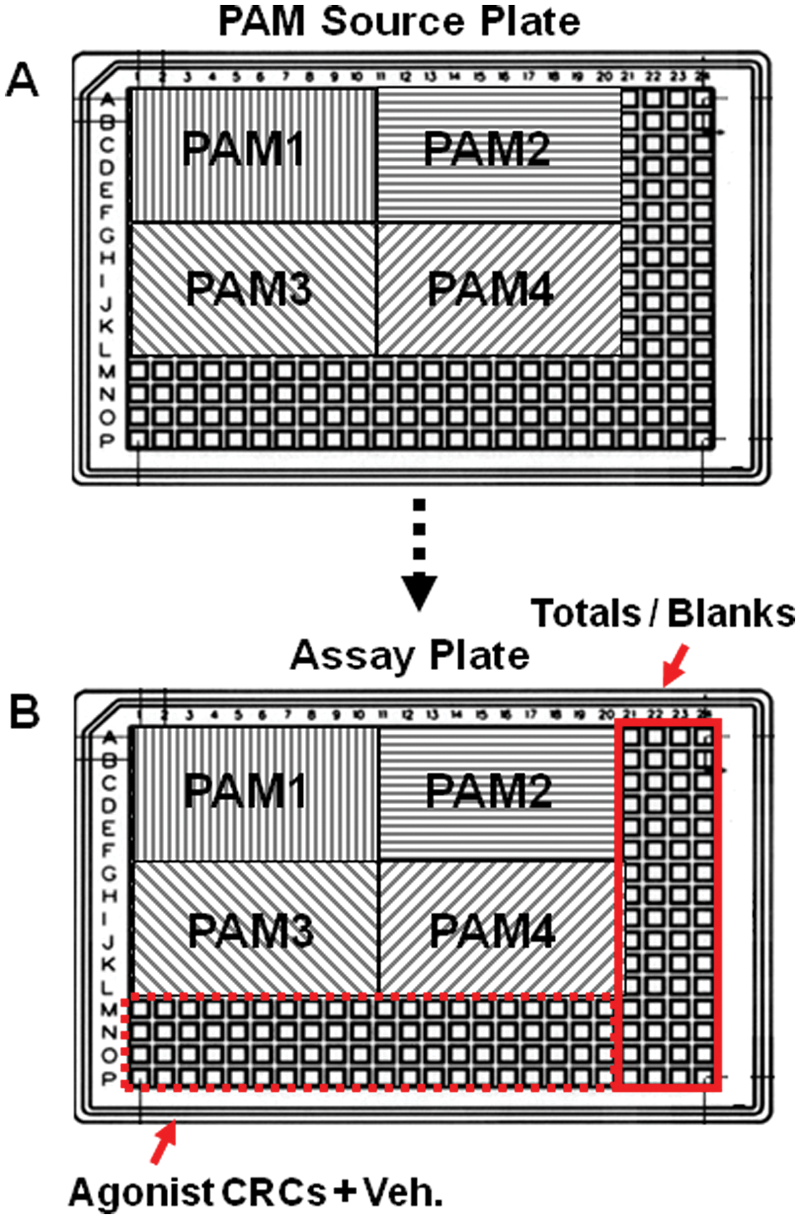
Representative plate layout for 384-well REMP positive allosteric modulator (PAM) compound source plate and assay readout plate. (
We determined that a central determinant of precision in the agonist CRC shift assay is the ability to generate orthosteric agonist CRCs with tight coefficient of variance (CV) tolerances and in a timeframe meaningful for a cell-based fluorescent dye assay. A complicating factor is that many endogenous agonists (in particular amino acids) display varying stability in stock solutions, and efforts at making and freezing CRC master plates for later use produced unacceptably low levels of precision with a variety of test agonists. For this reason, to provide maximum flexibility and resource avoidance, we chose to incorporate JIT reagent sourcing and preparation for the serial dilution of agonist CRCs.
As depicted in Figure 5 , a freshly made stock of the agonist of choice was serially diluted via touch-free acoustic transfer in a 384-well ECHO plate, followed by acoustic transfer into a SV384W REMP plate. To ensure a constant final DMSO concentration well to well in the REMP plate, DMSO was backfilled using a BioRAPTR (for a detailed description of the JIT preparation of agonist CRC plates using the ECHO 550 and BioRAPTR, see Materials and Methods). In developing this process, we identified ECHO source plate orientation as a driver or dispense precision. As described in Figure 6 , trial format “A” consisted of a traditional (e.g., well A1 oriented to the top left) start placement of the ECHO plate for JIT ECHO CRC creation, whereas format “B” consisted of 180° rotation of said ECHO plate.
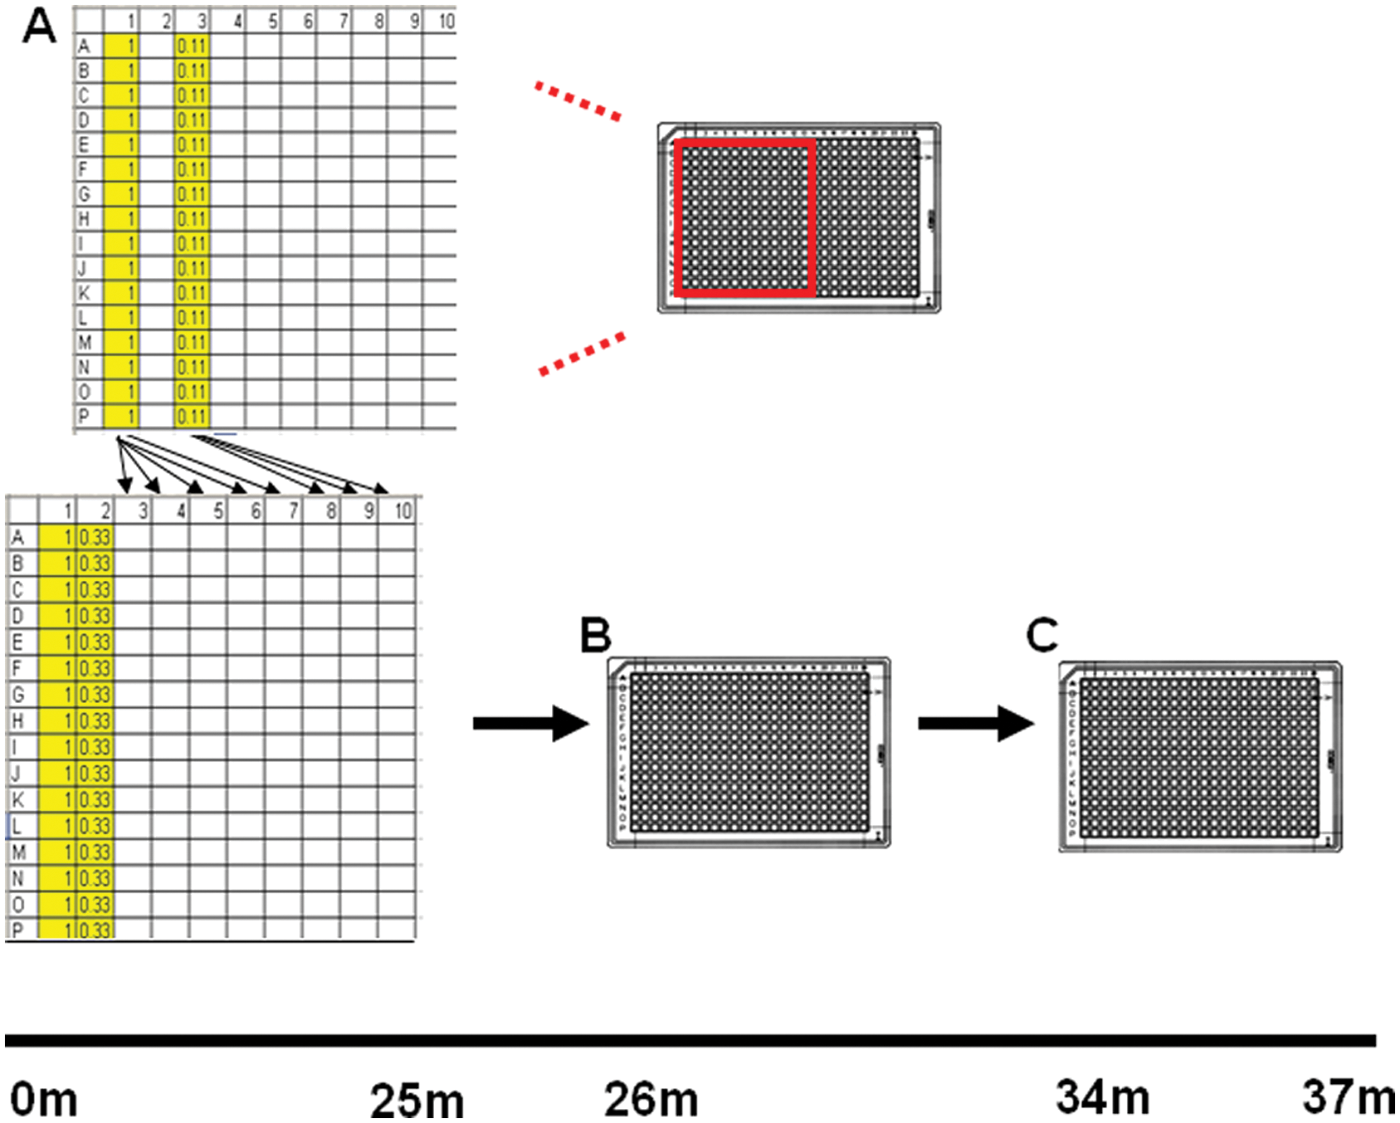
Creation of the ECHO agonist concentration-response curve (CRC) source plate. (
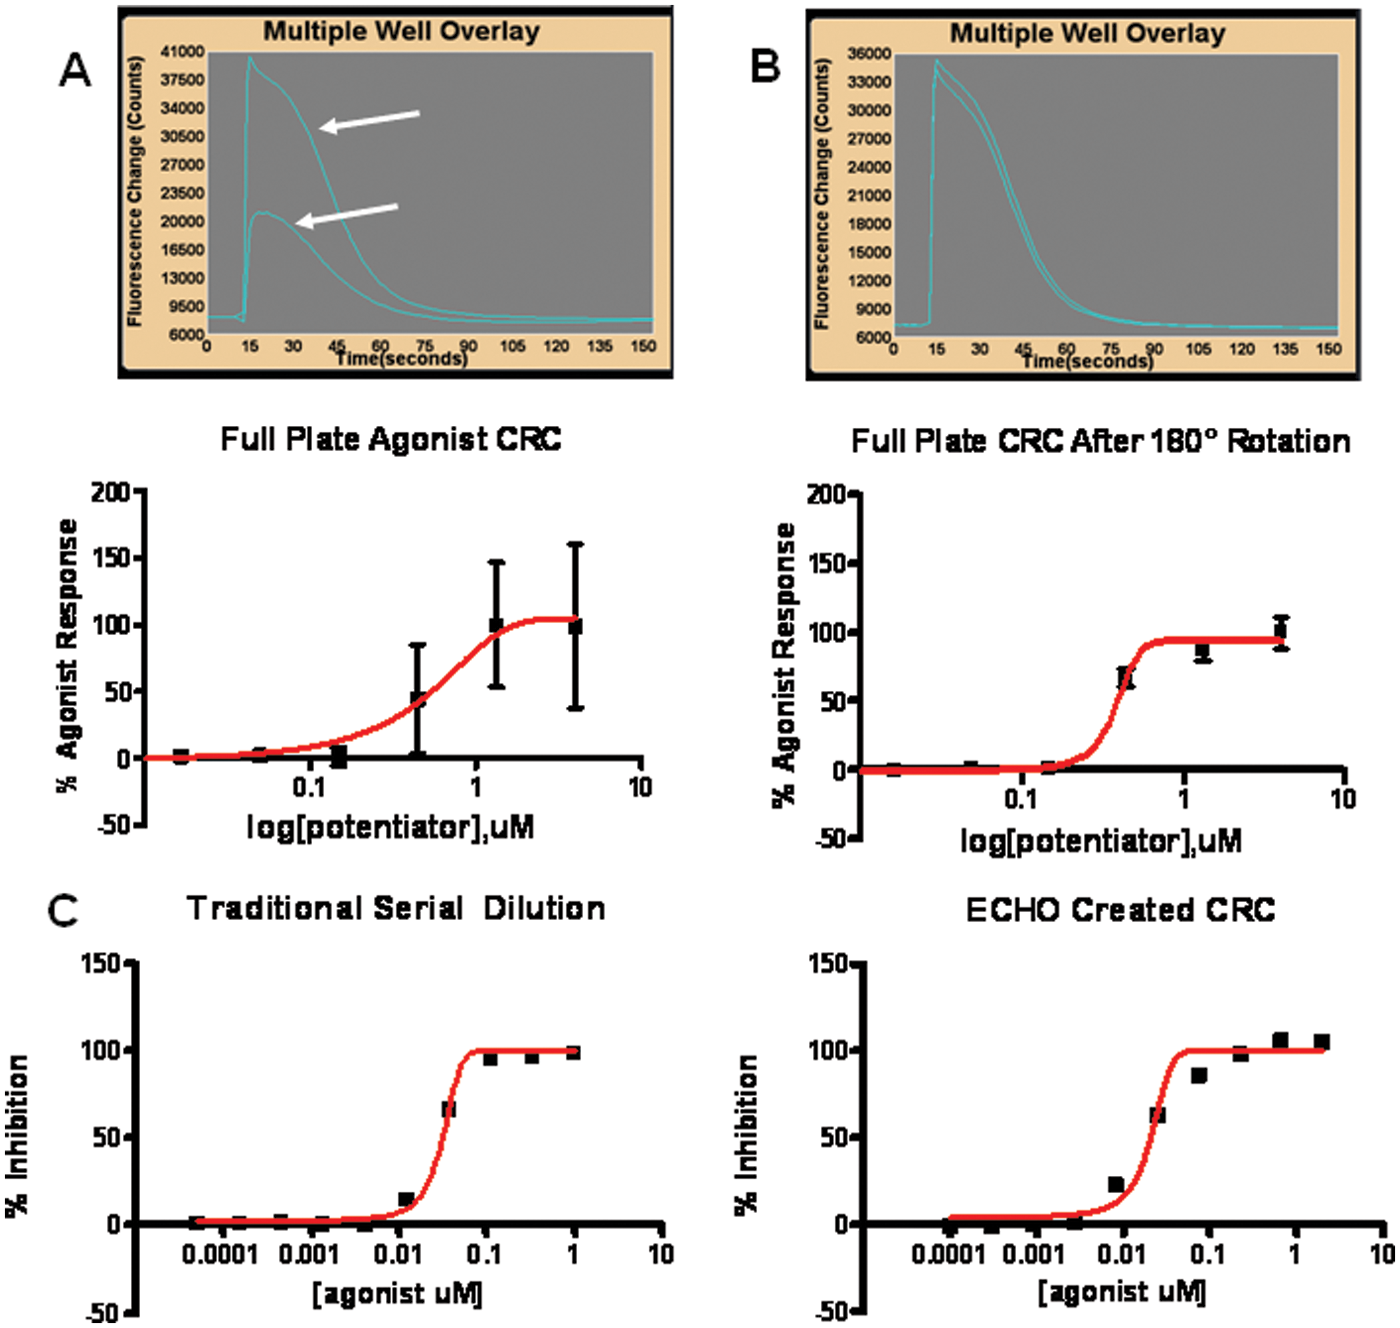
Trial format “A” versus trial format “B” for just-in-time (JIT) ECHO agonist concentration-response curve (CRC) plate. (
We determined that trial format B was associated with increased dispense precision across the JIT CRC plate, as measured by coherence of biological agonist responses from the left versus the right side of vehicle-only agonist CRC test plates. We have observed sensitivity of ECHO dispense precision to the initial orientation of the ECHO source plate in other applications and attribute the benefit associated with source plate rotation to instrument-to-instrument variability in detecting the meniscus of DMSO droplets prior to acoustic dispersion. In the automated format, a representative average agonist EC50 in the vehicle condition was 0.641 ± 0.015 µM (n = 32), and the average Hill slope was 3.32 ± 0.106.
Assay Performance Benchmarking
In a small-scale assay, an experimenter can reasonably be expected to manually time plate flows to ensure uniform compound preincubation intervals. However, as the scale increases, it becomes impossible to do so manually. For this reason, we sought to automate the plate flows that bridge the creation of the ECHO CRC source plate and the end functional readout. The use of the Polara scheduler ensures that the time intervals between all steps are essentially identical, including the time-sensitive PAM incubation interval.
To cross-validate the automated platform approach, we compared a test set of group C GPCR PAM compounds run in automated mode with a low-density benchtop manual version of the assay. In the current validation format, PAM compounds were dosed in half-log increments from 0.01 to 3.0 µM final assay concentration and universally attained full saturation of CRC shift magnitude within this range. The six-concentration automated agonist CRC shift assay displayed good overall coherence with the manual assay, although the sensitivity of the automated assay to fold-shift magnitude was slightly greater. For the representative compound set depicted in Figure 7 , the mean peak fold-shift value was 6.8 versus 6.1 in the manual assay. Overall, the assays evidenced good alignment (r2 = 0.75).
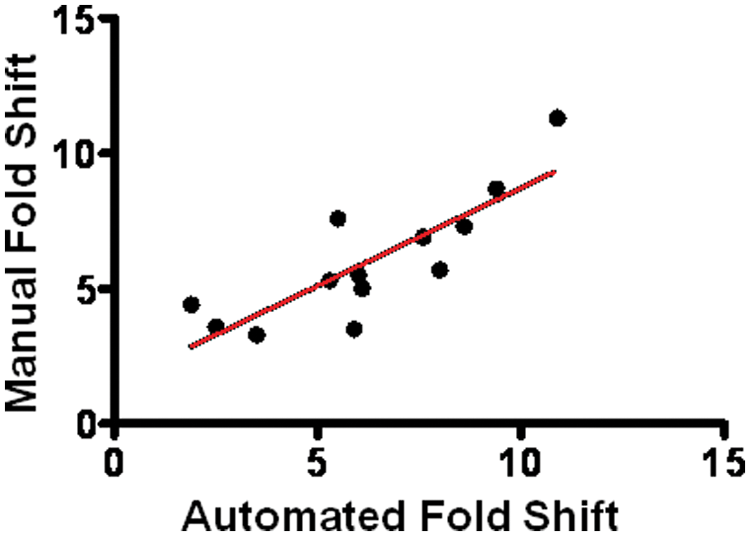
Agonist concentration-response curve (CRC) shift assay sensitivity conserved after automation scale-up. Automated six-concentration agonist CRC shift maximal EC50 shift values for a representative set of group C G-protein-coupled receptor (GPCR) positive allosteric modulator (PAM) compounds plotted against the identical compounds run in a manual two-concentration agonist CRC shift assay. Rank-order coherence was conserved, and assay sensitivity was slightly greater in the automated fold-shift assay, as evidenced by a tendency toward higher maximal shift values (r2 = 0.75).
As mentioned previously, CRC desensitization due to ago-allosterism is a common form of assay interference that is often dependent on the compound preincubation interval (or variability thereof). Therefore, a key optimization associated with the automated platform format is scheduler-constrained PAM preincubation times. Under automation, during which the preincubation interval was fixed at precisely 10 min, 3 of 22 (14%) compounds in the GPCR PAM validation toolset showed reductions in agonist CRC Ymax at the upper end of the PAM test concentration range, compared with 7 of 13 (54%) compounds run manually from an identical set. Correspondingly, the PAM compounds exhibiting desensitization in the manual fold-shift assay displayed maximum fold-shift values that were on average 27.5% lower than compounds in which no desensitization was observed. This result suggests that scheduler-controlled plate flows eliminate the temporal variability that leads to desensitization-mediated reduction in assay sensitivity among select compounds. The automated agonist CRC shift assay displayed a broad dynamic detection range, although this could be target dependent. With the current validation reagents, the 6-point CRC method demonstrated the ability to resolve fold-shifts ranging from 1.9 to 17.3. Figure 8 depicts representative six-concentration fold-shift data.
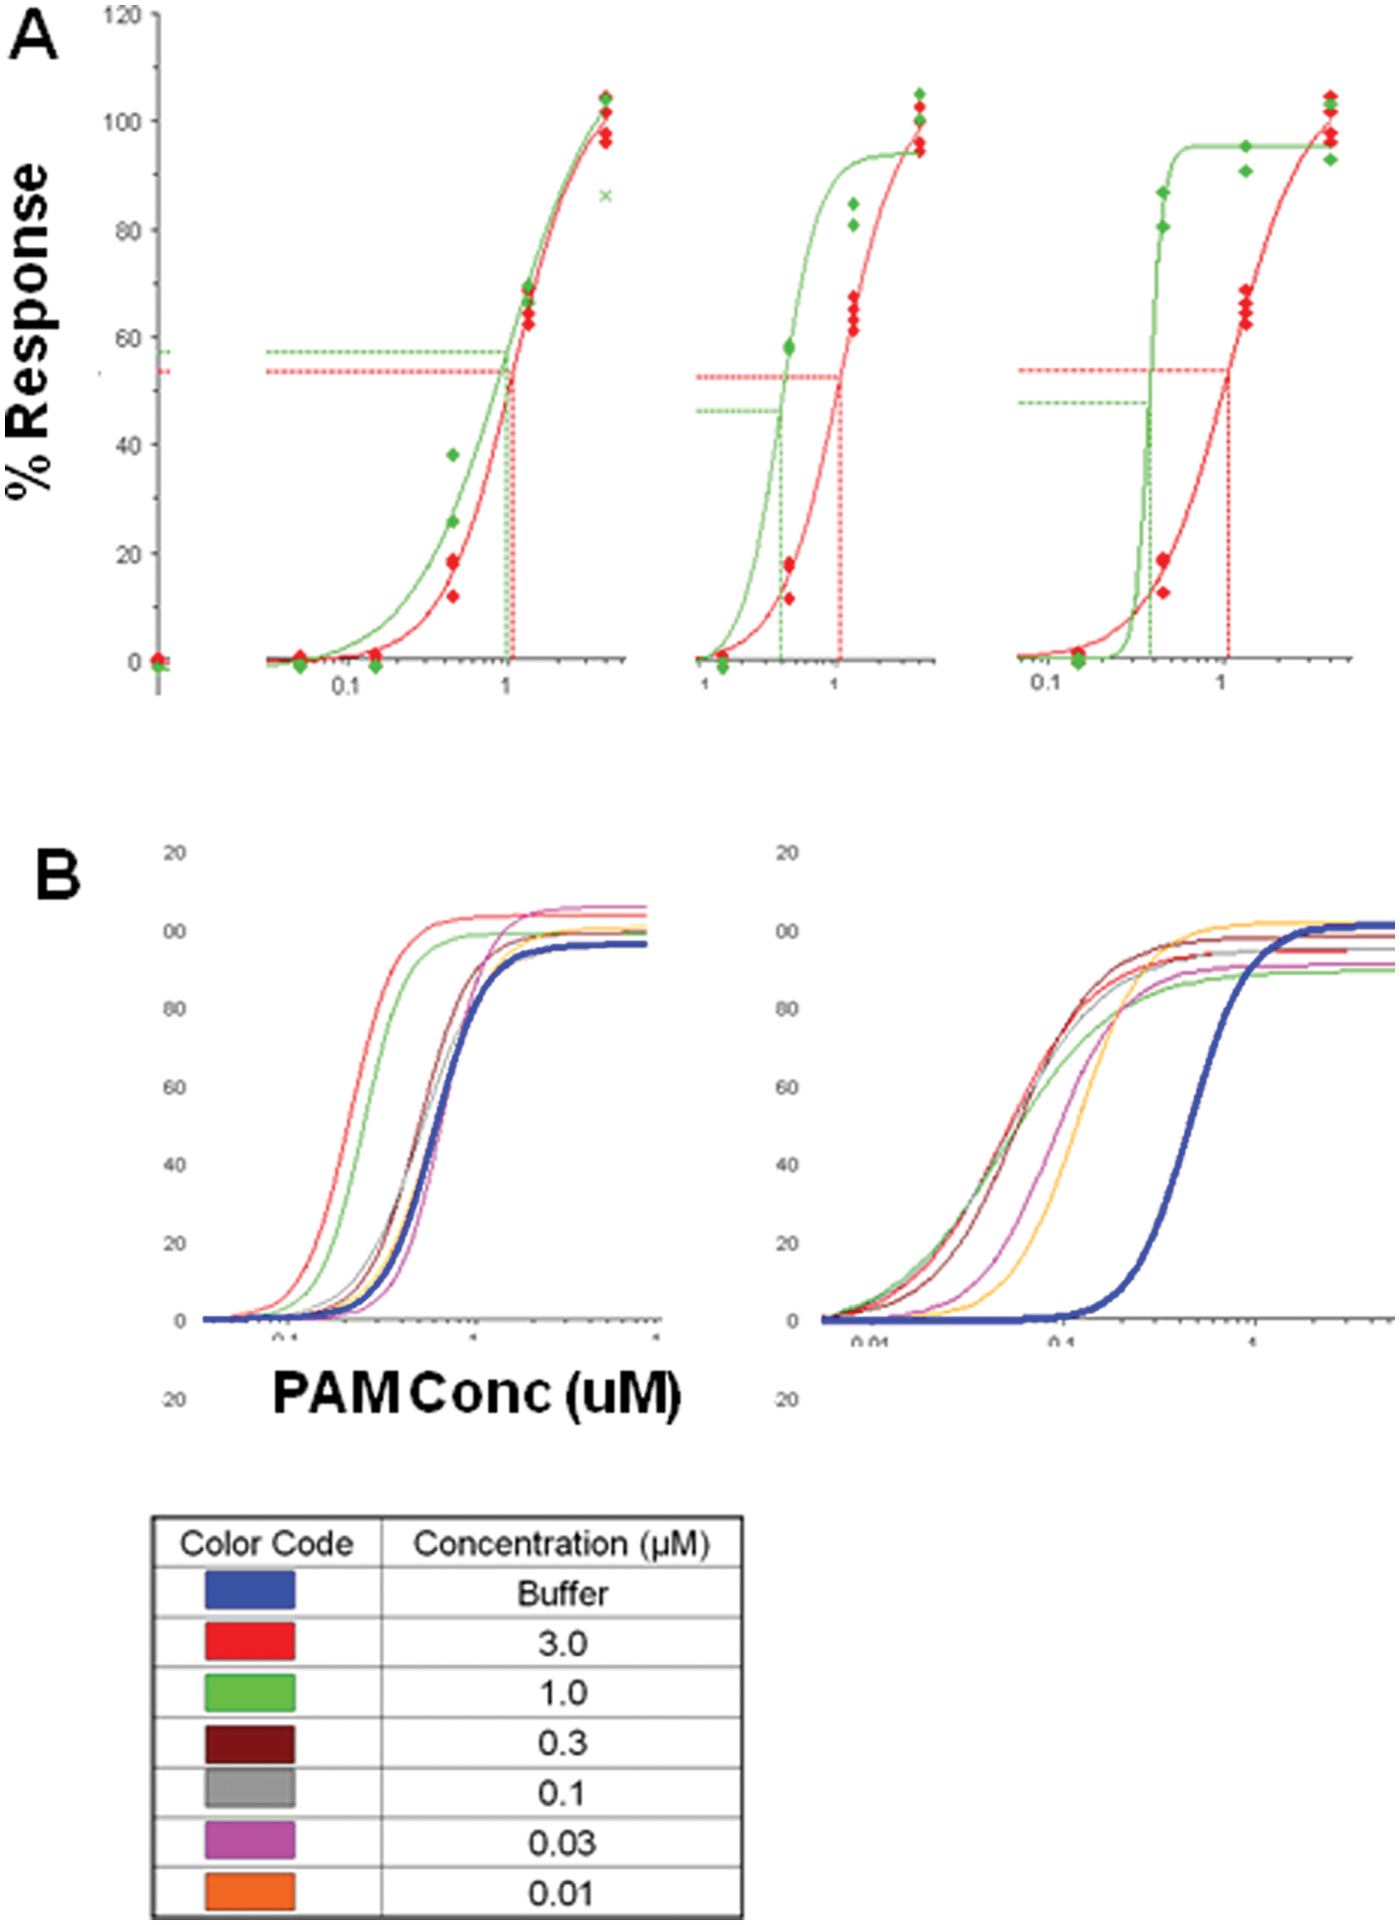
The automated positive allosteric modulator (PAM) concentration-response curve (CRC) shift platform returns precise, discrete determinations for PAM compounds over a broad range of fold-shifts. (
Quantification of the shift EC50
To explore possible pharmacological determinants of the shift EC50, the PAM CRC assay was run with a single compound challenged by incrementally increasing concentrations of agonist. However, from these pilot data, it was determined that the assay window in the PAM CRC assay was significantly degraded with increasing orthosteric stimulus concentration, leading to a decrement in interplate Z′ and an increase in the variability of PAM CRC determinations (data not shown). Thus, it was difficult to strictly assign a rationale to the disconnect between PAM CRC and shift EC50 values for given compounds.
Figure 9A , B depicts side-by-side PAM CRC and shift EC50 values for a representative group C GPCR PAM compound showing the characteristic rightward shift in shift EC50 potency relative to the PAM CRC value. Although the potency values are generally frame shifted as shown by the table in Figure 9C , the potency rank order among a small set of tool compounds was conserved, indicating that the shift EC50 may have utility as a means of triaging compounds by potency. This finding suggests that by analyzing the fold-shift and the shift EC50 in parallel, potency and efficacy information can be derived from a single agonist CRC shift assay.
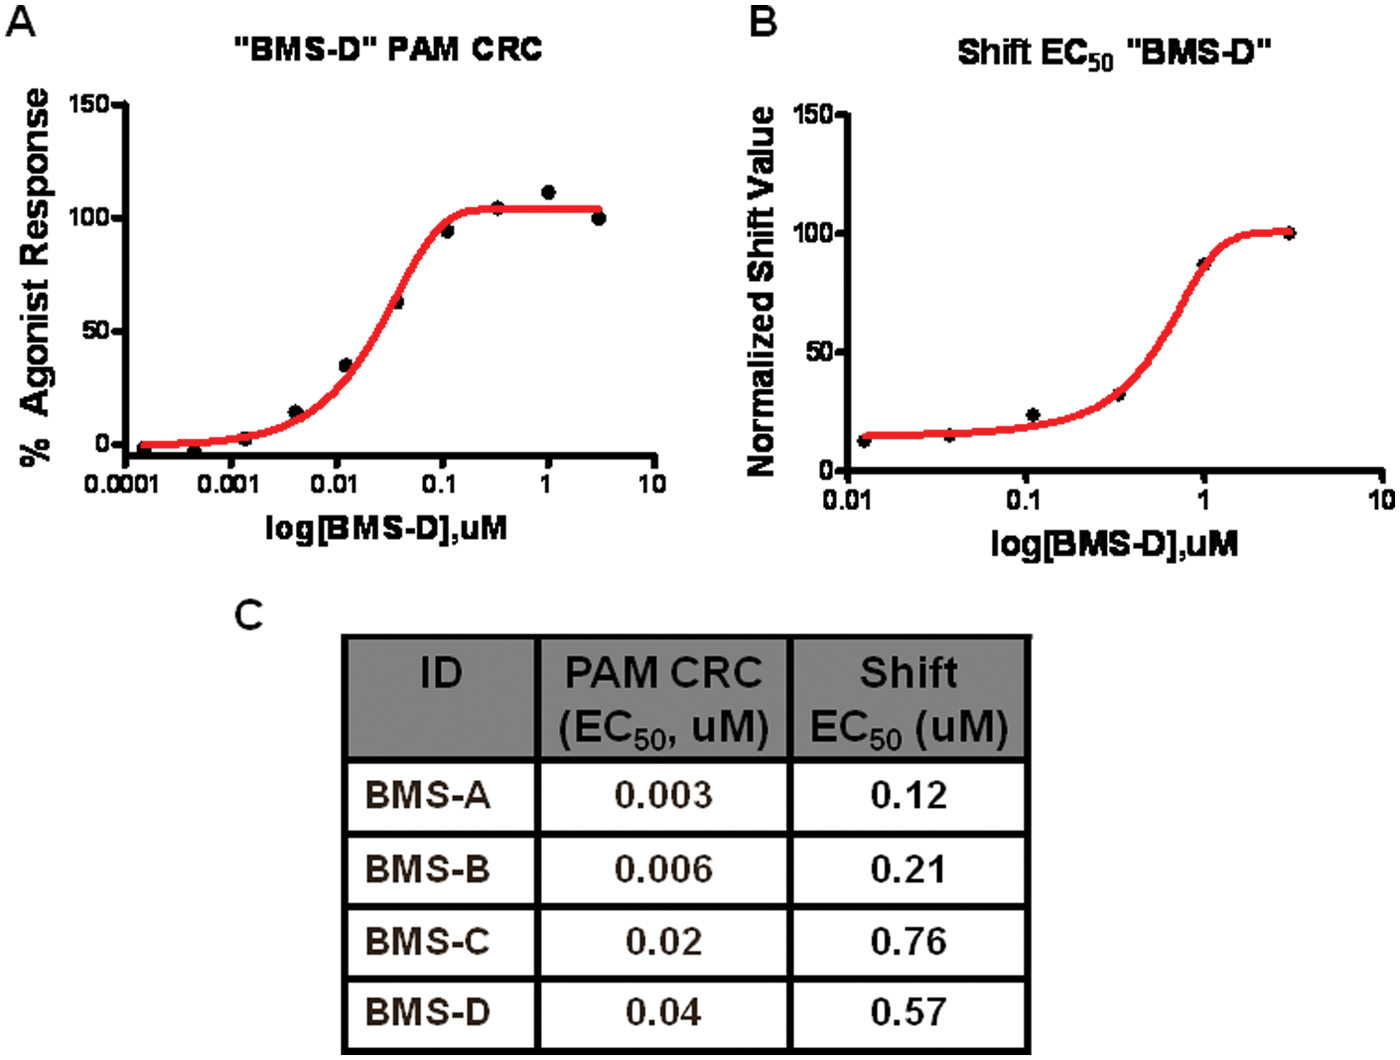
The relationship between shift EC50 and positive allosteric modulator (PAM) concentration-response curve (CRC) EC50 is right-shifted toward the shift EC50. (
Discussion
Effective prosecution of any drug target class is aided by a diversity of assay tools with which to interrogate the chemical space around the target. In the case of PAMs, where strong therapeutic promise is tempered by the complex and varied nature of orthosteric-allosteric interactions across receptor families, this need for a diverse array of pharmacological perspectives is all the more important. Although potency determinations may be relatively straightforward via PAM CRC assays of the type described here or via a binding assay where allosteric radioligands are available, efficacy determinations require different assay tools.
The agonist CRC shift approach examines amplification of an orthosteric agonist response across the full effective concentration range of the agonist, rather than dose-dependently amplifying a single agonist concentration as in PAM CRC assays. This configuration thus accounts for any interdependence of orthosteric site occupancy with the magnitude of allosteric amplification. By plotting shift values by PAM concentration, a measure of potency can also be obtained (i.e., the shift EC50 described here). Understanding the nature of agonist shift required for activity in a given system or receptor class is central to developing drug-like PAM compounds. Indeed, in vivo efficacy has been reported with PAM compounds exhibiting agonist shifts as low as threefold, 27 although given the heavily interdependent nature of CNS disease, this relationship appears likely to be system subjective.
As we describe here, the agonist CRC shift assay reports PAM efficacy with greater precision than the Ymax efficacy value in the PAM CRC assay. However, stability of agonist solutions and dilution-mediated variability in agonist CRC tolerances were identified as sources of error. To address these issues, an automation process was sought to allow JIT creation of agonist CRC source plates by touch-free, acoustic dispersion serial dilution using the Labcyte ECHO 550. This technique enables high-precision JIT reagent prep, and the current study is the first published report of this novel serial dilution capability of the ECHO system.
A primary challenge in designing the present CRC shift platform was ensuring sufficient detection range to accommodate PAM compounds of varying potencies. The present six PAM concentration/plate format, enabled by a specialized process on the TECAN EVO liquid handler, enables testing a sufficiently broad range of PAM concentrations so as to ensure that the maximal shift (e.g., the concentration of PAM above which no further shifting of the agonist EC50 will be observed) was identified in a single assay iteration for all group C GPCR PAMs tested in validation experiments. The significance of this shift detection range lies in the fact that candidate PAM compounds may be tested in the PAM CRC and agonist shift CRC assays in parallel because potency data from the PAM CRC assay are not required to set the concentration range in the agonist CRC shift assay. This, in addition to increased precision and temporal control of plate flows, constitutes a clear advantage over lower throughput manual agonist CRC shift approaches. The implication of the six-concentration automated format for production lead optimization work is a 2- to 3-day reduction in assay-to-data cycle time. In addition, the wholesale automation approach produces workflow efficiencies amounting to 0.25 full-time equivalent (FTE)/week.
A second challenge associated with creating an enhanced-throughput platform was tailoring the assay format to the unique requirements of operating in the allosteric modulator space. From time to time, compounds of this type have a certain degree of agonist-like (ago-allosteric) activity that drives activation of the cellular signal transduction pathway in the absence of added orthosteric agonist. In certain cases, this can lead to apparent desensitization of the functional response, particularly when the cellular signaling pathway incorporates Ca++ influx or release and most typically at higher concentrations of PAM compounds. Although this activity may not be universal to all targets and/or chemotypes, when taking a broad-utility platform design approach, it is important to control for the eventuality of this desensitization confound. The interplay of preread test compound incubation times and the subsequent functional readout can be a determinant of both apparent PAM potency and the relative rate of ago-allosteric desensitization. We thus chose an automation format that allows the preread PAM incubation times to be experimenter determined. In addition to PAM preincubation, the current method can be configured for direct coaddition of the PAM compound and orthosteric agonist stimulus with simultaneous assay readout, thereby reducing the impact of ago-allosterism to the maximum possible extent in the context of a cellular kinetic assay determination.
In addition to precision and throughput, another critical advantage associated with the design of the six-concentration agonist shift platform is the ability to describe the concentration-response relationship between modulator concentration and fold-shift of agonist EC50 (the so-called shift-EC50 or, colloquially, The Shifty50). This measurement opens up new dimensionality to agonist CRC shift data, which have conventionally been taken as an indicator of PAM efficacy, as they ascribe a potency measurement to the ability of a compound to induce a fold-shift. Coupled with the magnitude of the maximal shift (e.g., twofold, sixfold, etc.), we submit that the potency and efficacy of a PAM compound can be described in a context that is perhaps more apropos of the pharmacological nature of PAM compounds.
As we show here, the PAM CRC EC50 values and the shift EC50 values for given compounds are typically dissimilar, even though both measures are driven by the potency of the compound. One possible explanation is that in the PAM CRC assay, PAM compounds are dosed out versus a fixed, low (~EC10) concentration of an orthosteric agonist, whereas in the agonist CRC shift assay, the concentration of agonist varies from negligible to saturating versus a fixed concentration of PAM compound. We thus hypothesize that the PAM CRC EC50 and the shift EC50 would approach one another as the orthosteric agonist concentration approaches its EC50. However, assay interference associated with a diminished signal-to-background window as the agonist challenge concentration is increased complicates evaluation of this hypothesis under the current conditions.
Allosteric modulator programs are associated with unique challenges requiring specialized assay tools. Functional agonist CRC shift assays are a fundamental part of the toolset required to interrogate PAM pharmacology in vitro. The ability to run the automated fold-shift assay decoupled from other plate-based functional assays, the precision afforded by time-constrained automated plate flows, the reduction in dedicated FTE time associated with “walk-away” automated processes, and the universal (e.g., multitarget compatible) nature of the platform combine to yield a valuable tool for prosecuting PAM drug targets.
Footnotes
The authors declared no potential conflicts of interest with respect to the research, authorship, and/or publication of this article.
The authors received no financial support for the research, authorship, and/or publication of this article.