
Abstract
Microfluidic technology applied to on-chip electrophoresis provides high-throughput DNA or protein analysis in an automated, unattended mode, which is currently not possible with any other technology. The 5100 Automated Lab-on-a-Chip Platform automates all the required experimental steps, including sample loading from multiple sample plates, electrophoresis, staining/destaining, and detection. The analysis of the digital data is completely automated as well and the results together with all other information, such as sample names, are directly fed into a database. The article describes in detail the design of the microfluidic system, including instrumentation, chips, DNA and protein assays, as well as the structure and the main features of the software.
Introduction
Slab-gel electrophoresis was traditionally used to determine the size, concentration, and purity of analytes such as DNA, RNA, and proteins. This technique requires the performance of a sequence of manual, time consuming, and often error-prone experimental steps. The methodology inherently becomes a bottleneck in laboratories with high-sample load. Therefore, this approach is nowadays no longer adequate to meet the steadily growing demand for high quality, reproducible, automated, and high-throughput analysis of such samples driven by the pressure to increase productivity. Time to result is becoming a critical factor; therefore, it is required to fully integrate the analysis into the laboratory workflow. The electrophoretic analysis of DNA and proteins so far remained a manual, time-consuming process, whereas a high degree of automation was already achieved for other steps in the laboratory workflows, e.g. PCR reactions or protein purification. It is important to match this high level of automation and substantially increase throughput to fully exploit the potentials of new research areas such as proteomics or genomics. In addition, it is a prerequisite to increase the data quality to prevent false results and furthermore to enable completely new applications. As a consequence of high-throughput analysis, new software solutions to handle such large quantity of data are required to ease data storage, mining, and retrieval.
A significant investment was made to address this bottleneck and develop more automated electrophoretic methods, e.g. capillary gel electrophoresis, which, however, never fully replaced slab gels. The more recent development of microfluidic or lab-on-a-chip technology is capable of addressing those needs and, therefore, has stimulated a lot of academic and industrial research. 1 –6 This technology allows to actively control fluids on chips with microfabricated channels of a few micrometers in dimension without any moving mechanical parts, such as pumps, valves, dispensers, or separation columns. Microfluidic technology aims to integrate several sequential experimental steps into one process to obtain a complete “laboratory on a chip”. The potential of the methodology has been demonstrated, 1 –6 but access to the technology is limited. The 2100 bioanalyzer (Agilent Technologies, Waldbronn, Germany) was introduced as the first commercially available product based on this technology. It offers chip-based approaches for electrophoretic separations of DNA, RNA, and proteins. 6,7 In addition, it allows to perform simple flow cytometric analysis like apoptosis detection and analysis of cellular protein expression based on pressure-driven flow inside a network of microfluidic channels. 8 The 2100 bioanalyzer was able to address the need for high quality, reproducible data, and it provides some automation compared to the traditional gel electrophoresis. The analysis of a chip with up to 12 samples takes approximately 30 min. The number of samples that can be analyzed per day is therefore limited to 50 or maybe 100. However, with the growing throughput requirements and the need to routinely analyze up to thousands of samples per day, there was the necessity to further automate and significantly speed up the analysis.
Based on the same principle as the 2100 bioanalyzer, the recently introduced Agilent 5100 Automated Lab-on-a-Chip Platform (ALP) enables unattended, high throughput, sizing and quantitation of DNA and proteins, and some application use cases are outlined. 9,10 Sample handling, electrophoretic analysis, and digital data analysis are completely automated, allowing to process more than thousand samples per day. It offers unattended and highly reproducible analysis of samples from up to 12 standard well plates, in both 96-and 384-well formats. The DNA or protein samples are electrophoretically separated on-chip and detected using laser-induced fluorescence (LIF); the digital data are then immediately analyzed, processed, and stored in a database for storage, mining, and retrieval. The components of the system, including the instrument itself, the chips, the DNA and protein assays, and the data handling will be described in detail in this article.
Instrument and Chips
The 5100 instrument has a modular structure with several components that allow integrating and automating the required experimental steps, such as sample handling, electrophoresis, and detection (Fig. 1). It has a storage compartment (depot) with 16 storage places, designed to internally store in parallel up to 12 industry-standard well plates with 96 or 384 formats, the microfluidic chip, and the required reagents. The capacity of the depot allows analyzing up to 4608 samples in a single setup using 384-well plates.
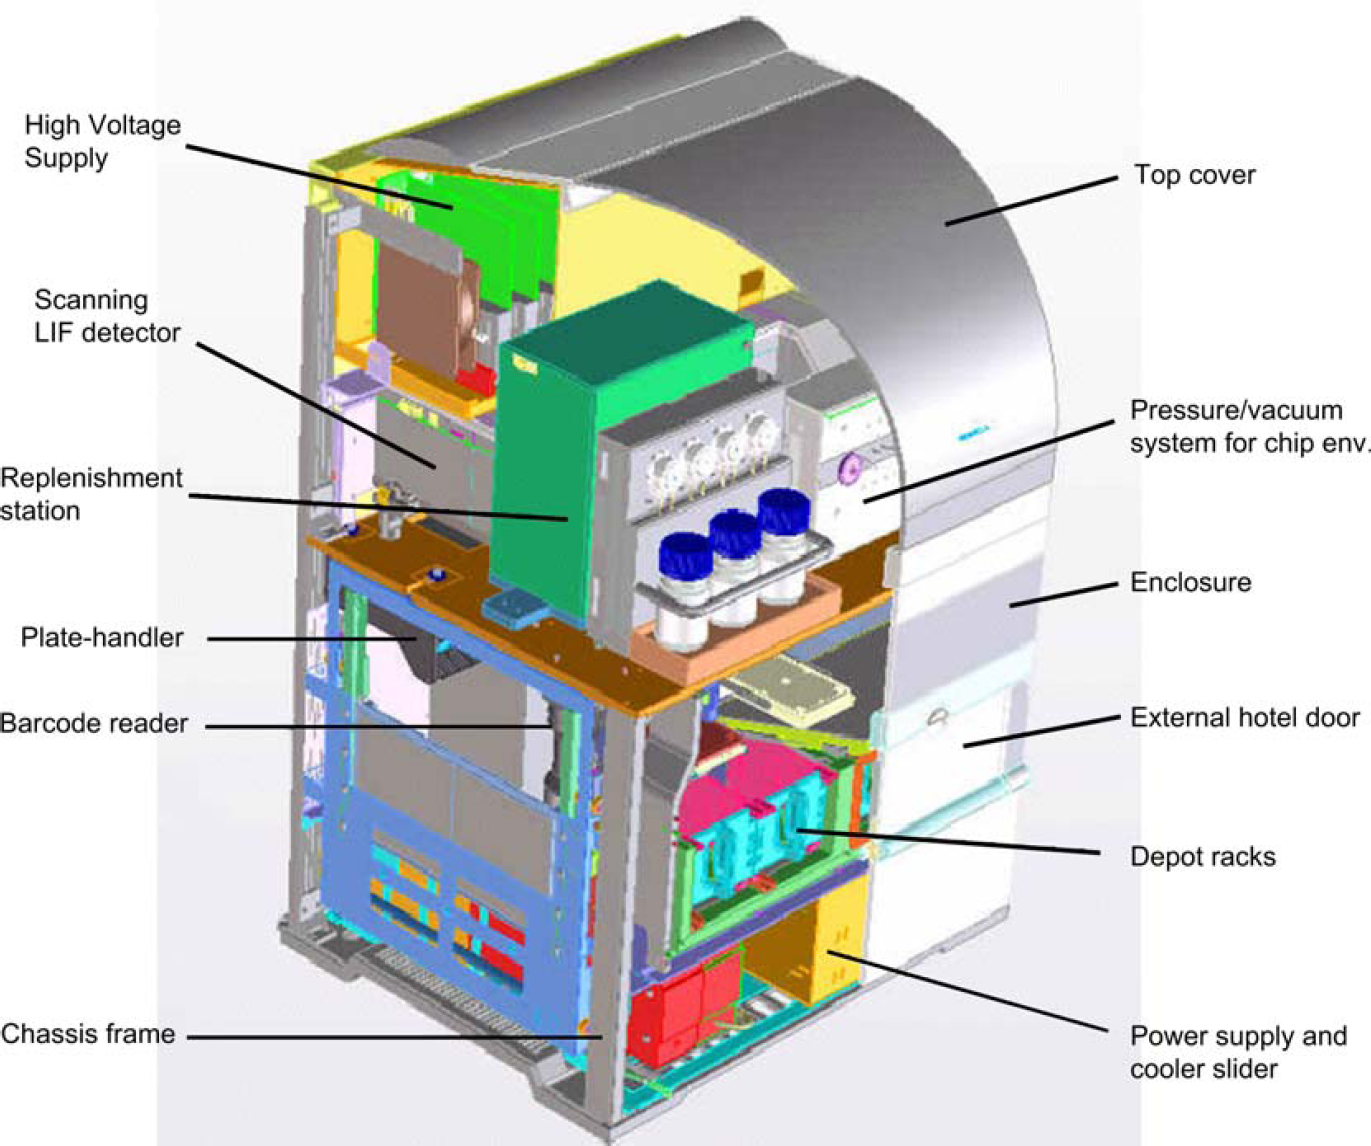
Modular architecture of the 5100 ALP instrument. The main components of the instrument are the storage compartment for samples and resources, the high-voltage power supplies, a LIF detection system, robot to move plates and chips, a pressure and vacuum system, and a pipetting station to transfer reagents.
The sample and reagent plates as well as the chip are moved from the depot to the chip environment using a built-in three-axes well plate handler with a high-quality linear stepper motor. Before the sample loading onto the chip, the preparation of the chip and the transfer of calibrants and internal standards for sizing and quantitation are done automatically using the built-in robotics, a Hamilton pipetting station, and a pressure and vacuum system (−400 to −1000 mbar). The tips for the pipetting device are also stored within the instrument. First, the channels of the microfluidic chip are filled with a mixture of a sieving matrix and a fluorescent dye. The reservoirs on the chip, and in the chip environment are filled with the required reagents for the DNA or protein analysis, such as markers (internal standards injected into the separation channels together with each sample), ladder, and buffer. Finally, the samples are automatically transferred from the sample plate in the depot to the chip using capillaries attached to the chip (Fig. 2A and B), saving operator time. While transferring the sample plate to the chip environment for loading, a bar code on the plate can be read and this information used to organize all sample-related information in the database.
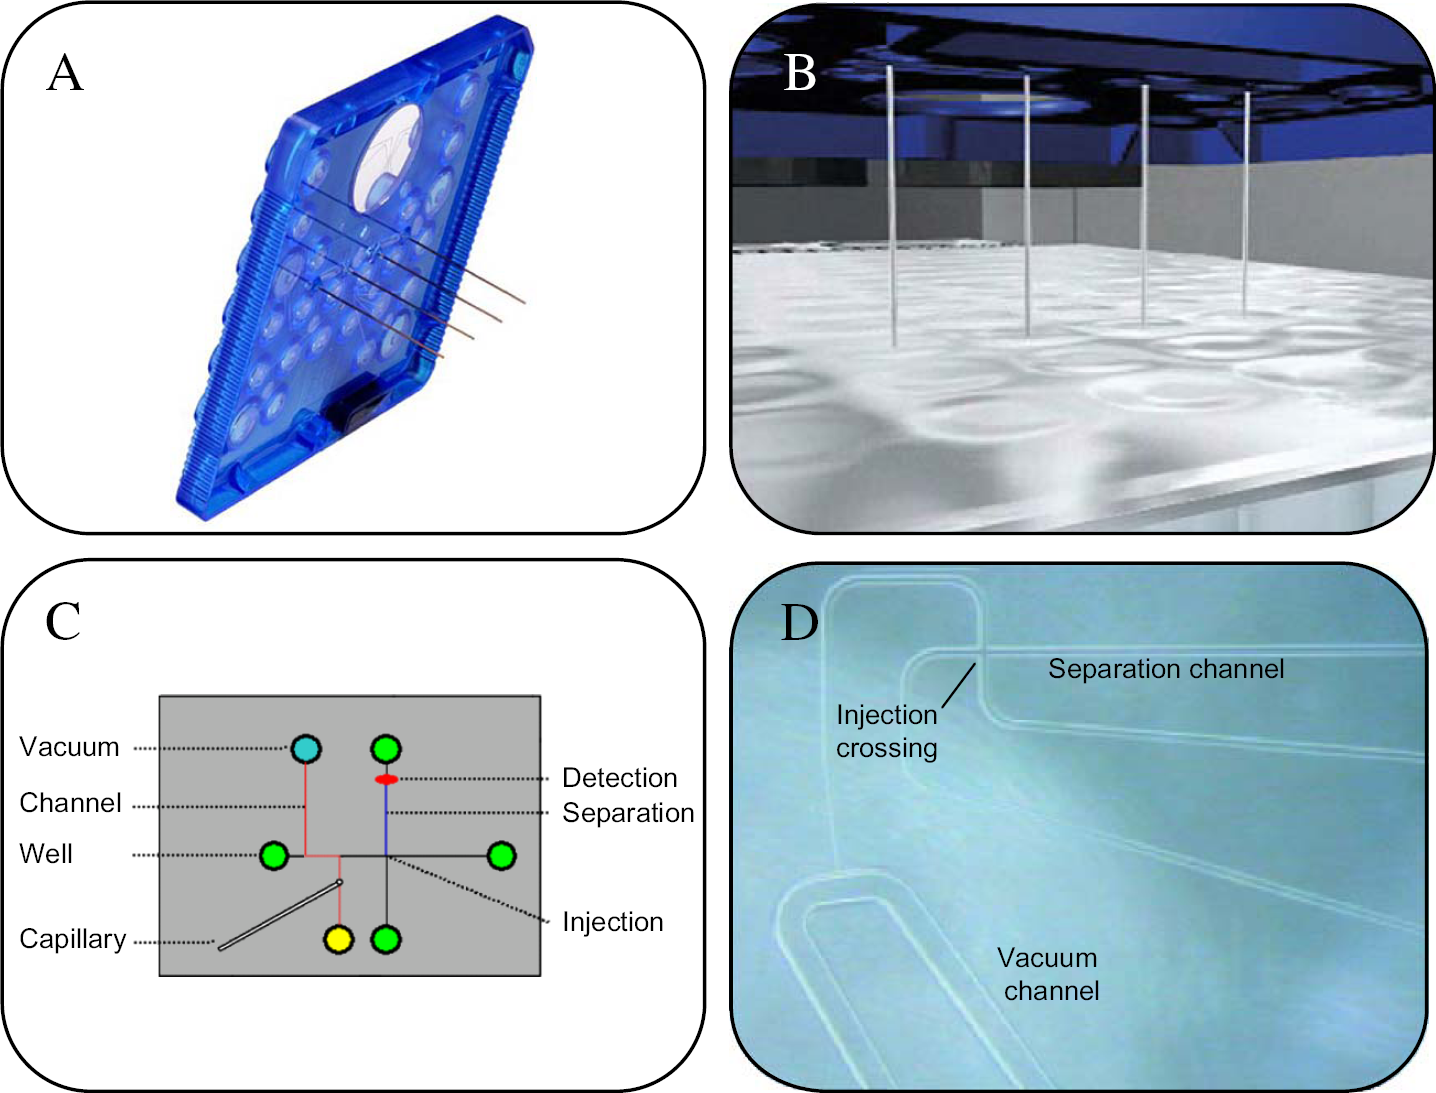
Chip design and channel layout. (A) The chip consists of a plastic caddy, which holds the glass chip. (B) The chip itself has up to four fused silica capillaries attached to it, which allow sample loading from standard well plates. (C) The capillary is connected to a vacuum system to transfer the samples from the plate onto the chip (scheme shows one of four capillary units on the chip), where they are injected, separated, and detected. (D) Image of a DNA chip with channel structures.
In between runs, a replenishment of the reagents on the chip and in the microfluidic channels is carried out. Again, this is performed automatically within the instrument, without any user interaction. To fully replenish the chip, all wells are emptied, washed with buffer, and refilled with the reagents. The channels within the chip are also filled with fresh sieving matrix during this process. The reagents for this replenishment process are stored within the instrument, large volumes in the reservoir bottles and small microliter volumes on the reagent well plate in the depot.
The microfluidic chips (Fig. 2A) consist of a plastic caddy, holding the microfluidic glass chip, with buffer and reagent wells and a large detection window. The chips used for the DNA or protein analysis have similar basic channel structures (Fig. 2C and D), because the analysis is based on the same principle. Figure 2C shows a simplified sketch of the channel layout from a DNA chip. Four of those channel systems are present on each DNA chip. The chips comprise fused silica capillaries, which are used to load the sample by sipping it from the sample plate onto the chip. A chip carries up to four fused silica capillaries, which allows loading four samples in parallel. A sample is loaded onto the chip by applying vacuum to the vacuum well (blue) and leaving the yellow well at ambient pressure (vacuum-driven flow path is shown in red). Once the sample arrives on the chip it mixes with internal standards from the yellow well, which were previously loaded onto the chip. A small amount of this mixture is then moved toward the injection point using electrokinetic forces. The injection point is the crossing of sample and separation channels. Both of these channels are filled with a polymer, which is not present in the path of vacuum-driven flow. From the injection cross, a well-defined sample plug with a few picoliter volume is injected into the separation channel by quickly switching the voltages to different wells on the chip. The sample components, double-stranded DNA fragments or proteins, are separated electrophoretically and then detected by LIF as they move past the detector.
The microfluidic system uses high-voltage power supplies (currents ± 50 mA, ± 1% and voltages 100-3000 V ± 2%) to drive the chip-based electrophoresis in the short channels to reduce the separation times to seconds per sample. Because of the miniaturization of the system, less samples and reagents are required for injection. The high-resolution separation provides narrow sample peaks and sensitive detection. It is performed using LIF and a multichannel beam scanning LIF detector with up to two excitation wavelengths and in total four emission wavelengths. This is achieved with two excitation laser sources, a red laser diode (20 mW, 635 nm) and an additional green solid-state laser (20 mW, 532 nm), which is required to perform protein analysis. Two emission wavelengths 670 ± 20 and 710 ± 20 nm, as well as 575 ± 30 and 600 ± 30 nm are available for the red laser and green laser, respectively. The maximum readout frequency is 1 kHz for one channel and the minimum scan time is 1 ms from channel to channel. The detection at two separate emission wavelengths is used to record the signal from an internal lower marker separately from the sample and the upper marker signals to provide reliable recognition of the lower marker, which is mandatory for accurate and reproducible sizing and quantitation (Fig. 4A). A signal decomposition algorithm is used to separate the lower from the sample and upper marker signals.
Assays and Performance
The 5100 ALP system was designed for DNA or protein analysis; however, both assays have slightly different requirements in terms of the instrument, the chip, and the reagents.
DNA
The DNA 1000 HT-4 assay was developed for sizing and quantitation of 25-1000-bp DNA for applications such as quality control of PCR fragments before sequencing, micro-array spotting, or multiplexed PCR (mPCR) expression analysis. Other applications are the quality control of complementary DNA libraries or screening of DNA fragments and patterns. An application example for a high-throughput mPCR screening project is outlined in Figure 3. Good size reproducibility and high resolution allows for determination of relative expression levels of the 12 genes.
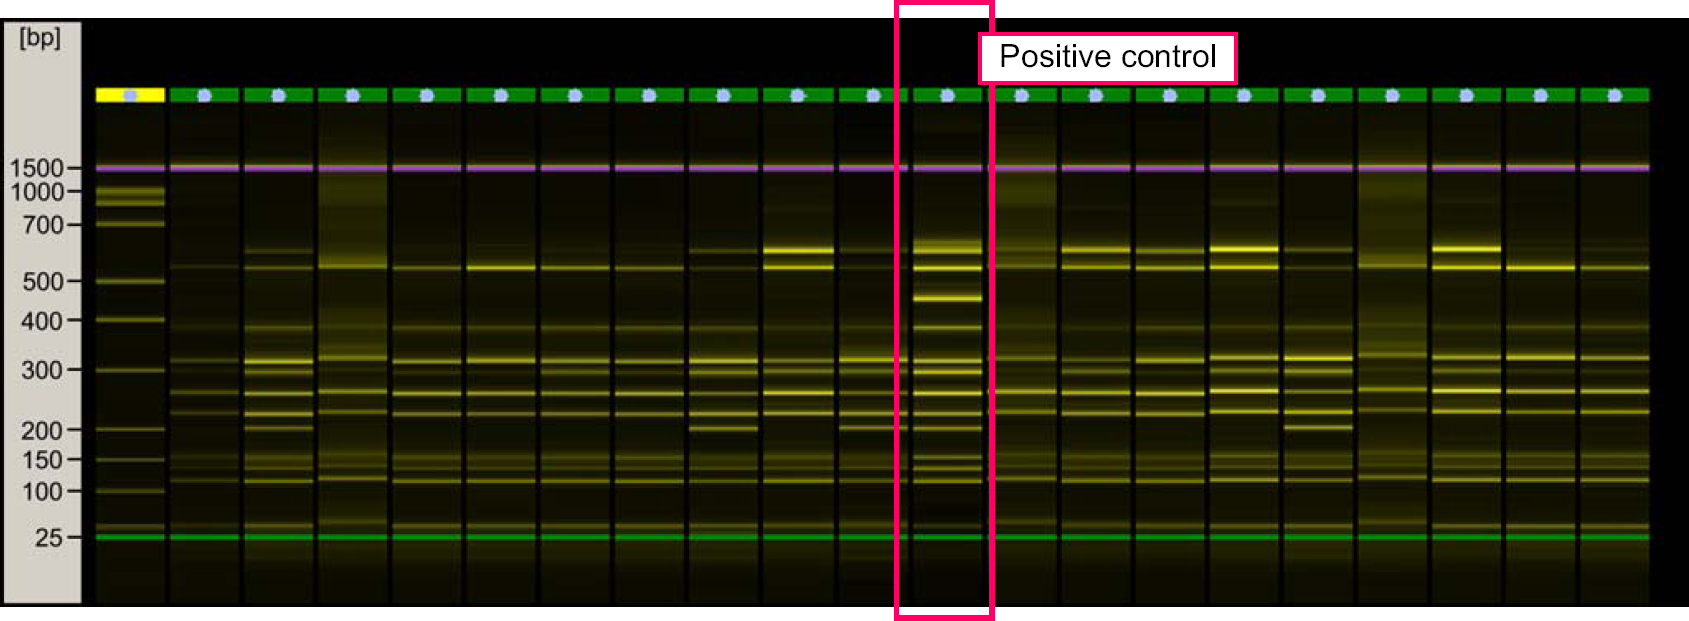
mPCR application. Subset of data is shown from on-chip electrophoresis of 12-plex PCR samples. Data were obtained in a screening project for 12 selected cancer genes in microdissected samples, patient biopsies, and cell lines (samples kindly provided by Deutsches Krebsforschungs Zentrum (DKFZ), Cancer Research Center, Heidelberg, Germany).
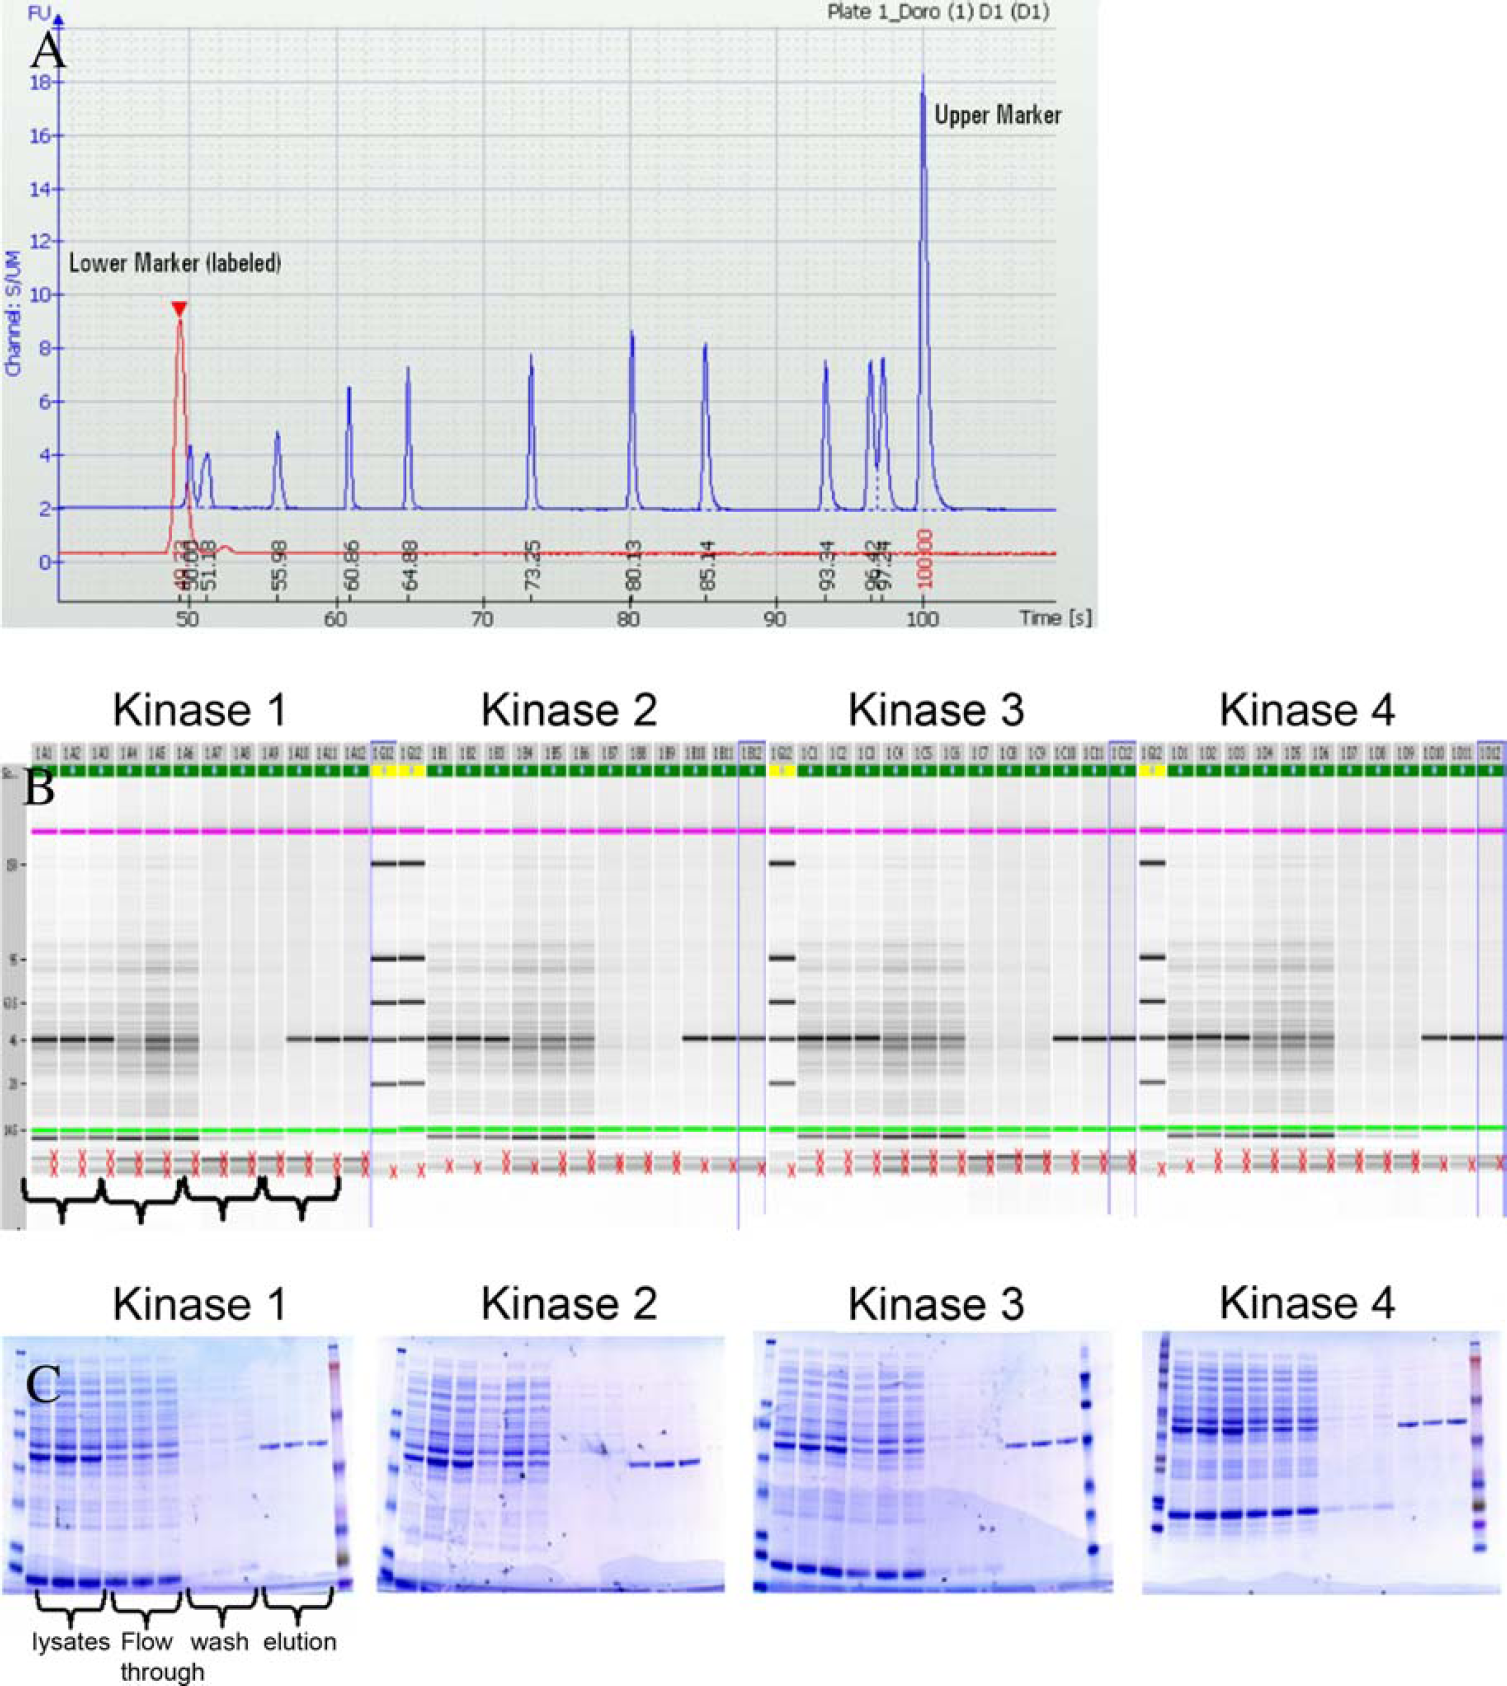
Application data. (A) Overlay of the lower marker and the sample/upper marker signals. A DNA ladder sample was analyzed, the electropherogram consists of 11 sample peaks and upper marker peak. The lower marker is detected in a separate detection window (red trace). (B and C) Comparison of SDS-PAGE (C) to gel-like images result of the ALP (B). Expression and purification of a kinase construct (four different expression clones). Recombinant proteins were His-tag-purified on Nickel-Nitrilotriacetate (Ni-NTA) columns. For each clone, lysates of cells obtained by three different culture conditions, flow-through, wash, and elution were analyzed. ALP results are automatically normalized with external and internal standards (data kindly provided by Dr. Paul Hatwin, Astra Zeneca, Alderly Park, U.K.).
The assay is based on the four-capillary DNA HT-4 chips, which allow analyzing four samples in parallel, enabling to process approximately up to 2000 samples per day. The DNA HT-4 chip has a lifetime of 6000 samples before it needs to be replaced. The DNA assay and its performance will be described in more detail in the following section.
All the reagents required for the analysis are provided. The assay requires the sieving gel, a mixture of fluorescent dye and gel, and two internal markers to indicate the lower and upper size limits during the separations. The reagents required to perform the assay need to be provided in a 96-well plate. The assay also requires a ladder, which contains 11 DNA fragments with known sizes and concentrations (4 ng per fragment). The ladder is used for both sizing and quantitation and is analyzed every 12 samples. The ladder also contains the lower and upper markers. The lower marker is a fluorescent dye, which runs approximately as a 15-bp double-stranded DNA fragment and is detected in the separate channel at 710 nm.
The DNA samples (20-60 μL) are loaded into the instrument in 96- or 384-well plates sealed with aluminum foil to prevent contamination or evaporation. However, only few hundred nanoliters of sample is loaded onto the chip by the capillary dipping into sample well. Within a single setup, a maximum number of 12 plates can be analyzed in an unattended mode. Using 384-well plates results in 4608 samples and 96-well plates results in 1152 samples. The chip, the sample, and reagent plates are loaded into the instrument. When not in use the chip can be stored at 4 °C for several months. Next, the DNA ladder is added to a specific receptacle (ladder trough) that is inserted into the instrument. At this point it is also required to check if enough pipette tips are stored in the tip container, the storage bottles contain enough buffer and water, and the waste bottle is empty. A software wizard is guiding the operator through the process to ensure that all required items are provided, before the assay can be started from the software. From now on the sample handling, electrophoresis, detection, and data analysis are performed in a completely unattended mode. Depending on how many plates are run per setup, it is possible to achieve a throughput of 1-2.5 min per sample.
The sizing and quantitation of DNA bands are based on normalization to an internal marker with known concentration and size (1500 bp) and to the ladder runs, which are performed at the beginning of each analysis and after 12 sample runs. Figure 4A shows an overlay of the lower marker and the sample/upper marker signals of a DNA ladder sample. The electropherogram consists of 11 sample peaks and upper marker peak. The lower marker is detected in a separate detection window (red trace). The lower marker indicates the lower end of the sizing range. The sizing resolution within the size range (25-1000 bp) is ±5 bp from 25 to 100 bp, ±5% from 100 to 500 bp, and ±10% from 500 to 1000 bp. The DNA assay provides high resolution compared to agarose gels, which for example is critical for the analysis of mPCR samples. The sizing reproducibility and accuracy were determined to be 3% CV and ±10% (in 95% confidence interval) between 100 and 1000 bp, respectively. The quantitation reproducibility and accuracy are 10% CV and ±30% (in 95% confidence interval), respectively. A linear dynamic range from 0.5 to 50 ng/μL was determined. The assay provides a large linear dynamic range compared to traditional gels that enables the detection of less abundant products, e.g. low abundance messages in multiplex Reverse transkriptase-polymerase chain reaction (RT-PCR) amplifications or nonspecific amplifications. The sensitivity of the microfluidic approach is approximately 10 times higher compared to that of conventional agarose gel electrophoresis. The data on performance were obtained by testing different samples (PCR fragments, restriction digests, and commercially available size standards) using a few tens of chips on four different instruments creating tens of thousands of sample runs in the database.
Protein
The second available assay is the Protein 200 HT-2 assay for identification, sizing, and quantitation of proteins from 15 to 220 kDa, which are traditionally run on analytical sodium dodecyl sulfate-polyacrylamide gel electrophoresis (SDS-PAGE). In contrast to DNA, this two-capillary chip analyzes two samples in parallel enabling to process up to 1000 samples per day. The main application areas for the high-throughput protein analysis are expression optimization, quality control, and purification analysis, e.g. tracking proteins during the purification process, as well as QA/QC of protein pharmaceuticals, e.g. analysis of antibodies. With this assay it is possible to analyze cell lysates, column fractions, and purified proteins or antibodies under reducing or nonreducing conditions. A subset of data (Fig. 4B and C) illustrate the efficient use of the system in an expression optimization project. In such an optimization project for one target protein the number of samples can easily add up to 576 (four constructs, six tags, four cell lines, three time points, two temperatures). High reproducibility of the on-chip electrophoresis data makes it possible to compare size, concentration, and purity from such high number of samples, something that can hardly be achieved by slab-gel electrophoresis.
For the protein analysis, a two-laser system is required. The Protein HT-2 chips are similar in design to the DNA chips (Fig. 2), however, they only have two capillaries and additionally integrate complex channel structures for on-chip destaining. The Protein HT-2 chip lifetime allows processing of 2000 samples. The setup of the instrument and reagents for protein analysis is comparable to those for DNA analysis. In contrast to the DNA assay, an additional sample denaturation step needs to be performed. A denaturing buffer, including the internal markers (which mark the lower and upper sizing limits), is added to the sample. The minimum sample volume required is 4 μL. The denaturation is performed with lithium dodecyl sulfate at 95 °C for 5 min. Again the use of internal and external standards, standardized assay conditions, and reagents ensure that reliable, normalized data are obtained by fully automated processing. The protein ladder is a mixture of six proteins with known size.
The markers are included in the sample buffer, which is used for sample denaturation, and are therefore premixed with the samples. As for DNA assay, the lower marker is a fluorescent dye and serves as an indicator for the lower end of the sizing window. Because the size (227 kDa) and concentration (100 μg/mL) of the upper marker protein are known, they are used for quantitation of the individual sample proteins. Excitation of the lower marker is achieved at 635 nm using the red laser and the sample peaks and that of the upper marker at 532 nm using the green laser.
To test the performance of the protein assay with the system, different sets of protein samples (cell lysates, antibodies, commercially available proteins and size standard) were run on six different instruments using 20 chips creating tens of thousands of sample runs in the database.
The sizing reproducibility across this sizing range is 3% CV. Proteins that differ by approximately 10% in molecular weight are clearly separated. The sensitivity that can be achieved is comparable or better than that of SDS-PAGE with Coomassie staining. For example, 10 μg/mL bovine serum albumin in phosphate buffered saline is detected with a signal-to-noise ratio of 3. To prevent overloading, no more than 4000 μg/mL protein should be analyzed in one sample. Because the quantitation is performed using internal standards, it is a relative quantitation. In addition, it is also possible to perform absolute quantitation with user-defined calibration standards. The linear dynamic range of the quantitation is 10-2000 μg/mL. The linear dynamic range varies slightly depending on the protein mixture and the buffer. The quantitation reproducibility that can be achieved within this range is 20% CV. Compared to traditional one-dimensional SDS-PAGE, the protein assay delivers equal sizing accuracy, better quantitation, and much better reproducibility throughout a larger dynamic range. Example data for expression and purification analysis of four kinase constructs after affinity chromatography with on-chip electrophoresis and traditional SDS-PAGE are shown in Figure 4B and C.
Depending on the setup, it is possible to achieve an analysis speed of approximately 80-150 s per sample using 12 sample plates in the 96 format. The analysis of one full 96-well plate takes approximately 90 min. This includes sample transfer, electrophoresis, staining/destaining, detection, and data analysis.
Data Analysis and Management
The large data sets generated by high-throughput analysis present particular challenges in respect of data analysis, processing, and storage. The 5100 instrument records all sample data in digital format from the moment the sample is introduced, through the automatic evaluation and processing of results. These data are transferred to a PC server making them available for long-term data storage, retrieval, and mining. The 5100 expert-HT software is based on Windows 2000/XP with an Oracle 9i database and a client/server architecture, which for example, enables data mining or remote control of an instrument being connected to local area network (LAN). The current system PC reserves more than 60-Gigabyte disk space for data in the database, which is mirrored on a second disk and can be archived on tape or DVD.
The role-based access model of the software implements security enhancements, such as unique user ID, password protection, and versioning, and provides the framework for data integrity and traceability.
Before starting a DNA or protein analyses it is required to logon to the software, connect to the instrument, and set up the analysis. This includes providing information such as plate or sample names, selecting the desired DNA or protein assay, and entering the specific plate type (e.g. Eppendorf 96-well Twin Tec or Agilent 384-plate) and plate layout used. Information on plate and sample names can be entered manually, imported, or read from bar codes. These data will be used to organize the results in the database and establish a clear chain of custody for every sample, which allows all steps in the analysis process to be clearly traced.
The software is based on setup wizards that guide the user through this process of setting up the instrument for the analysis. The structure is based on context-dependent modules that are dedicated to certain tasks, such as defining or executing an analysis and reviewing the data. The contexts also provide access to assay details or resources such as chips, users, and reporting. During this process of setting up a new DNA or protein analysis, the software also checks if each step has been correctly implemented and ensures that the required resources such as chip, reagents, and pipette tips are available for the execution of the analysis.
Once the analysis has been started, the obtained digital data are processed and reported in a fully automated manner. Results are normalized by internal and external standards to ensure high reproducibility of both sizing and quantitation. Peaks are automatically quantitated, eliminating the need for a separate quantitation, e.g. using UV spectrometry (Fig. 5). Enhanced sizing and quantitation reproducibility and normalized results allow comparison from day to day and lab to lab, which is not available with conventional slab gels. The data are available as electropherograms (Fig. 5A), plotting the change in fluorescence units over time, gel-like images, densitometric displays, and in result tables. The software also provides tools for sample comparison such as one-click overlays of electropherograms or scaling and zooming features, which allow identifying small differences between the samples.
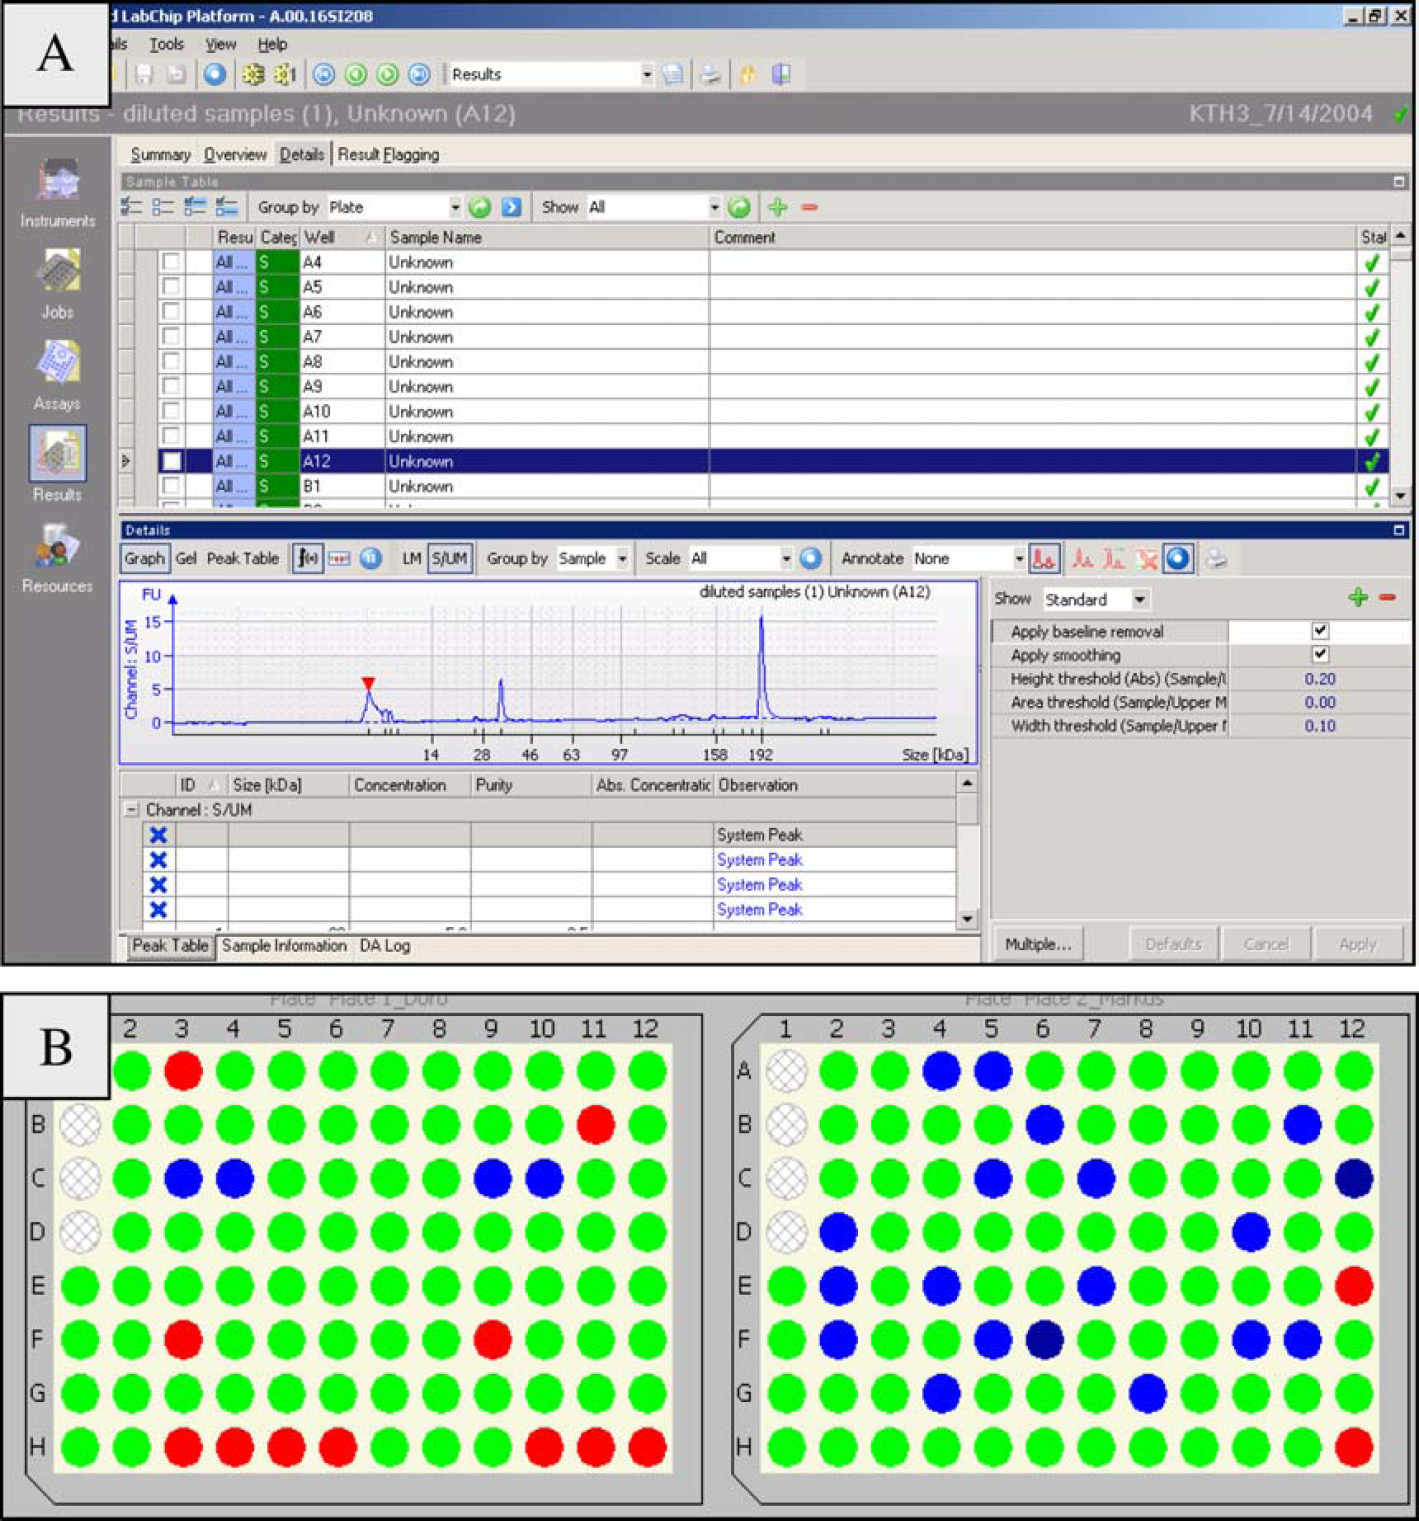
Color-coded result overview. (A) Screenshot of the software, showing the analysis of protein samples, here displaying an electropherogram. (B) Result overview for two analyzed plates. All protein samples containing 35- and 195-kDa proteins with a total purity above 80%, but not a 25-kDa protein, are marked with green in the result flagging plate overview. All samples with a purity below 80% are marked in blue and all samples without the above proteins are marked in red.
The digital data are accessible and comparable in the Oracle database for queries and data comparison in large sets. The versatile search mode for the database allows to access information that is simply not available with traditional slab-gel techniques, for example, a PCR product or a certain protein with a specific size found or not found, or any concentration above or below a certain threshold or purity. Previously, to obtain information, results needed to be manually filtered for special parameters such as size or concentration. The software replaces the visual inspection of thousands of samples with sophisticated data querying capabilities. The result flagging (Fig. 5B), a color-coded well plate overview mode, enables automatic search filters and the comparison of parameters (e.g. size, concentration, purity) or patterns for results from large data sets. It is based on a two-level analysis with rule-based identification of sample characteristics. For example, it is possible to search plates for samples containing 35- and 195-kDa proteins with a purity above 80%, but not a 25-kDa protein (Fig. 5B). If the rule applies to a specific sample it will be marked with the selected color, in this case green, in the plate overview, providing a quick overview of the success of the protein purification.
Furthermore, the export functions of the software ensure that all data and results can be transferred to other analytical tools, such as Microsoft Excel or Spotfire, to external databases, or for publications and presentations.
Conclusions
We have developed an ALP based on microfluidic technology that makes it possible to perform high-throughput, electrophoretic DNA or protein analysis in an automated, unattended mode. This is currently not possible with any other technology. The automated sample loading from standard well plate formats saves time and effort of pipetting sample into the gel wells and fits into standardization and robotics environment.
The system provides high-quality data for not only sizing and quantitation, but also determination of molarity and purity. The analysis is performed automatically and is based on internal and external standards and therefore completely independent of the operator. The bottleneck of handling large data sets is addressed with an Oracle database, which allows convenient and flexible storage and comparison of data and customizable search capabilities.
Based on this system it will be possible to expand the current application portfolio of DNA and protein analysis and address additional needs for automated, electrophoretic analysis, e.g. RNA analysis, or to have plate exchange capabilities with external robots to further expand automation and throughput.