
Abstract
The productivity challenge for life scientists is the design, execution, and analysis of high value experiments that discover or validate drugs and therapies. Compared to the electronics industry that spends $100,000 on software/engineer/year for productivity, an average life sciences company spends less than $5000 on software/scientist/year to achieve productivity. Scientists are left with a landscape of manual or hardwired informatics for integrating the lifecycle of experimentation. With the impressive advances in lab automation, miniaturization, and systems biology information, a new bottleneck to lab productivity is the informatics to leverage experiment data. Traditional informatics solutions are expensive to develop and deploy limiting the use and potential impact that software can have on productivity. Experiment design automation is a new form of software that breaks through the existing bottleneck using model-driven informatics and a combination of experimental and computational biology. The result is improved speed and quality of experiments, accelerated research, and lower operational costs.
Introduction
Life sciences product development is primarily fueled by a long process of experimentation beginning in discovery and extending through clinical. To discover and develop new products, life sciences laboratories have been forced to switch from pursuing simple drug and therapy targets to selecting targets in a network of dynamic molecular interactions. This increased complexity has translated to more physical experiments, rising research and development (R&D) expenditures, and lengthening development times. The following 2003 Pharmaceutical Research and Manufacturers of America (PHRMA) statistics bear out the impact:
R&D expenditure in life sciences is the highest ratio to sales of any U.S. industry at 17.7% of U.S. sales.
Total drug development time in years increased from 8.1 to 14.2.
Average cost to develop a new drug increased from $231 million in 1987 to $802 million in 2000.
Annual number of new drug approvals dropped from 1996 through 2002.
With falling product approval rates and increasing costs, labs are under extreme pressure to increase productivity, which means completing R&D projects with fewer, higher value physical experiments.
The product of an experiment is measurable observations in the form of data. Advances in high-throughput technologies (e.g., liquid handling robotics) and miniaturization (e.g., microarray) have increased the volume and rate of data from experiments and created the potential for a bottleneck in managing and analyzing that data. Traditionally, labs have had only two choices for informatics: relational databases and documents. Relational databases provide scalability at a cost of expensive development, limited flexibility, and poor data mobility. Documents provide flexibility and mobility but are error prone, labor intensive, and not searchable. The factors listed below have pushed the current approaches to informatics to a choking point.
Analytic complexity. Most commercial computational biology tools require programming expertise to create visualizations and simulations of experiment data. Programming expertise and development time requirements can limit availability of predictive tools and slow analysis.
Change. The reliance on relational database schemas as a basis for linking software and instruments makes changes expensive and difficult.
Collaboration. Sharing experiment data without scientific context in general purpose office applications is labor intensive and error prone.
A third form of informatics based on models is an alternative that provides the scalability and reliability of databases with the flexibility and mobility of documents. The evolution from databases and documents to robust domain-specific model-driven software use has occurred in other science-based industries. In the case of mechanical design, Autodesk of San Rafael, CA, created AutoCAD, a visual tool that first allowed two-dimensional, then three-dimensional designs captured as models to improve construction costs and quality. This innovation led to the development of a $3.3 billion market for computer-aided design (CAD) in 2003. In the case of electronic design, Cadence Design Systems of San Jose, CA, created Cadence, a visual tool that allowed circuit designs to be described in models and automated in manufacturing facilities to shrink development times. In the case of life sciences, models can be the architectural basis for a new class of experiment design automation (XDA) software providing visual tools that allow protocols and biological systems to be described, simulated, and automated to improve the speed and quality of experimentation for the benefit of accelerated R&D.
Computational biology improves prediction and analysis
Accurate experimental prediction can contribute significantly to the productivity from scientists given the right tools. For example, accurate prediction of outcomes can reduce pursuit of dead-end experiments, accelerating research while reducing costs. Additionally, if experimental parameters can be better predicted (e.g., optimal concentrations), lab resources can be used more productively (e.g., reduced reagent costs). A challenge for today's scientists is assimilating the increasing amount of biological information and experiment data to more accurately understand molecular pathway interactions and predict biological system activity.
Although there is a growing number of public knowledge bases and continuous development of new analysis methods for biological pathways, the barrier for scientists to take advantage of these pathway resources remains their ability to extract relational data and program pathway analytic routines. Even within the same organization, sharing of data and in-house developed analytic routines is not easily accomplished across projects. Pathway analytics often requires manual integration of data with general purpose analytical tools such as spreadsheets, scientific charting packages, and mathematical programming languages. Not only is this integration time consuming and error prone, but it also requires computational and programming skills for which many scientists are not trained. Many scientists rely on informatics support groups to continuously develop and modify general purpose analytics solutions. As a result, the research process is prolonged, experiment data analysis is slowed, and developed analytic routines are difficult to share.
A broader range of predictions is possible if scientists are able to access and use existing biological information and computational tools. Integrating biology databases, analytic methods, and experiment data through a single software application can be an approach enabling scientists with broader prediction capabilities. An example of this use of prediction is shown in Figure 1. Scientists using a visual computational biology tool drew a schematic representation of the epidermal growth factor (EGF) receptor pathway from a publicly available paper (left pane in diagram). The schematic was used by the software to automatically generate a simulation of the pathway without requiring the scientists to perform programming. The scientists were then able to interrogate the behavior of a pathway in preparation of lab experiments (charts in the right pane of diagram). Specifically, the scientists were able to plan concentration levels, optimal time points, and high potential targets for screens. In addition to assisting with screening, the scientists were able to use the model to differentially analyze the data from clinical trials of two distinct trial populations. The results were better planning, which ruled out unnecessary screens and eliminated portions of trials that were predicted to fail.
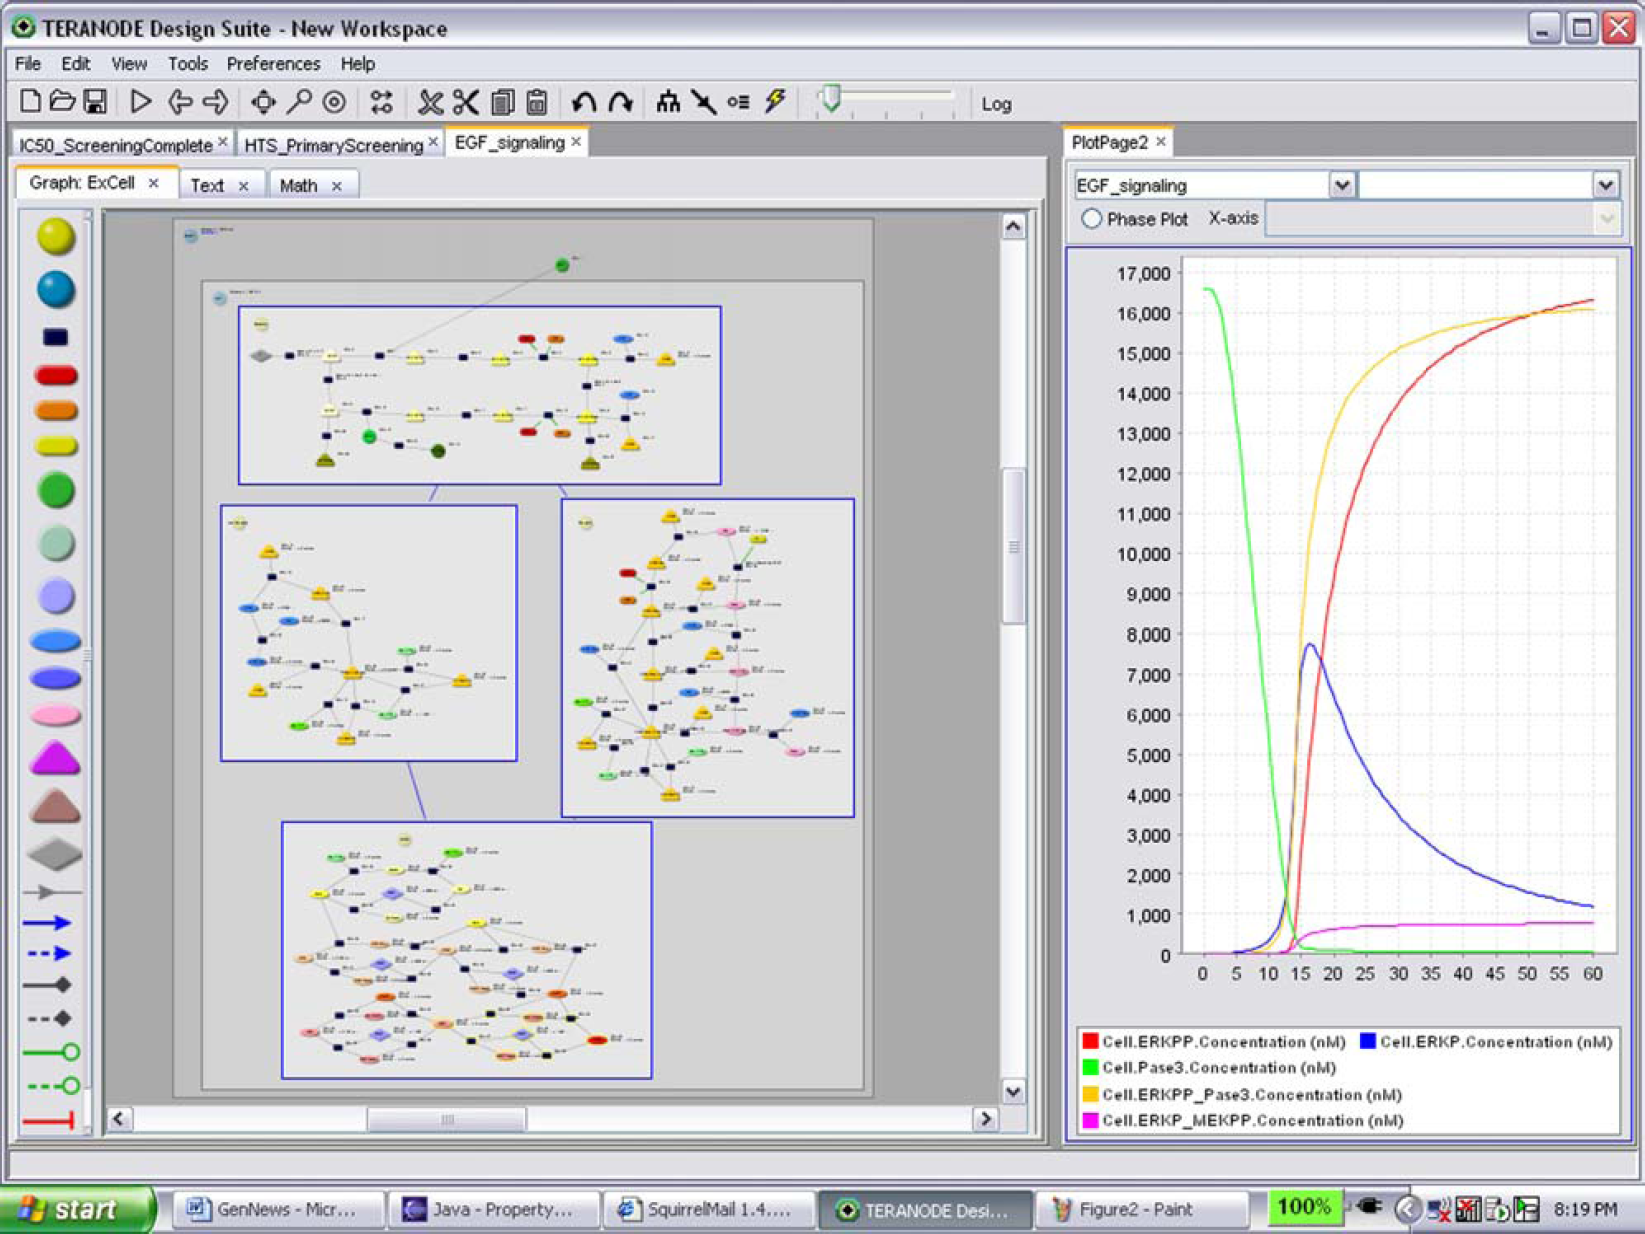
EGF Receptor Pathway in Computational Biology Tool.
Model-driven informatics improves flexibility
Laboratory productivity gains can be made by continuously refining experimental techniques and procedures (e.g., assays and array formats), using new analytical protocols, and reconfiguring instrumentation that often defies the use of traditional laboratory information management system (LIMS). Because of the required programming to build or modify a database-driven LIMS, traditional LIMS cannot cost effectively support the flexible and changing informatics environment. The 2004 Frost & Sullivan Strategic Analysis Survey of Worlds LIMS Market indicated that
LIMS implementation cycles of 18 months are perceived as standard.
Stake-holder labs have different needs.
Decreasing cost and “pain” associated with implementation would reduce the barrier to new implementations.
The database rigidity of LIMS forces either constant, expensive development, and maintenance or the use of manual spreadsheets. A lab team is commonly faced with selecting one of the two insufficient approaches: a rigid, centralized LIMS database that is incapable of supporting dynamic R&D requirements; or flexible, free-form office applications that are slow and error prone.
Model-driven informatics offers the scalability and reliability of LIMS databases, while providing the flexibility and data mobility of office applications. In model-driven informatics, models are objects that formally describe rules for data management, flow, and analytics. Once formally described, the models themselves can be automated. Rather than using a programming language and database schema, models are defined by a high-level visual design language and the system becomes responsible for schema management and automation. Consequently, experiment designs can be constantly enhanced or refined without reprogramming.
An example of the flexibility of models was apparent in a lab desiring to change the plate configuration of half-inhibition concentration (IC50) curve experiments to leverage the capabilities of new robotics. The new plate configuration would allow for arrays to be placed on 384-well plates. By using the 384-well plates, the lab would be able to generate up to 300 IC50 curves an hour rather than the current 100/day using the 64-well-plate configuration. The problem was that the LIMS database would only accept the data in 8×8 format and to reconfigure the dosage concentrations for the machine would take expensive programming. The solution was to use model-driven informatics that could visually redesign the protocol for both size and plate distribution.
Figure 2 shows a protocol design in a visual informatics tool that could be changed by the technicians in the lab without requiring programming. In the left pane of the application, scientists and technicians could schematically define the lab protocol dragging and dropping operations from the palette. Operations included sample and preparation, dispensing, incubating, measuring, and analyzing. The lines in the schematic link flow of data through the schematic logically. The design is captured as a model that in turn automates the data management, flow, and analytics without programming. Changes to plate sizes, combinatorial reformats, or measurements can be made on demand before or during experiment runs. The charts on the right hand panel show automated generation of IC50 curves. These dynamic changes allow the lab to constantly refine and optimize its own performance.
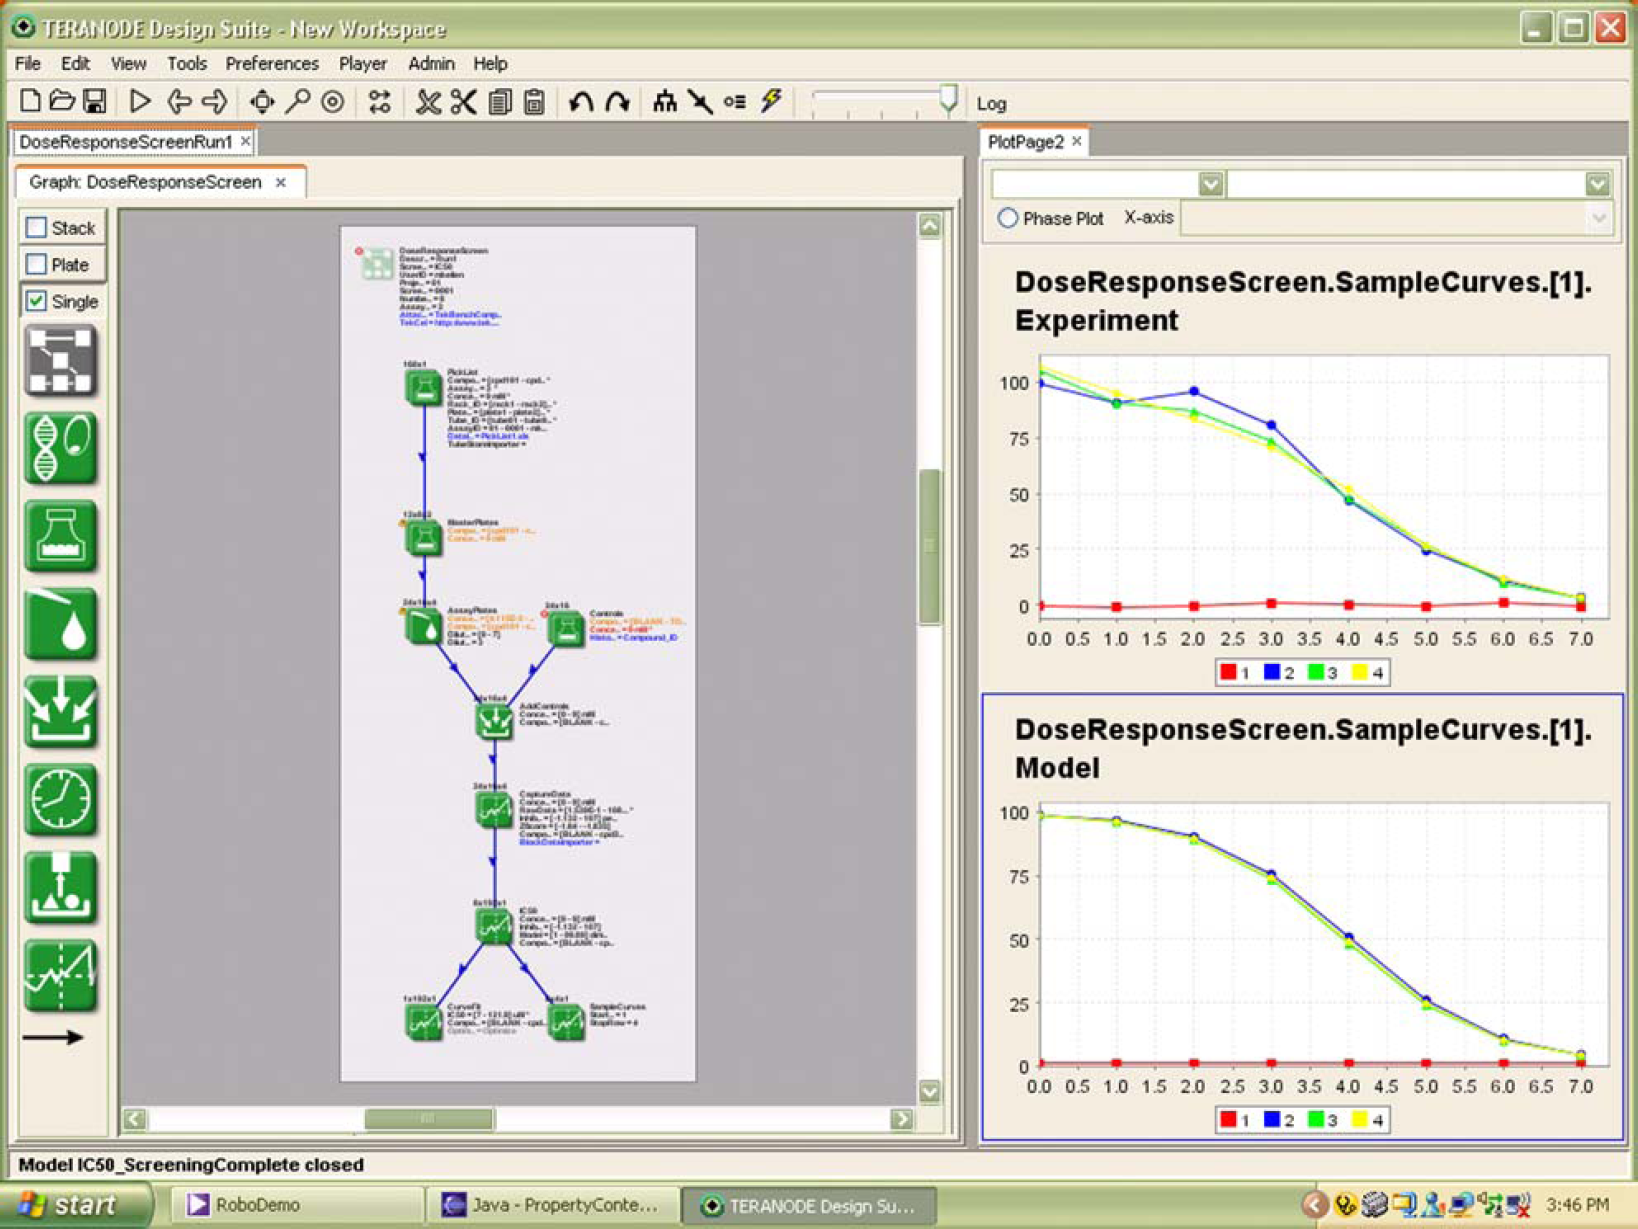
Visual Protocol Design.
Language for collaboration
Tools that provide models specifically geared toward describing data in the context of biological systems and laboratory protocols save time because they are semantically searchable and offer a direct way to communicate relevant concepts. The lack of appropriate high-level objects in general office applications creates experiment bottlenecks. For example, a spreadsheet used for laboratory protocol results in the following problems:
Spreadsheets used for data capture in a protocol are difficult to parameterize for structural changes because the formulas depend on fixed definitions such as row and columns or variable names. Change in plate layouts or the addition of a new independent variable is labor intensive for updating formulas.
Spreadsheets do not tie independent variables, raw data, and computed results together for analysis and understanding. Even if such relationships are deduced manually from formulas and other context, they are opaque to enterprise search and data mining tools. The conversion from physical data formats (e.g., plates) to analyzable data is painstaking and error prone.
Tabulated results are difficult to validate because full validation would require the independent examination of thousands of spreadsheet formulas, any one of which could be wrong. The high-level patterns and individual variances from the high-level patterns are not represented or visible in the spreadsheet model.
Consider the example of a protein chip experiment. Although the general structure of the protocol may be quite stable, the probe footprint, treatment variables, readout conditions, and analysis requirements are all subject to change. The probe designs for measuring expression levels may change as the understanding of protein interactions in a pathway evolves. The number of replicates may change to improve statistical accuracy. For the spreadsheet to be useful in sharing experiment data, it must document relationships between treatments, probes, raw readouts, and analysis of results. Continuous redesign of a spreadsheets data and formulas to accommodate these changes is costly, error prone, and will inhibit aggregation and analysis of results. In contrast, a language that explicitly represents the plates or blocks and the reformatting of samples and data as they are processed produce semantically searchable data sets, which can be highly parameterized, reusable, and fully understood by examining only the high-level representation.
Figure 3 shows a protein chip protocol for capturing expression levels given a specific treatment at varying concentrations. The schematic representation of the experiment layout is shown in the left pane of the application and statistical plots as well as data tables are shown in the right hand column. Because of the design language, a measurement captured as part of the protocol is indexed with the semantics of the experiment (e.g., probe IDs, concentration level) unlike the spreadsheet in which measurements are designated only by sheet, column, and row. Using the design language, the charts and data tables on the right hand side are dynamically adjusted to match the number of probes, replicates, and concentration levels of the experiment rather than manually adjusting an array of formulas in a spreadsheet. Finally, the language is able to provide a visual representation of data flow and linkage to the scientist making its derivation and validation much simpler than a spreadsheet with no visual links.
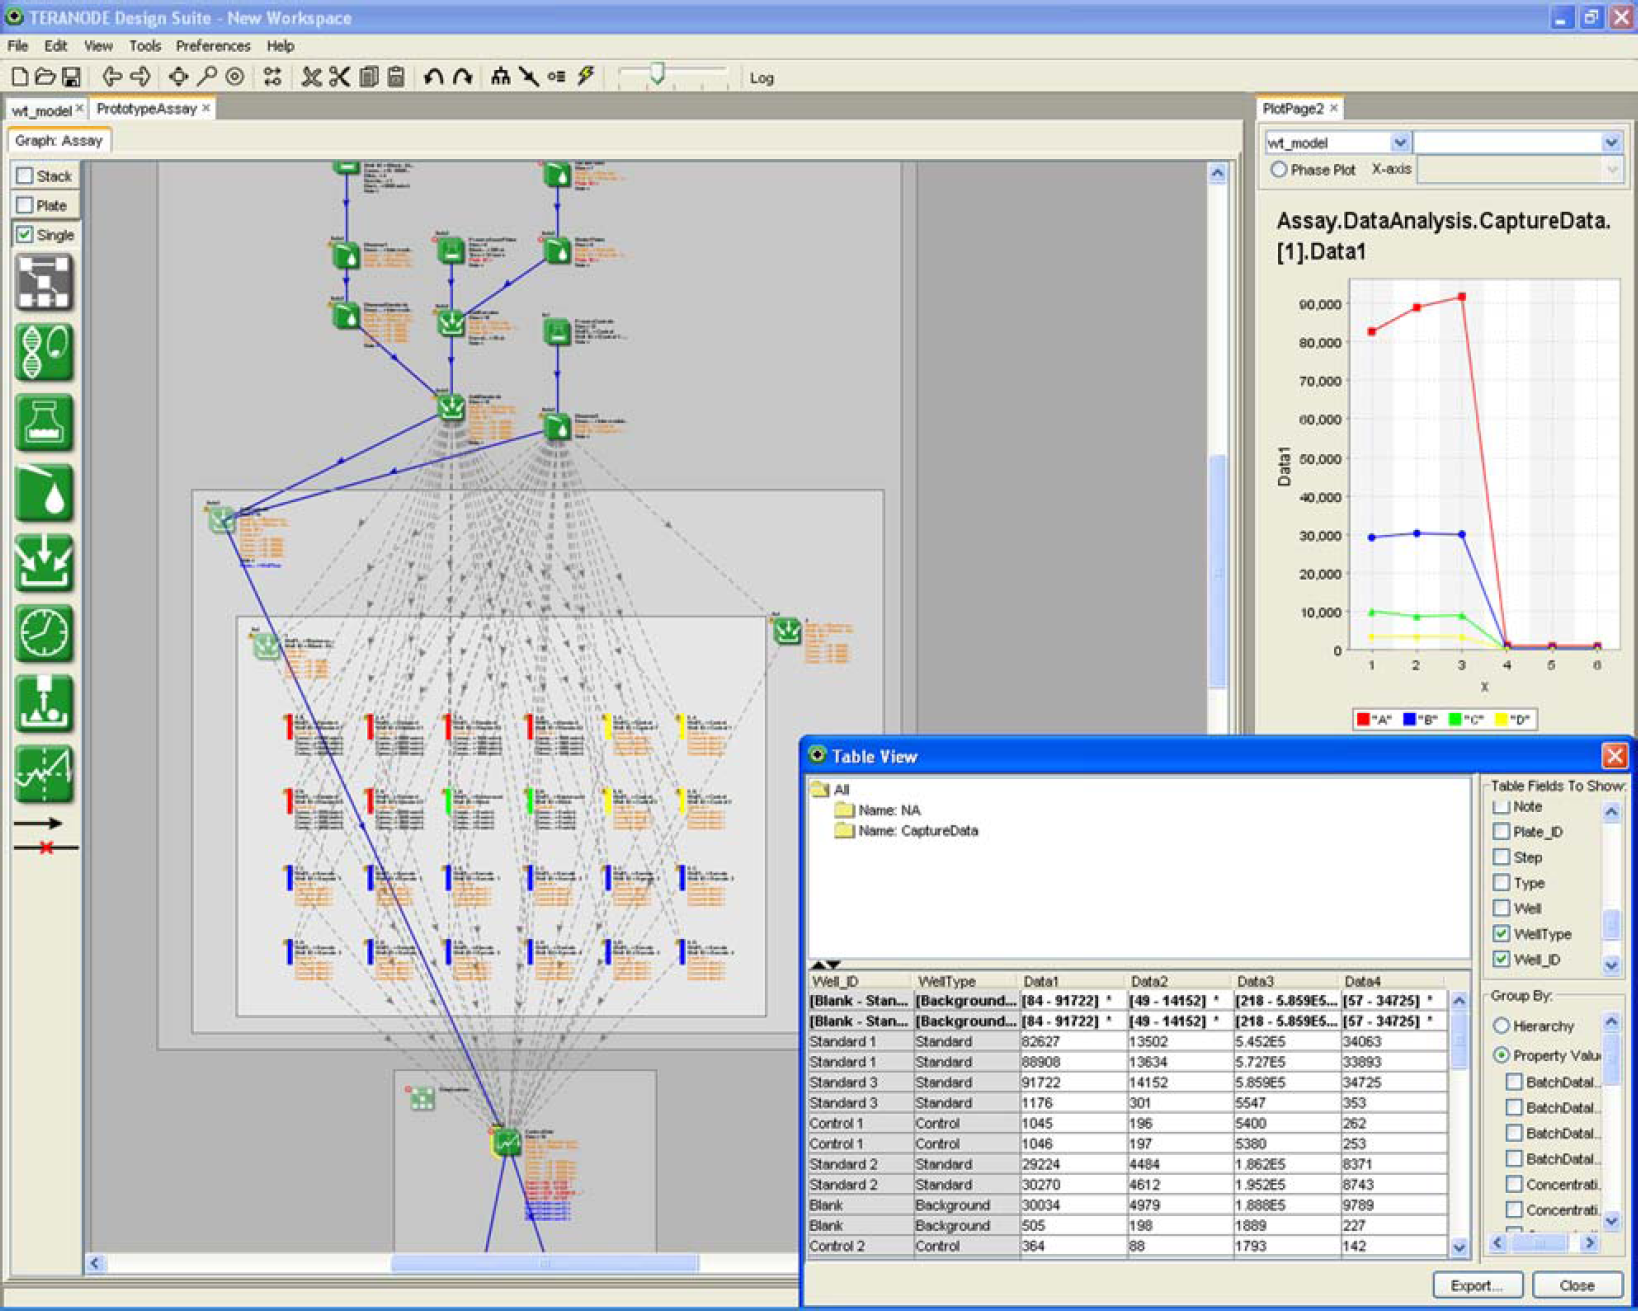
Multiple Views of Semantically-indexed Experiment Data.
Summary
Traditionally, companies have had only two choices for informatics: relational databases and documents. Both approaches create bottlenecks for R&D productivity by slowing the cycle of experimentation. Databases provide scalability at a cost of expensive development, limited flexibility, and poor data mobility. Documents provide flexibility and mobility but are error prone, labor intensive, and not searchable. A third form of informatics based on models can provide the scalability and reliability of databases with the flexibility and mobility of documents. Model-driven informatics combined with computational and experimental biology can create new XDA solutions that transform experiment design into lab automation improving speed and quality of experimentation for the benefit of accelerated R&D.