
Abstract
High-resolution ultrasonic spectroscopy is a novel technique with enormous potential for analysis of a wide range of samples and processes. This technique is based on precision measurements of velocity and attenuation of acoustical waves at high frequencies propagating through materials. It allows fast at/on line measurements analysis of formulation consistency (composition, structure) of raw materials, ingredients and intermediates, process impurity analysis, particle sizing, batch to batch variation, stability assessment etc in pharmaceutical industry. The technology can be used for static fingerprint measurements or for dynamic analysis of systems. Optical transparency is not required as ultrasonic waves propagate through opaque samples. The analysis is fast and non-destructive. High-resolution ultrasonic spectrometers were developed, patented and brought to the market by Ultrasonic Scientific Ltd. and recognised with various international awards. These instruments require small sample volumes, down to 0.03 ml, and give excellent resolution. They can be used for the analysis of composition, aggregation, particle sizing, gelation, micellisation, crystallisation, sedimentation, enzymatic activity, conformational transitions in polymers, biopolymer-ligand binding and antigen-antibody interactions, etc. This article describes main features of High-Resolution Ultrasonic Spectroscopy and area of applications of new high-resolution HR-US series of ultrasonic spectrometers.
Several applications are illustrated including the monitoring of denaturation and aggregation of proteins in antibody solution, the measurements of the particle size in emulsions, precipitation in synthetic blood substitutes and crystallisation.
Introduction
Pharmaceutical production normally involves the manufacture of the finished product, followed by laboratory analysis to verify quality. The disadvantages of this approach are associated with the requirements for continual process optimisation, recurring manufacturing difficulties, and the expense of failed batches. A novel technique, high-resolution ultrasonic spectroscopy, can address many of these concerns. It allows a fast analysis of raw materials and intermediates facilitating an adjustment of manufacturing parameters to achieve the desired quality of the final products.
Capable of dealing with a wide range of samples and dynamic processes, high-resolution ultrasonic spectroscopy is a nondestructive tool that generates product quality information in real process time ((V. Buckin et al., in Pharmaceutical Technology, Issue 12, 2002). It allows in-line, or fast off-line, testing as a primary means of process monitoring, yielding rich data on the variations stages of the process. Pharmaceutical laboratories can correlate results and the process parameters, thus optimising the effect of the process, and finished product variables. It is possible to monitor continuously the manufacturing stages and to make adjustments to ensure that the finished product will meet the desired quality and specification.
Principles
High-resolution ultrasonic spectroscopy measures the changes that take place in ultrasonic waves as they pass through materials (V. Buckin et al., in Spectroscopy Europe 15/1 (2003), pp. 20–25). Although these effects have been known for some years, it has proved difficult until recently to measure them with sufficient accuracy to resolve a broad range of molecular processes. Now Ultrasonic Scientific has managed to find answers to the problems, and it launched the world's first practical laboratory ultrasonic spectrometer, the HR-US 101, at the PittCon show last year.
The ultrasonic waves used in the spectrometer are the same as those used in hospital diagnosis and in pre-natal screening, applications where their ability to pass through opaque media without causing damage is important. The waves can also pass through laboratory samples, including those that are opaque to the electromagnetic waves used in most forms of classical spectroscopy.
PARAMETERS MEASURED IN HIGH-RESOLUTION ULTRASONIC SPECTROSCOPY
Ultrasonic spectroscopy is based on the measurements of two independent parameters, ultrasonic attenuation and ultrasonic velocity. Ultrasonic attenuation is determined by the energy losses in ultrasonic waves and can be expressed in terms of the high-frequency viscosity of the medium or its longitudinal loss modulus. This allows the analysis of kinetics of fast chemical reactions and the microstructure of materials including particle sizing, aggregation, gelation, crystallisation and other processes and characteristics. Ultrasonic velocity is determined by the density and the elastic response of the sample to the oscillating pressure in the ultrasonic wave and thus can be expressed in terms of compressibility or storage modulus. This is extremely sensitive to the molecular organisation, composition and intermolecular interactions in the analysed medium and is responsible for the major portion of applications of high-resolution ultrasonic spectroscopy for analysis of chemical properties of materials. However, wide application of ultrasonic velocity requires extremely high resolution of the measurements, which was a problem in the past. HR-US series of spectrometers with their outstanding resolution (down to 0.00001%) are the first commercial instruments that allow the user to enjoy the full potential of ultrasonic analysis.
Standard sample cells for the HR-US spectrometers are 1ml in capacity and if necessary allow the sample to be stirred. The geometry of the cells makes them simple to fill, refill, clean and sterilise. A range of cells is also available, including flow-through cells that allow the analysis to be carried out on-line, cells with automatic sampling, cells with capacities as low as 0.03ml and cells that allow non-liquid samples to be analysed. The spectrometer is sufficiently sensitive to allow the measurements of samples at the concentration as low as μg/ml range. Highly concentrated samples cause no problems. Measurements are computer controlled and the data can be output in graphical and digital formats compatible with most standard data manipulation software. Measurements can be made at temperatures as low as −20°C, and as high as 120°C. Instruments with extended temperature range are also available.
Other advantages include:
No sample preparation Minimum calibration No consumables needed No associated health and safety requirements
Overall high-resolution ultrasonic spectroscopy is a powerful tool for developing new and optimisation existing products, for quality control and for process control in production lines. It allows the user to do a whole range of analyses that currently have to be done by several separate blocks of analysis.
UNFOLDING AND AGGREGATION OF PROTEINS
A good example of the practical use of high-resolution ultrasonic spectroscopy is the monitoring of thermal transitions in biopolymers such as protein denaturation, aggregation and gelation. Figure 1 shows the ultrasonic monitoring of heat-induced transitions in a solution of antibody during consequent heating and cooling ramps between 20 and 80 °C. Antibodies of the immunoglobulin E (IgE) play a key role in the immune response to host defence against parasitic infection and in the development of allergic and inflammatory responses. These include inflammation, itching, coughing, lacrimation, bronchoconstriction, mucus secretion, vomiting and diarrhoea; all common symptoms in allergic disorders. The effective functions of all antibodies depend on their ability to sensitise cells for antigen-induced activation by binding to cell surface receptors. The ability to regulate these interactions offers the potential to control the harmful effects of IgE. Heat-induced transformations in the protein structure have a great impact on their functional properties and assessing these changes is one of most important parameters required for manufacturing of drugs and vaccines based on the antibody.
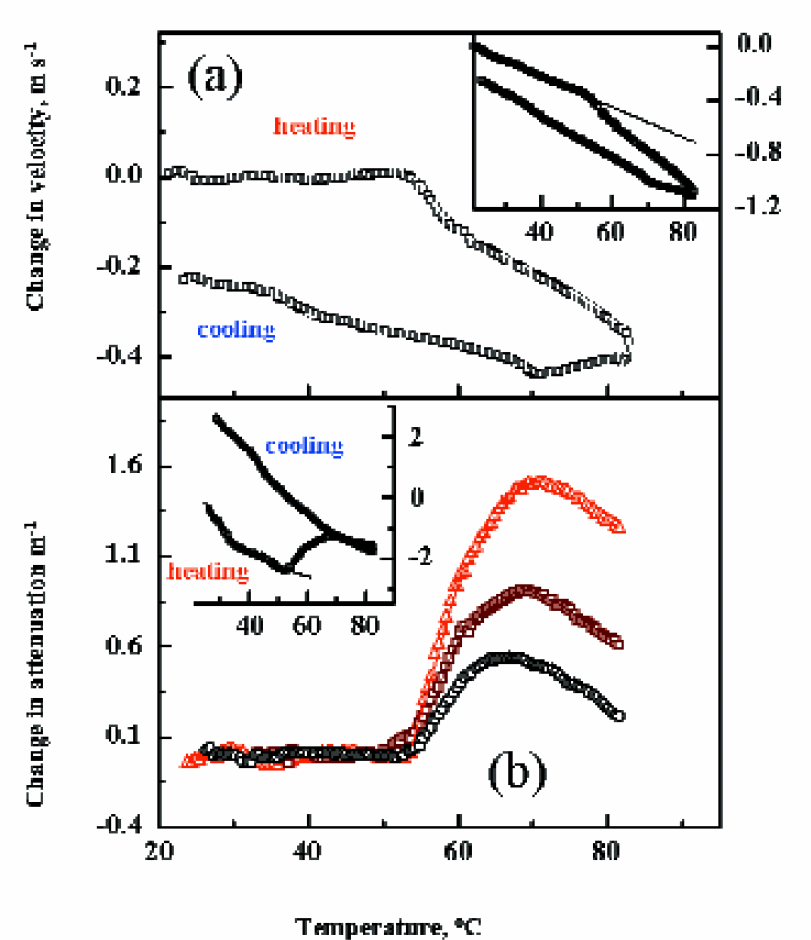
The monitoring of heat-induced protein unfolding and aggregation in solution of immunoglobulin during consequent heating and cooling ramps at 0.5 °C/min. The inserts show the ultrasonic temperature profiles in the IgE solution. Temperature dependence of ultrasonic parameters when heating between 20 and 55 °C were used as a baseline. The ultrasonic data after subtraction of the baselines are shown in main graphs.
To examine the thermal properties of antibody, 1ml of 5mg/ml solution of IgE in PBS buffer (pH 7.4) was loaded into one ultrasonic cell, and a reference cell was filled with the buffer. The ultrasonic velocity and attenuation in IgE solution were continuously monitored upon consecutive heating (at 0.5 °C/min) and cooling (at 0.25 °C/min) ramps. The inserts in Figures 1(a,b) show the ultrasonic temperature profiles in the IgE solution. As seen in the figure, relative ultrasonic velocity (solution - buffer) and attenuation decrease monotonically within the temperature range between 20–50 °C. The decrease in ultrasonic velocity (baseline) is attributed to the different temperature properties of ultrasonic velocity (such as density and compressibility) in the hydration shell of protein in comparison with bulk water. Temperature dependence of ultrasonic parameters when heating between 20 and 55 °C were used as a baseline. The ultrasonic data after subtraction of the baseline are shown in main graphs in Figure 1(a, b).
HEATING CURVES
Sharp drop in ultrasonic velocity and increase in attenuation at T∼54 °C demonstrate the heat-induced structural transition (unfolding) in the protein solution. Changes in the ultrasonic velocity can be used to make quantitative analysis of this transition. An ‘ideal’ unfolding of a globular protein (increase accessibility of atomic groups to water) will increase the value of ultrasonic velocity, because of the lower compressibility of water in the hydration shells of atomic groups in the proteins. The observed decrease of ultrasonic velocity shows that the real unfolded IgE structure has a higher compressibility compared with the native structure. This is explained by an immediate aggregation of unfolded hydrophobic parts of the molecule and the formation of hydrophobic ‘cores’, which are highly compressible. Simple quantitative comparison of observed changes in ultrasonic velocity with those measured for coil-globule transition in polymers and micelle formation, shows poor packing of antibody aggregates and significant accessibility of atomic groups of protein to water. The aggregation caused by the heat transition IgE is clearly seen on the attenuation curves (Figure 1b). The sharp rise of ultrasonic attenuation observed around 54 °C at all frequencies can be attributed to the formation protein particle aggregates. The scattering of ultrasonic wave on these particles results in the growth of overall ultrasonic attenuation. The scattering contribution is dependent on the ratio of particle size and frequency and the packing of the particle (e.g. the attenuation at higher frequencies is more sensitive to the formation of small particles). Therefore, multi-frequency ultrasonic attenuation measurements allow analysis of the particle structure and size. As also seen in Figure 1(a), ultrasonic attenuation starts decrease above after 70 °C. This could be explained by a second thermal transition in protein solution at temperatures around and above 70 °C. This second transition can also be seen on ultrasonic velocity data as an extra decrease on the heating curve and a breakpoint on the cooling curves.
COOLING CURVES
Overall ultrasonic attenuation does not essentially decrease after the cooling ramp, showing that the protein aggregates do not dissociate after cooling. Ultrasonic velocity does not return to the initial value for the native protein. This suggests the irreversibility of the heat-induced protein aggregation. A clear break-point in ultrasonic velocity at about 70 °C shows some rearrangement of the protein structure at this temperature This is not accompanied by any change in ultrasonic attenuation, showing that this rearrangement does not affect the overall the aggregated state of the protein. At about 40 to 45 °C a small deviation on the velocity curve Figure 1(a) shows a possible presence of transition reversed to the main transition on the heating curves observed at 54 °C. However the small change in ultrasonic velocity and absence of any drop in attenuation show the aggregated structure of protein at low temperatures.
As illustrated in this example, high-resolution ultrasonic spectroscopy can be used to analyse heat-induced denaturation of the protein, detect aggregation and secondary temperature transitions, characterise of the state of protein in the post-transition phase and, after cooling, verify the irreversibility of the transition.
MONITORING OF CRYSTALLIZATION
Measurement of the amount of crystallised compounds in raw materials, intermediates and batches of final products, as well as assessment of the size of crystals and interaction between crystals is an important part routine analytical in the pharmaceutical industry. HR-US series of spectrometers allow to measure the crystal grows with time, temperature or just assess the amount of the crystals is the sample.
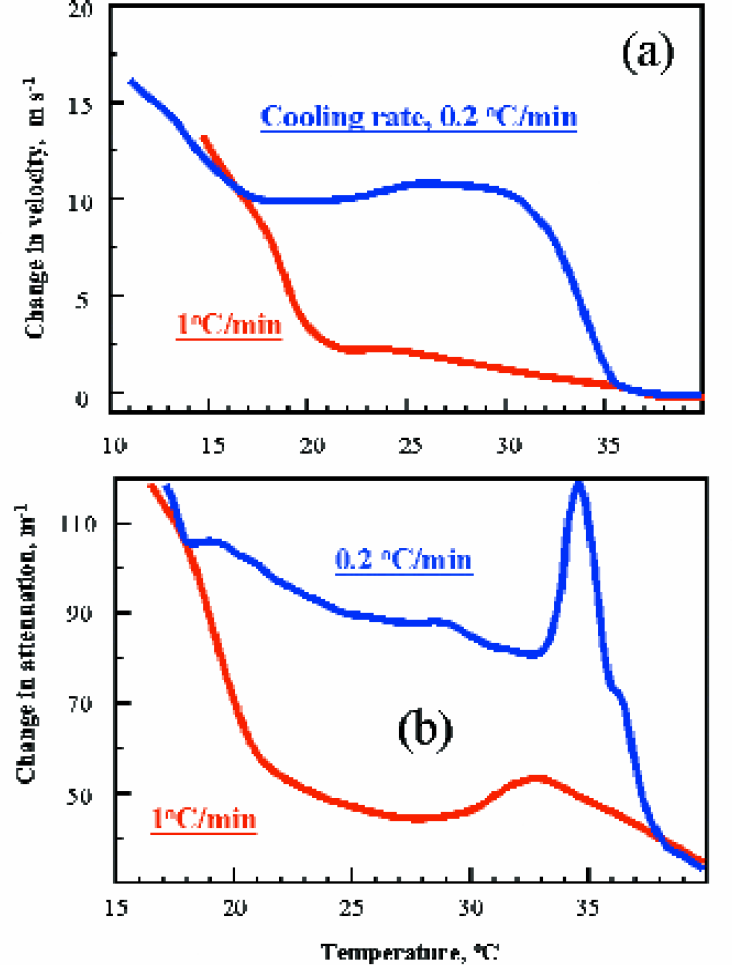
Figures 2a and 2b show the ability of ultrasonic spectroscopy to monitor crystallisation. The monitoring of crystal formation, in particular the kinetics of this reaction is essential for the optimisation of process control in the batch crystallisation of pharmaceutical compounds. In this example high-resolution ultrasonic spectroscopy is used to assess the crystallisation in palm oil subjected to different thermal treatments.
Palm oil is a complex natural oil consisting of two main triglyceride fractions, palamatic and oleic acid as well as small amount of other triglycerides and diglycerides. In this example, an ultrasonic cell filled with palm oil at 40°C. The temperature was cooled down from 40°C to 10°C at 1°C/min and at 0.2°C/min, and the crystallisation under cooling was monitored by the measurements of both ultrasonic velocity and attenuation. Figure 2 shows two distinctive transitions, one at 35°C and the other below 20°C. Both transitions are seen clearly in the slow cooling regime. High temperature transition is attributed to crystallisation of palmitic fatty acid, while low temperature point associated with the crystallisation of oleic fatty acid. Rise in ultrasonic velocity is proportional to the growth of solid phase (micro-crystals), and thus it can be used to make quantitative analysis of kinetics of the crystallisation. At 17°C, the solid fat content in the oils of the two different cooling rates is the same, as indicated by similar values of ultrasonic velocity. The crystal network formation is also shown by a clear transition resulting in an increase in ultrasonic attenuation for both cooling rates (Figure 2b). The sharp peak at 35°C shows a high cooperativity of crystallisation at low cooling rates.
Present example demonstrates high potential of new ultrasonic technique for the anaysis of crystallisation processes. Temperature transition, kinetics of the transition and solid phase content growth can be monitored easily using the HR-US spectrometers.
DETERMINATION OF PARTICLE SIZE IN DILUTE AND CONCENTRATED EMULSIONS
One of the key elements to emulsions stability is the particle size of the dispersed phase.
Batch to batch variation in particle size can lead to unpredictable variations in the life span and stability (shelf life/heat stability) of a product. Traditionally the measurement of the droplet size in an emulsion is made by optical methods. This means that the sample must be diluted to reach optical transparency and avoid multiple scattering effects.
Figure 3 shows the application of the HR-US 102 spectrometer to measure the particle size in concentrated (undiluted) water in oil emulsion and its change in the coarse of dilution. Using the HR-US 102, the size of the water droplets in the original products was measured as 0.9μm. As the product is diluted stepwise to a lower concentration where optical measurements can be performed (1% v/v water in oil), the droplet size decreases in accordance with the ultrasonic measurements. Effectively, the particles are drying out in the coarse of dilution. This demonstrates the capacity of the high-resolution ultrasonic spectrometer to measure optically opaque products in their original form and the change in particle in size in different batches without sample dilution.
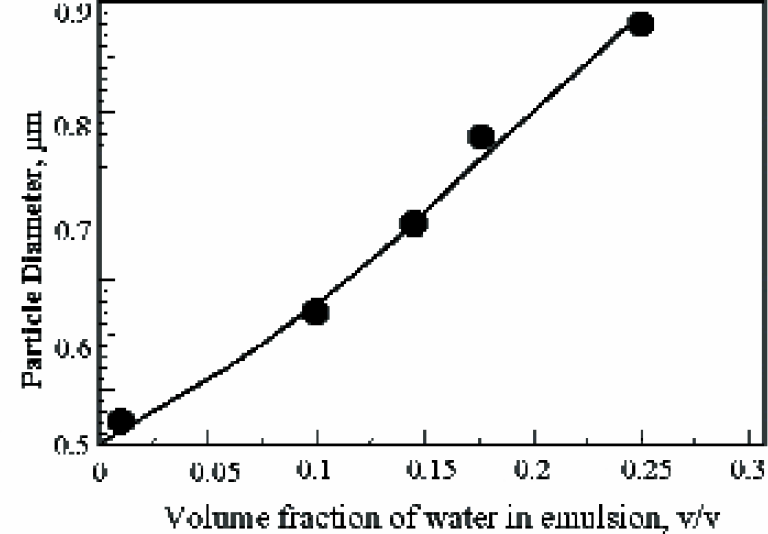
Ultrasonic monitoring of change in particle size caused by dilution of water in oil emulsion.
SEDIMENTATION IN EMULSIONS AND SUSPENSIONS
Figure 4 shows the ultrasonic monitoring of the sedimentation in perfluorocarbon emulsion. Perfluorocarbon liquids are well known for their high capacity to solubilise the gases such as oxygen and carbon dioxide. This allows the application of perfluoro-carbons as synthetic blood substitutes. Blood substitutes are typically concentrated perfluorocarbons emulsion in water. Functional properties of the emulsion are significantly determined by the stability of perfluorocarbon droplets. Intact emulsion generally consists of small particles around 100nm. The droplets size increases with the storage time. In particularly, some fast precipitation of perluorocarbons droplets is related to the growth of droplets size (because higher density of the perfluorocarbons in comparison with water). This is an indicator of the failure of functional properties of the emulsion. HR-US spectrometers allow direct validation of the changes in the emulsion structure.
In present example, 1 ml of emulsion of perfluorocarbons in water (10% v/v) agitated and loaded into ultrasonic cell. Precipitation of large particles results in the shifts of the particle distribution across the cell, which was monitored through the measurements of ultrasonic parameters in the middle of the cell (area of ultrasonic beam). The measurements were performed simultaneously at various frequencies in the frequency range 2–15 MHz. The values of ultrasonic velocity were recalculated into the concentration of the emulsion in the beam (volume fraction) and ultrasonic attenuation into the average particle size of perfluoro-carbons droplets. The results on the Figure 4 allow direct evaluation of the aging of the emulsion.
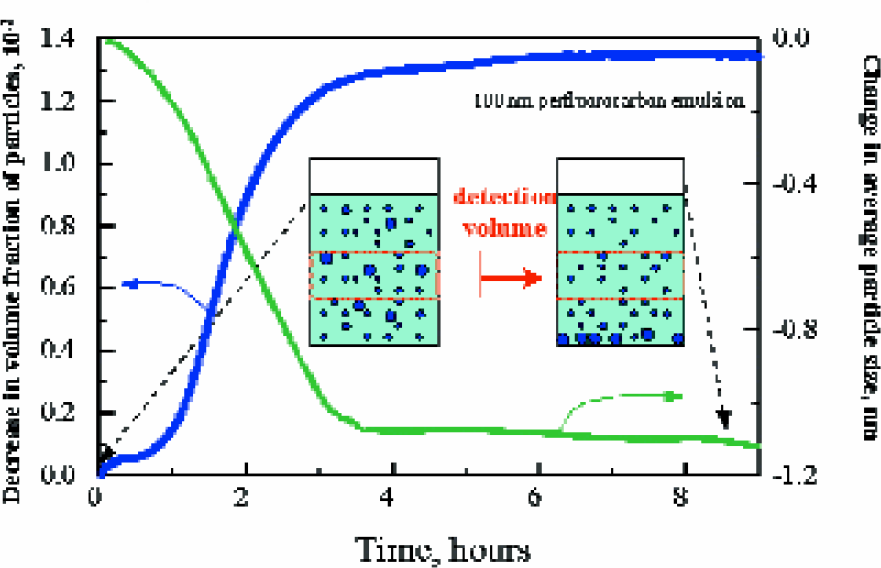
Ultrasonic monitoring of the precipitation of large particles in perfluorocarbon emulsion. The values of ultrasonic velocity were recalculated into the volume fraction of the particles and ultrasonic attenuation into the average particle size of perfluorocarbons droplets.
Conclusion
The above examples show that the ability of high-resolution ultrasonic spectroscopy to monitor both structural and molecular processes in real time in the same machine, making it a simple yet powerful analytical technique. The theory of acoustical analysis has been known for many years, but practical applications are recent and affordable laboratory-scale instruments more recent still. The arrival of such instruments opens up new possibilities in difficult-to-analyse samples. The progress in ultrasonic technology achieved is likely to have a profound impact on analytical process techniques.
Recognition of the potential of high-resolution ultrasonic spectroscopy lead to the Silver Award for best new product in the show at the PittCon given to the first HR-US series of ultrasonic spectrometers (HR-US 101) and the R&D 100 Award in 2002.
A free introduction to the principles of operation of the ultrasonic spectrometer is available directly from Ultrasonic Scientific. For a free copy please call 00353 1 218 0600.
For further information, please contact Ultrasonic Scientific, Richview Business Park, Clonskeagh, Dublin 14, Ireland: