
Abstract
This proof-of-concept paper describes the application of selective ion extraction to an assay of protein kinase A on a microfluidic chip platform. Selective ion extraction is a flux balance technique, where a combination of independent pressure control and voltage are used to selectively extract one ion from a mixture. The assay product is completely separated and diverted into a separate channel from the waste stream containing the unconverted substrate and enzyme. By detecting only product, background noise generated by the substrate is removed which increases the signal to noise ratio and assay sensitivity. This technique is intended for adapting kinase or protease assays with low conversion rates to an on-chip reaction format for HTS screening.
Introduction
Recently a new technique, called Selective Ion Extraction (SIE), was developed for separating mixtures of peptides in microfluidic devices. 1 This paper describes the application of SIE to a kinase enzyme assay on a Caliper 220 HTS platform. Serine and threonine kinases represent an excellent target for therapeutic intervention since many are involved in cell signaling and cascade pathways. These enzymes catalyze the reaction by attaching negatively charged phosphate to their target molecule. Based on the human genome project, over 800 tyrosine, threonine, and serine kinases have been identified. The recent discovery and success of Gleevec™, a tyrosine kinase inhibitor for chronic myeloid leukemia, highlights the importance of this enzyme class. 2 Several existing commercial methods for performing kinase assays involve antibodies, beads and even radioactive tags.
ENZYME ASSAY
Caliper Technologies has developed a microfluidic enzyme assay system, where the mixing, reaction, separation and analysis are performed on a chip. The basic chip used for the on-chip mobility shift (OCMS) assay consists of a central reaction channel connected to a series of side channels as shown in Figure 1. The enzyme and substrate solutions are placed in chip wells and potential inhibitors of the reaction are sipped from microplate wells. A capillary sipper introduces potential inhibitors from 384 well plates into the central channel of the chip. A robot moves the plate to the chip where short plugs of inhibitor compounds are sipped. Enzyme from a side channel continuously mixes with the plug of inhibitor prior to mixing with substrate. The enzyme reaction is incubated on-chip, while flowing continuously, for 60 seconds prior to separation of product and substrate in an electric field. Protein kinase A (PKA) was used as the model enzyme system for this experiment as described in detail previously. 3 In the channel of the chip, the PKA enzyme phosphorylates a serine reside the neutrally-charged substrate peptide, which generates product peptide with a charge of −2. After a fixed reaction time, the mixture enters an electric field, which causes the components to separate based on their charge as shown in Figure 2. The fluorescently tagged peptide substrate and product are directly detected via CCD camera following laser excitation.
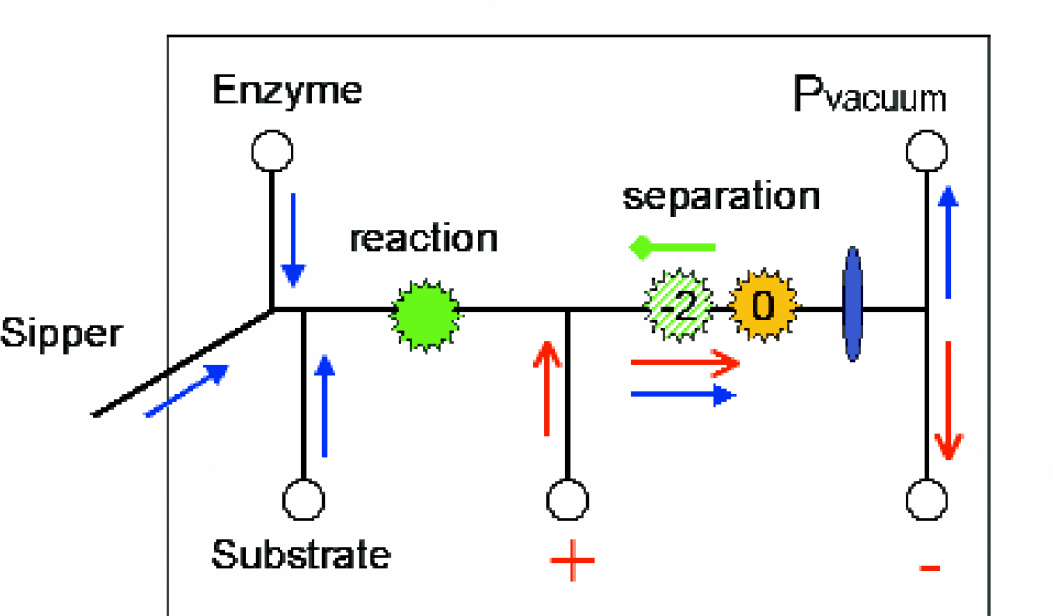
OCMS assay diagram. Enzyme and substrate are added from separate side channels producing a 20/10/70 (E/S/I) fixed dilution in the reaction channel. A vacuum applied at the end of the chip draws fluid toward the detector by pressure driven flow. (blue, closed head arrows) The fluid in the main channel has a nominal flow rate of 0.5nL/sec and average velocity of 0.5 mm/sec. For a given vacuum of −1 psi, the enzyme and substrate incubate for 60 seconds prior to entering an electric field for separation. Electrodes in side wells were configured high voltage to low voltage, which generates electroosmotic flow, (red, open head arrows) in the same direction as the pressure driven flow. The detector is located late in the channel to maximize the separation of product (Z = −2) and substrate (Z = 0), which is determined by the individual electrophoretic flowm. (green, diamond head arrows).
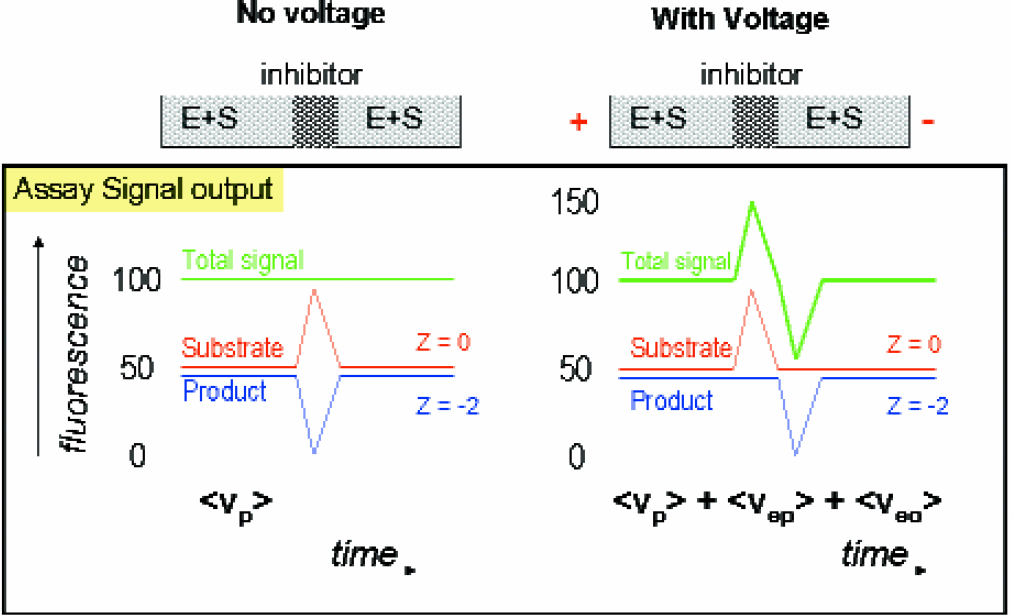
The mobility shift principle illustrated with PKA product and substrate. Both the substrate and product of the kinase reaction have unchanged fluorescence levels but different charges. A plug of inhibitor stops the local conversion to product.
A known 100% inhibitor for PKA is used to create a peak and dip in signal for a reference for scoring the inhibitory strength of potential target compounds during screening. These inhibitors disrupt the steady state conversion of substrate to product in the channel, which is detectable only after the electric field in the separation channel modifies their respective migration velocities. The reaction time, defined as the travel time in the field-free channel, is normally 60 seconds, but can be varied via pressure adjustment.
SELECTIVE ION EXTRACTION TECHNIQUE
The selective ion extraction design (Figure 3) relies on elements of the on-chip mobility shift assay and exploits the difference in electrophoretic mobility to remove substrate from the product. The OCMS assay method described above provides high data quality with reproducibility. 4 Since the assay products are detected directly, the assay data quality does not suffer from artifact signal as may be present with indirect assay methods. The OCMS format performs best for enzyme systems that can catalyze a 25% or greater conversion of substrate to product in 60 seconds. As the conversion level decreases, the corresponding peak and dip signal shrinks into the background of the substrate signal noise. The SIE technique was designed for separating the fluorescent substrate signal, which constitutes noise, from the desired product signal. 1 With this approach, the enzyme conversion inhibition could be quantified at conversions where optical noise becomes the limiting factor.
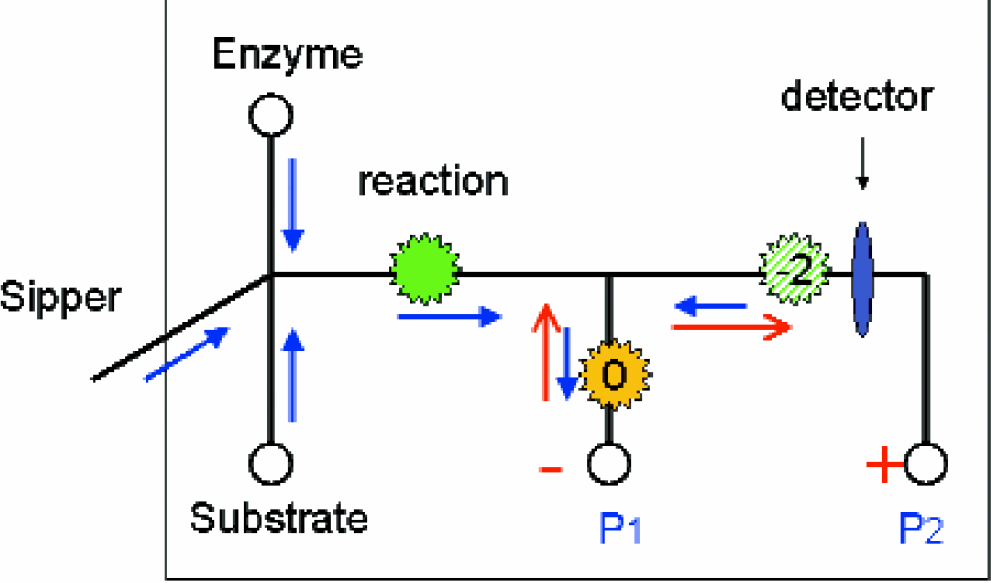
SIE assay diagram. The enzyme, substrate, and reaction sections are identical to the OCMS asssay. At the outlet of the reaction channel, 60 seconds after substrate mixing, a side channel collects the reactants, which flows to a waste well. The main flow is from the reaction channel to the first side arm. By applying an appropriate electric field, the product is extracted past the detector to the downstream electrode. A simple species balance determines which ions reach the detector. The product is represented by the “−2” marker and the substrate by “0”, both of which refer to the overall charge on the peptides. (pressure-driven flow, closed head arrow: electroosmotic flow, open red arrow)
Experimental
A series of experiments were performed to validate the SIE technique for quantifying inhibitor potency against a kinase enzyme system. SIE is a flux balance technique that depends on a difference in the electrophoretic mobility, μep, of the product to separate it from the substrate. For illustration, consider the case of a neutrally charged substrate and negatively charged product entering the separation junction. (Figure 4).
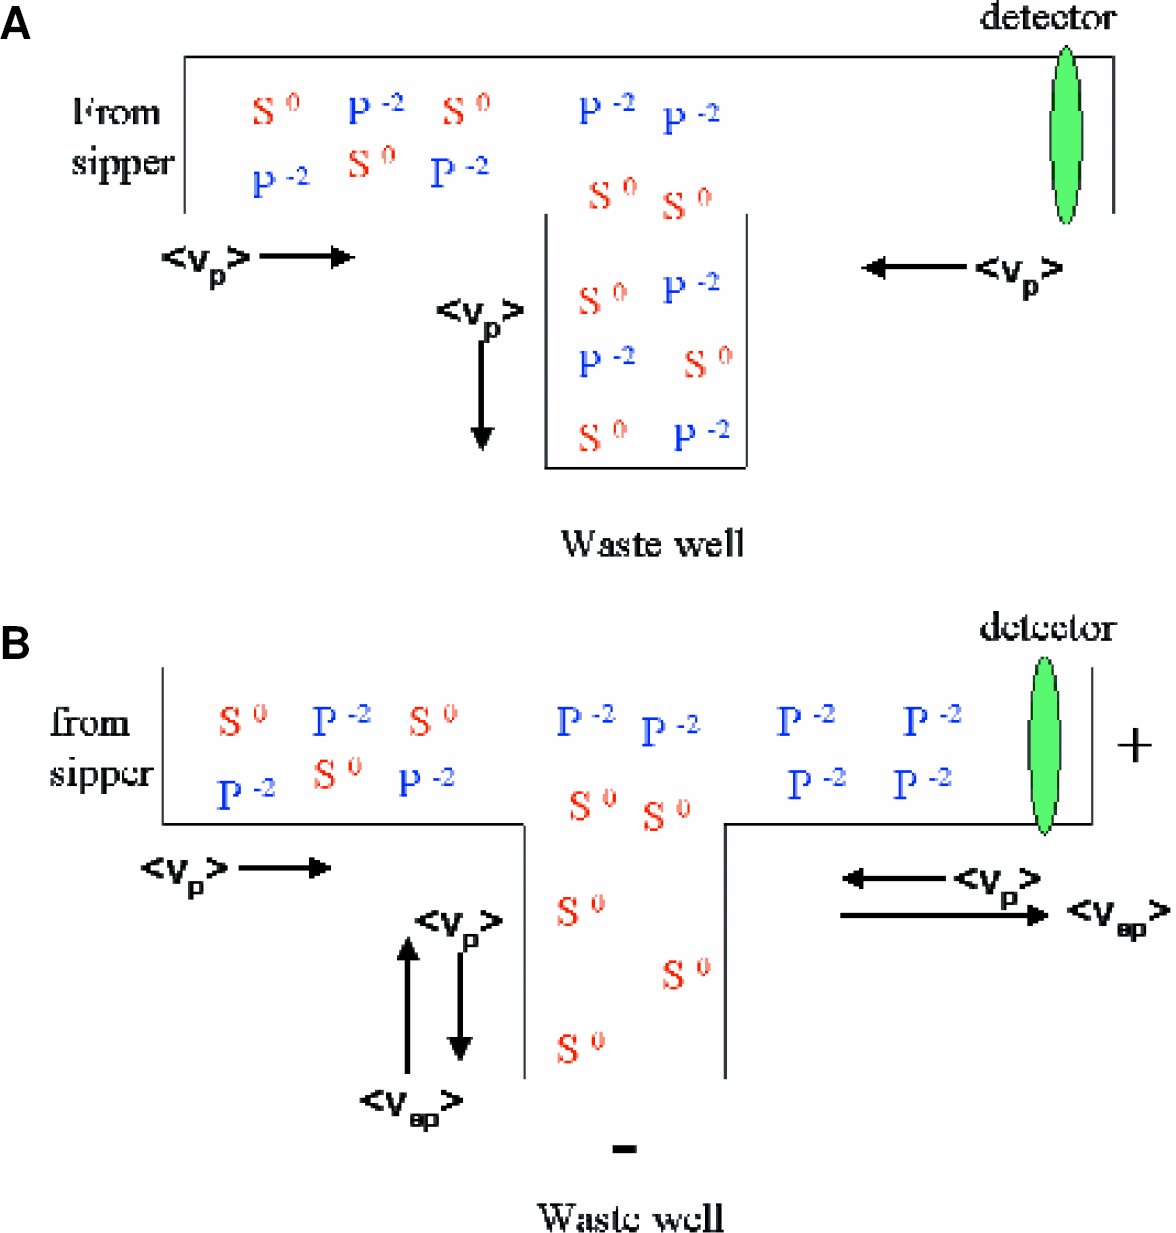
The SIE separation junction. A mix of substrate (Z=0) and product (Z=2) enter from the reaction channel on the left and flow down to the side arm.
We have previously measured the mobilities in the assay buffer used for the enzyme reaction at pH 7.5. Plugs of the product peptide and a neutral peptide as a control marker were injected electrokinetically into a straight channel of a glass microchip. An optical detector measured the peak arrival times at a known distance from the point of injection. The velocity for each peak was calculated for six trials over a range of electric field strengths from zero to 750 V/cm. A linear curve approximation was fitted. The slope of the line for the neutral species provided the electroosmotic mobility, which was subtracted from the slope of the product species to provide the electrophoretic mobility.
APPARATUS
All experiments were performed with a Caliper 220 high-throughput screening system (Caliper Technologies Corp., Mountain View, CA) or a modified Caliper 220 equipped with a custom made multiport cartridge designed for single sipper chips. These systems are designed to provide a complete, integrated solution for high-quality primary or secondary assay screening. Both systems include automated sampling robotics, a laser-based optical detection system, and a complete software package for control and analysis. The three-axis robot stage (Parker Automation) moves the plate and positions the 384 well plates for the stationary sipper chip. Although this research model is not equipped, a Twister™ robotic plate handler (Zymark) is available for multiple plate screens.
MULTIPORT IMPLEMENTATION
The SIE technique requires a multiport controller capable of independent pressure and voltage control, design of a SIE chip to accommodate a range of electrophoretic mobilities, and an electroosmotic flow suppressing coating for the walls of the quartz channels. The details of universal multiport system capable of controlling pressures and voltage on multiple wells in a lab-on-a-chip microfluidic device were previously described in detail. 5 Briefly, the multiport is capable of applying +5psi, +3000V or +30uA to all eight chip wells independently. Users without access to this instrument can implement a similar control system using off-the-shelf components. Figure 5 shows the layout of the chip designed specifically for SIE use.
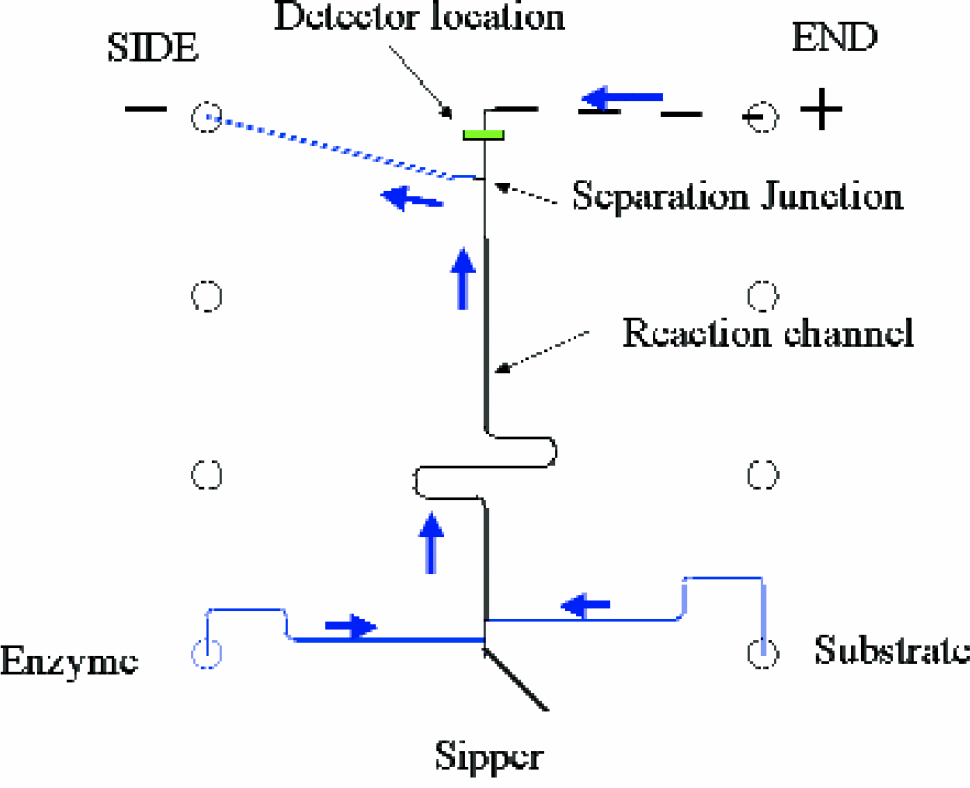
Diagram of the SIE chip. Arrows indicate the normal direction of flow during SIE operation. The double-depth chip consists of a 20-μm Sipper™ capillary for sample introduction onto the chip, a well for enzyme and substrate introduction and two waste outlets. Samples are sipped from a microplate by applying a steady vacuum to wells indicated “SIDE” and “END” such that the incubation time in the reaction channel remains constant. The product is selectively removed from the flowing mixture at the separation junction by an applied electric field between the two wells. The applied potentials are configured to separate products of kinase reactions, which are more negatively charged than the starting substrates.
Results and Discussion
SIE CHIP
Since the enzyme reaction is occurring on-chip, maintaining a consistent reaction time in the reaction channel is critical. A constant incubation time in the reaction channel is achieved by fixing the node pressure at the separation junction by adjusting the pressures applied to the side and end wells of the chip. A constant node pressure maintains a constant reaction time, which can be adjusted up or down if desired. Since the resistances of all channels are known, we calculate the pressure pairs that allow us to control pressure-driven velocity in the two side arms while maintaining a constant velocity on the input arm. An example of the pressure model at a constant voltage is shown in Figure 6. The measured electrophoretic mobilities are input to the model along with a separation voltage, which is converted to electric field strength. The chip was designed to separate peptides with a mobility difference of 5.0e-5 cm^2/Vs or greater, which accommodates most of the commercially available kinase peptide substrates. From a separate experiment, Figure 7 demonstrates the selective separation of the substrate from the product by injecting a series of plugs with known composition onto the chip. Essentially no substrate is registered at the detector.
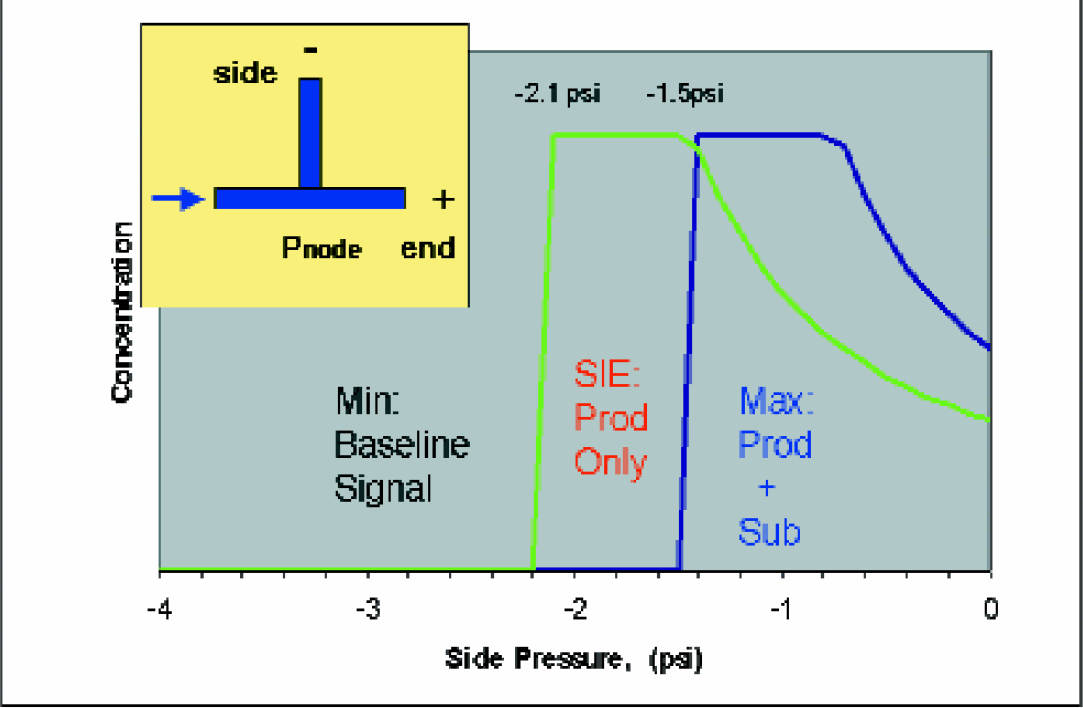
For illustration, PKA substrate and product are used as examples at a fixed voltage. We have defined three regions of operation for our chip. Each region is named for the result generated at the detector, located after the separation junction as shown on the inset. a)
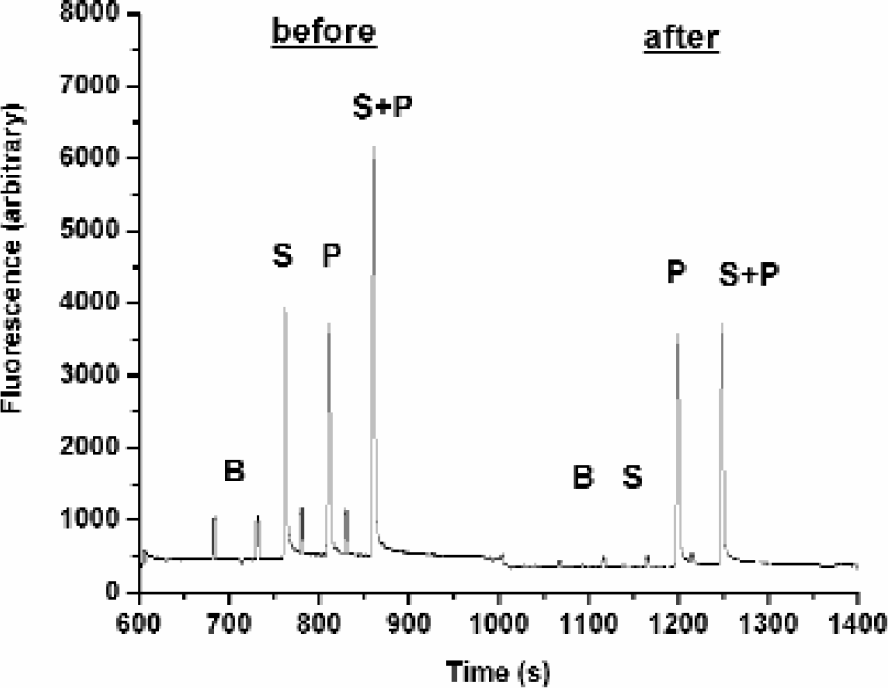
Substrate diversion to the side arm under SIE conditions removes the background signal. Fluorescence intensity peaks of PKA compounds recorded before and after the tee separation junction: B, buffer; S, substrate; P, product; S+P, product and substrate. Chip end pressure is constant at 0.5psi. Voltage is constant at 2800V. Pside = −1.0psi. At the reduced pressure, reverse flow is −0.24nL/sec against forward electrophoretic flow of 0.32nL/sec. Only product reaches the detector. The small peaks seen in both the before and after regions are fiducial marks created when the sample plug was sipped into the chip.
A pressure scan provides a quick and easy way to verify the SIE settings of voltage and pressure applied to the chip for any given substrate and product pair. While sipping product continuously in a chip filled only with buffer, we scanned through the pressure settings calculated by the model. The chip was cleaned and the process repeated for the substrate. The SIE separation window is then empirically determined, which accounts for variations in the buffer conditions, coating thickness, or peptide mobility that are unknown.
CHIP COATING
We have chosen to use coated chips primarily for the control of electroosmotic flow on the chip. The surface properties of bare quartz channels can change over time and lead to electroosmotic (EO) flow fluctuations, which adds an uncontrolled third velocity to our SIE calculations. A number of groups have demonstrated techniques for coating channels, which are resistant to chemical erosion while suppressing EO flow. 6 , 7 , 8 While each coating type has advantages with respect to manufacturability and durability, we demonstrate our SIE concept using chips coated with crosslinked PDMA. EO flow in these chips averages (2.5 ± 1.0) e-6 cm^2/Vs over four hours for the buffer used in this assay. The procedure for determining the EO flow in planar chips described above was modified slightly for the sipper chip design. EO flow was measured using sipped plugs of fluorescein and neutral BODIPY fluorescein arginine in 100mM HEPES at pH 7.5 while voltage was varied from zero to 3000 volts.
Pressure-driven flow needed to move the neutral species was constant at 0.5 mm/s. The optical detector measured the peak arrival times at a known distance from injection. The peak velocity was calculated in six trials over a range of electric field strengths from zero to 350 V/cm. A linear curve approximation was fitted to find the slope of the line for the neutral species. This provided the electroosmotic velocity, which was subtracted from the slope of the product species to provide the electrophoretic velocity.
ESTIMATING ASSAY CONVERSION
Enzyme conversion is estimated by adjusting the pressures in the chip to move through each of the three operational states described in Figure 8. The total fluorescence of the assay is measured for 30 seconds by flowing both the substrate and the product past the detector region such that no dilution occurs when passing the SIE junction. Next as determined by the model, a high vacuum is placed on the side arm which moves buffer back past the detector to establish the background signal. This step requires 400 seconds to allow the fluorescent peptides introduced in the first step to be backwashed. Lastly, the pressures are set for SIE conditions where only product is selected. The percent conversion is calculated by expressing the average fluorescent signal as a percentage of the total signal.
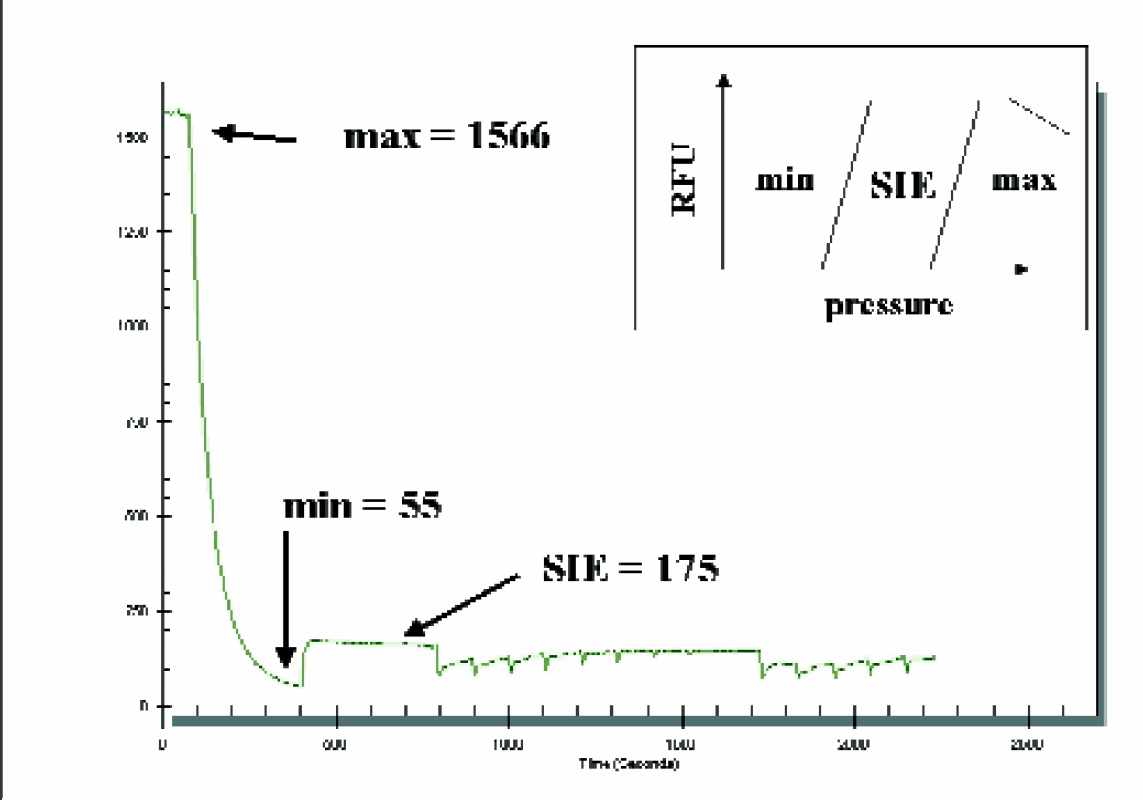
Estimating the assay conversion using fluorescence. % product conversion= (SIE-Min)/(Max-Min)x100 = (175–55/1566–55)x100 = 7.9% for this example. Inset is a representation of the pressure model. Each region represents the pressure mode for chip operation.
CONDUCTING A PROTEIN KINASE A ASSAY USING SIE
The following experiment uses SIE to measure the concentration of inhibitor H-9 required for 50% inhibition (IC50) of PKA. Details of kinetic studies performed to optimize the PKA assay conditions for the microchip were described in detail. 2 These studies determined that the Km for the substrate, FL-LRRASLG-CONH2, was 5.5μM, and the Km for ATP was 4.2μM. Prior data on PKA, collected using on-chip mobility shift methods makes this enzyme a good candidate for validation of the SIE method.
The assay buffer consisted of 100 mM HEPES, 1M Betaine, 5 mM MgCl2, 0.01% Triton-X and 2%DMSO. The catalytic subunit of PKA was obtained from Calbiochem Corp. The final in-channel concentrations of 1μM substrate and 5μM ATP in assay buffer to the reaction channel were contributed by the substrate well. Enzyme was diluted to 2μM in assay buffer with 1mM DTT (Sigma) to inhibit oxidation and loaded into the chip well. Accounting for the 20% fixed contribution from the enzyme arm, a 400nM in-channel concentration was produced.
All additional wells of the chip shown in Figure 5 were filled with assay buffer. A 384 well plate was seeded at known locations with H-9, a known inhibitor at concentrations ranging from 10–2 to 10 2 μM. At the end of each row, 1μM product was added as a row marker. The product acts as a simple control since it has the correct mobility for reaching the detector if the SIE pressure and voltage settings are correct. A non-functional biological reaction should be suspected if the control plug of product is detected without a baseline SIE signal. A known inhibitor, PKI, was placed at 10 times excess the 50% inhibitory concentration (IC50) for PKA for use as a 100% inhibition control in the last row of the plate. Inhibitor plugs of 2.7 seconds duration were spaced by 10 seconds of buffer. The 2.7 seconds includes 2.5 s of robot travel time from the plate to the continuously recirculating buffer trough. The screening rate was selected such that two inhibitors at their IC50 could be sipped in succession and which would produce dips with a resolution greater than one.
The optical signal appears as a baseline containing dips produced by the inhibitor plugs shown in Figures 8a and b. The baseline intensity and the deviation from the baseline were normalized to the magnitude of the dip produced by the 100% inhibitor. Baseline was calculated as a moving average intensity over a 120 second period. The IC50 of 3.6μM compares favorably with the results found in literature of Ki = 1.9μM for H-9 on c-AMP dependent protein kinase A (PKA). 9 , 10
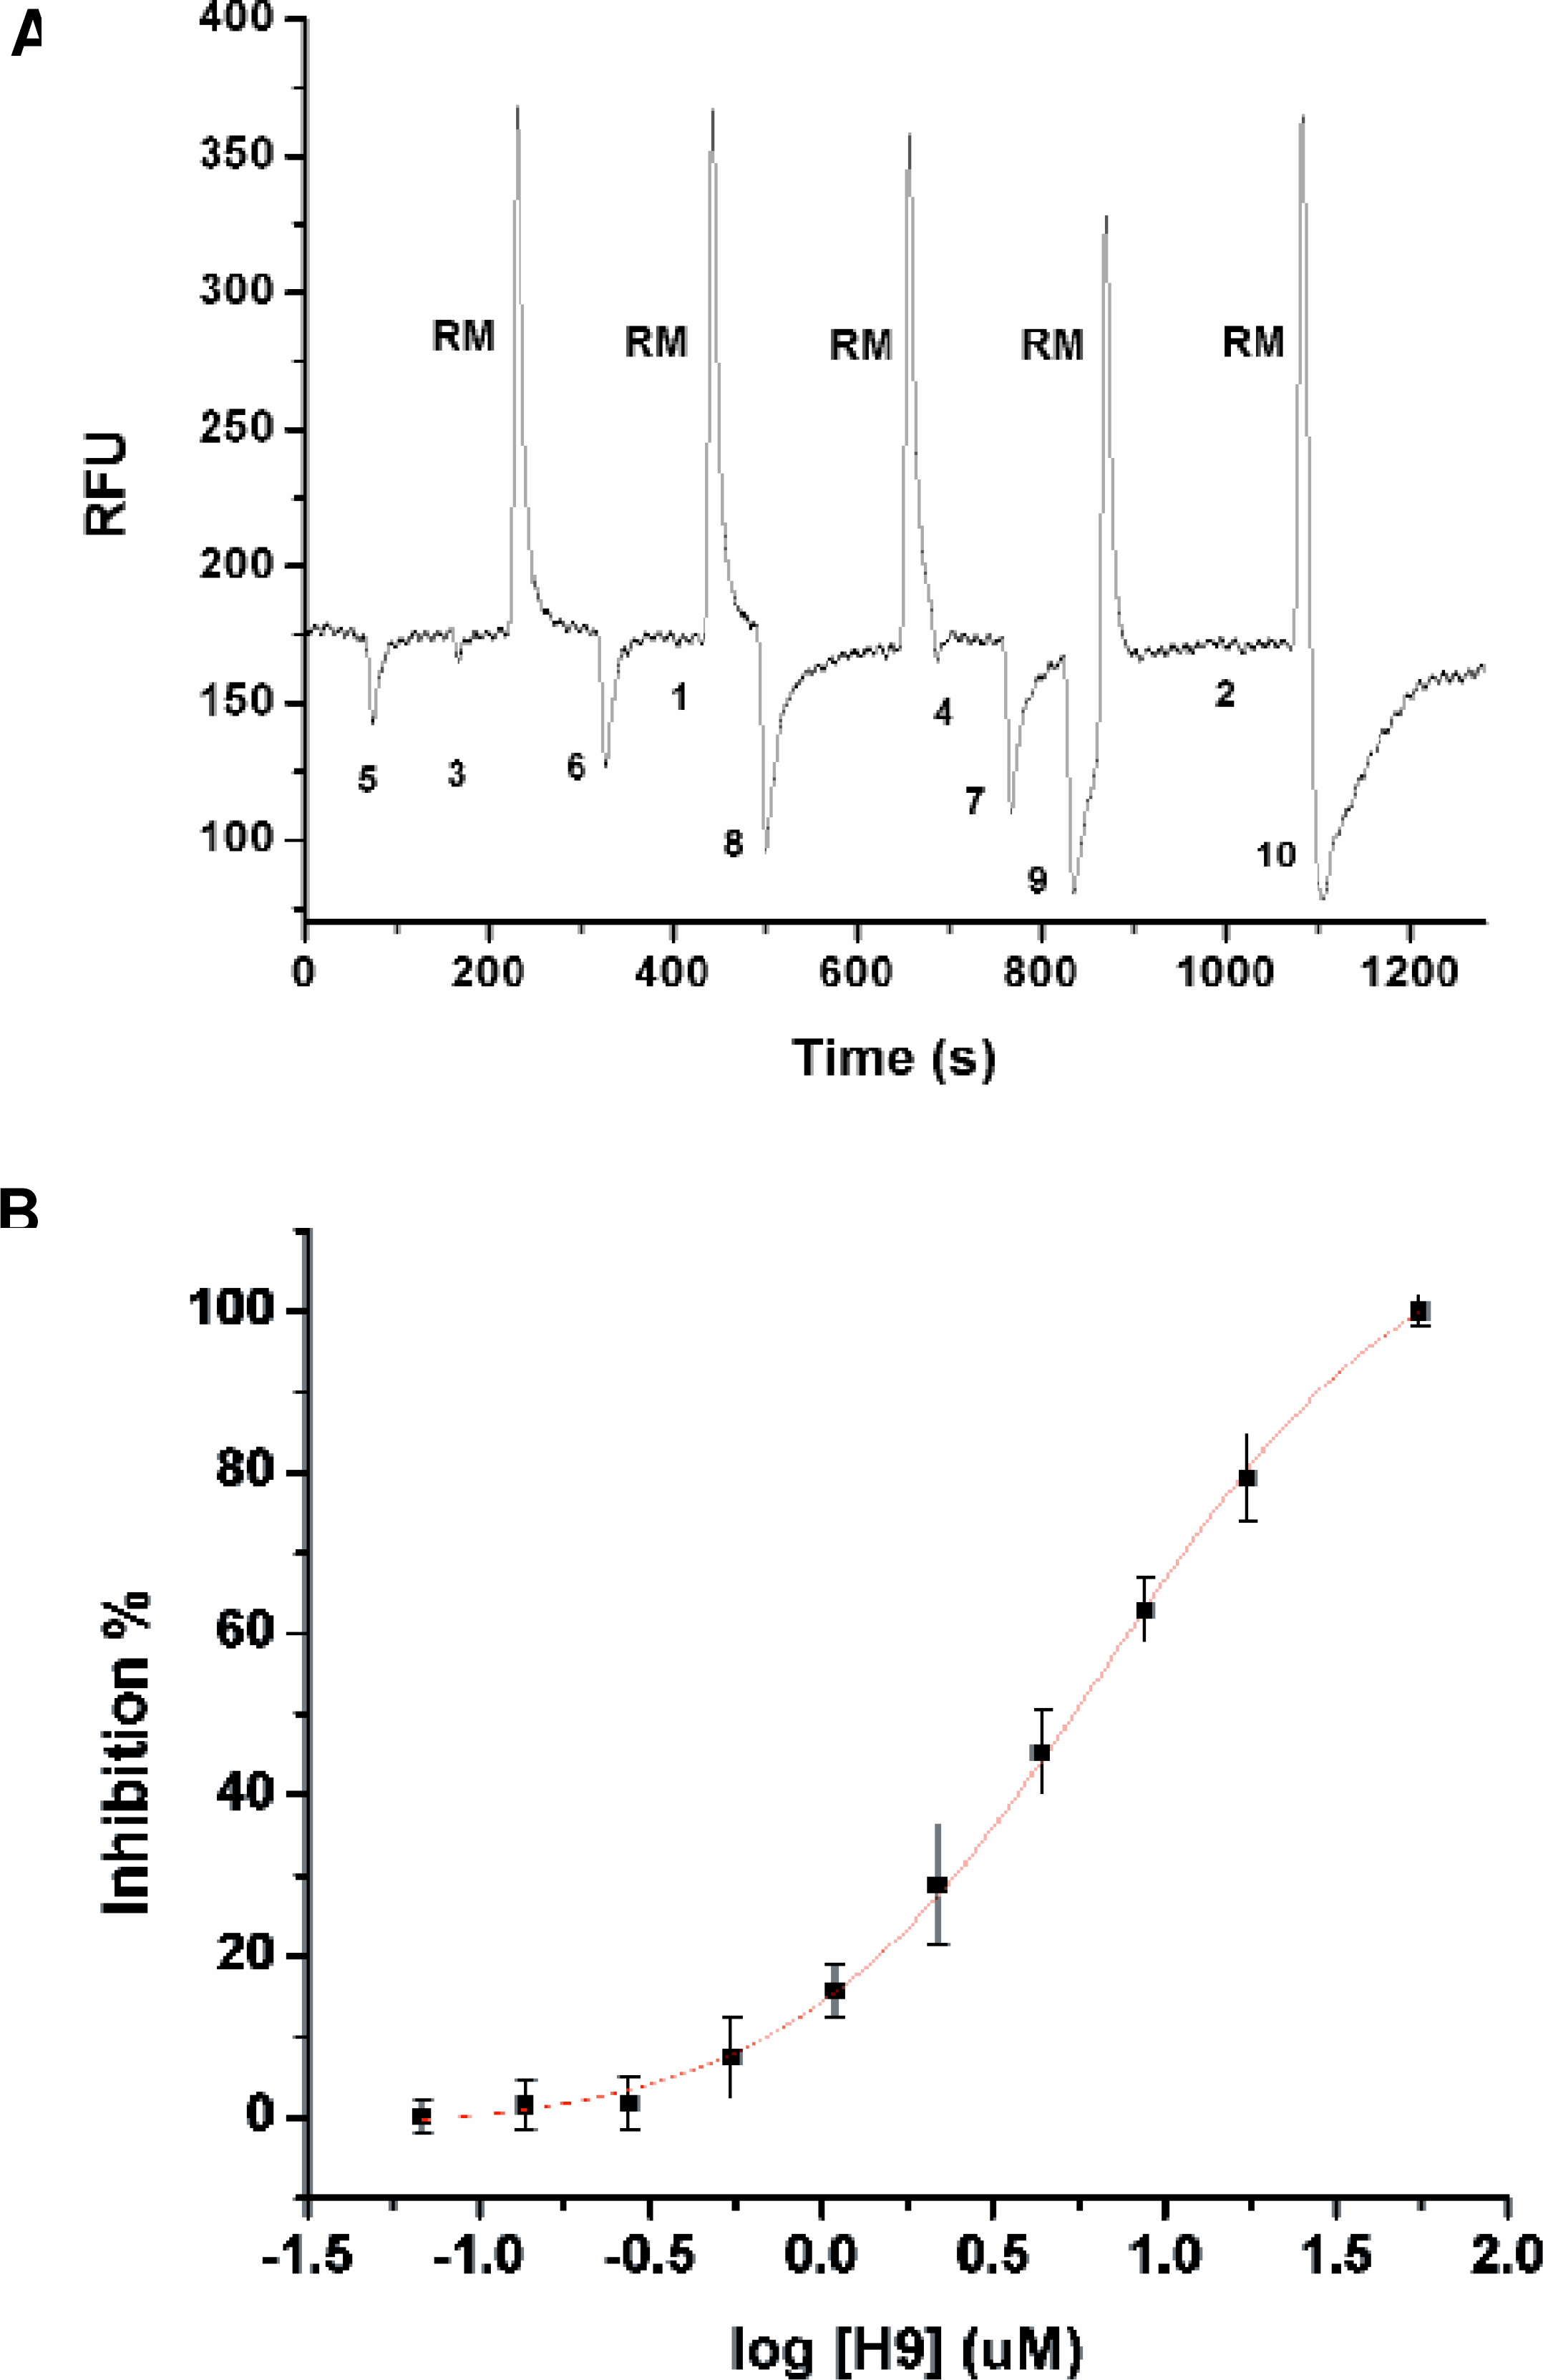
PKA inhibitor plate screen.
PKA ASSAY AT 1.3% CONVERSION
Since the SIE method only allows product to the optical detector, a low conversion assay was tested. A low concentration of PKA was used to achieve a 1.3% substrate conversion in 60 seconds. The standard PKA buffer was used and the chip was loaded as described above. The enzyme concentration in the reaction channel was approximately 68pM. The 1μM substrate and 5μM ATP in the reaction channel were at concentrations below the measured Km for both compounds.
Figure 10 shows the optical trace that was measured by sipping a series of successive dilutions of H-9. The 1% PKA plate assay was screened using the same method as used for the higher conversion example. This single inhibitor plate was cycled through the system five times. Even at a low 1% enzyme conversion, the IC50 of 3.3 μM compares well with the IC50 determined with SIE at higher conversion and Ki values in the literature (Ki =1.9μM).
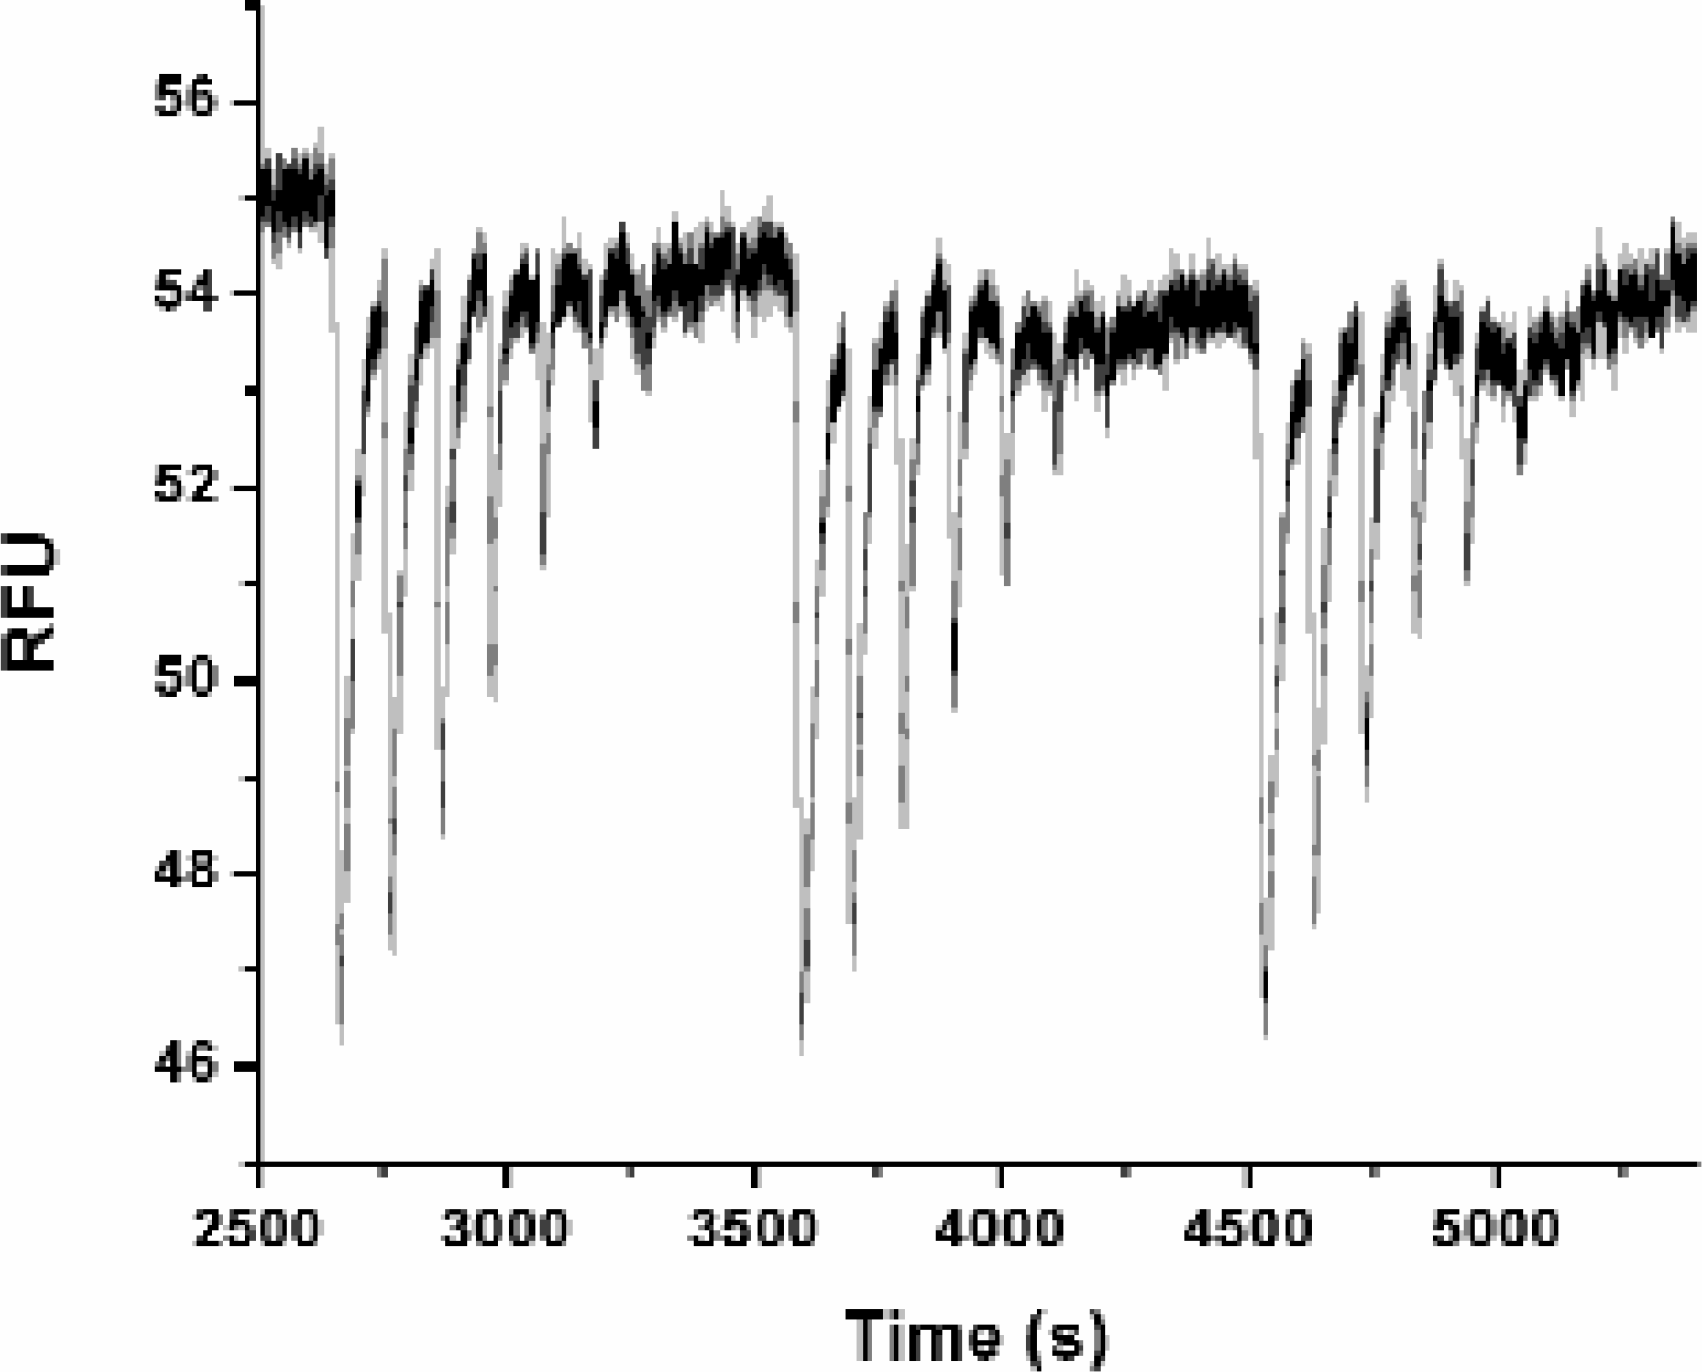
Optical trace of PKA at 1.3% conversion. A serial dilution of H-9 was sipped for 2.7s at 100s intervals to estimate the IC50 at a low conversion percentage. The plate was cycled 5 times but only three cycles are shown. The IC50 for H-9 is 3.3μM. On-plate concentrations H-9[μM]. (200, 100, 50, 25, 12.5, 6.25, 3.125, 1.56, 0.78, 0.39) (multiply by 0.175 for in-channel equivalent) The in-channel concentrations: Substrate 1μM, ATP 5μM, PKA 68pM.
Conclusion
High throughput screening requires more than simply speed to produce value for the end user. High quality data, sensitivity and reagent cost savings figure prominently in the technology implementation decision. The on-chip mobility shift format, dramatically reduces the reagent consumption by conducting the enzyme reaction on the chip and eliminating dead volumes. We have demonstrated the SIE technique as an extension to the on-chip mobility shift assay capability.
SIE is a balance technique for hydrodynamic and electrokinetic velocities. The multiport controller allows the independent regulation of electrokinetic and pressure flows in the chip, which is needed for SIE operation. Since EO flow is suppressed by the coating, the electroosmotic mobility is on the order of 10–6 cm2/ V sec. Without EO flow contributions, this method is applicable to anions or cations and not restricted to neutral species. The fixed channel geometry of this SIE chip was optimized for species that have mobility differences greater than 5.0*10–5 cm2/ V sec. The absolute mobility of the peptides can range from +2.0e-4 cm2/ V sec. A single chip design can be used to separate either anions or cations over a range of electrophoretic mobilities. The SIE data format shows that enzyme activity is immediately apparent through a direct optical signal. Since the substrate is sent to the waste channel separate from the product signal, inhibition and conversion of substrate as low as 1% in 60 seconds can be quantified. The low 1% conversion example of PKA at 68pM can be extrapolated for with other kinase enzyme systems with slow kinetics. In these cases, higher enzyme concentrations can compensate for slow turnover. We estimate that at 300nM, an enzyme can be 4200 times slower than PKA and may still be assayed by this method, which would expand the range of serine and threonine kinases that can be assayed on-chip. Lower enzyme concentrations will translate into cost savings, which can be substantial for large compound screens.