
Abstract
Here we demonstrate the concept of kinase profiling using a panel of four kinases and 10 kinase inhibitors. We used the Kinase-Glo Plus Luminescent Kinase Assay and the Deerac Fluidics Equator HTS noncontact liquid-handling system to design and perform an ultrahigh-throughput profiling screen. We present IC50 values for each test compound and show how such profiling can streamline the initial drug discovery process.
Introduction
Kinases play a crucial role in regulating complex cellular processes including cell activation, growth, and differentiation. Abnormal kinase activity can lead to a variety of human diseases including cancer, arthritis, diabetes, and cardiovascular disease. The role that kinases play in these diseases makes them an attractive target class for the pharmaceutical industry. 1 Pharmaceutical companies are tasked with finding potent, yet selective, kinase inhibitors to help ensure a high therapeutic effect for the target kinase with the least amount of toxicity from off-target activity.
Kinase profiling helps to determine if test compounds are selective for their intended target kinase enzymes. The profiling process involves screening compounds against a panel of kinases. Profiling can be performed using two basic strategies. The first strategy involves screening at a single compound concentration against the kinase panel. Percent inhibition for each compound with the respective kinase is calculated, and results are compared to determine which kinases are inhibited by each compound, or in other words, how selective the compound is. A second strategy for profiling involves screening the compound at several different concentrations and generating IC50 values for each compound with each kinase. The IC50 is the concentration of compound that is required to inhibit the target kinase activity by 50%. Profiling with IC50 saves a step for screeners by generating potency and selectivity data simultaneously.
There are a number of assay technologies available for measuring kinase activity. 2 ---- 7 Bioluminescent, fluorescent, and radiolabeled assays are examples of different types of technologies available for high-throughput applications, each offering their own advantages and disadvantages. Fluorescence-based methods are cost effective, but inherent fluorescent properties of compounds can confound analysis and produce false positive results. Higher assay backgrounds with fluorescent assays also limit the dynamic range and sensitivity of the assay. Radiolabeled methods are very sensitive, but the use of radioactive labels requires a regulatory compliance and associated costs. Bioluminescent methods are automation friendly and have low background, and the luminescent output is not affected by fluorescent compound interference. Bioluminescent assays are typically designed for endpoint measurements, however, so performing kinetic measurements can be more challenging.
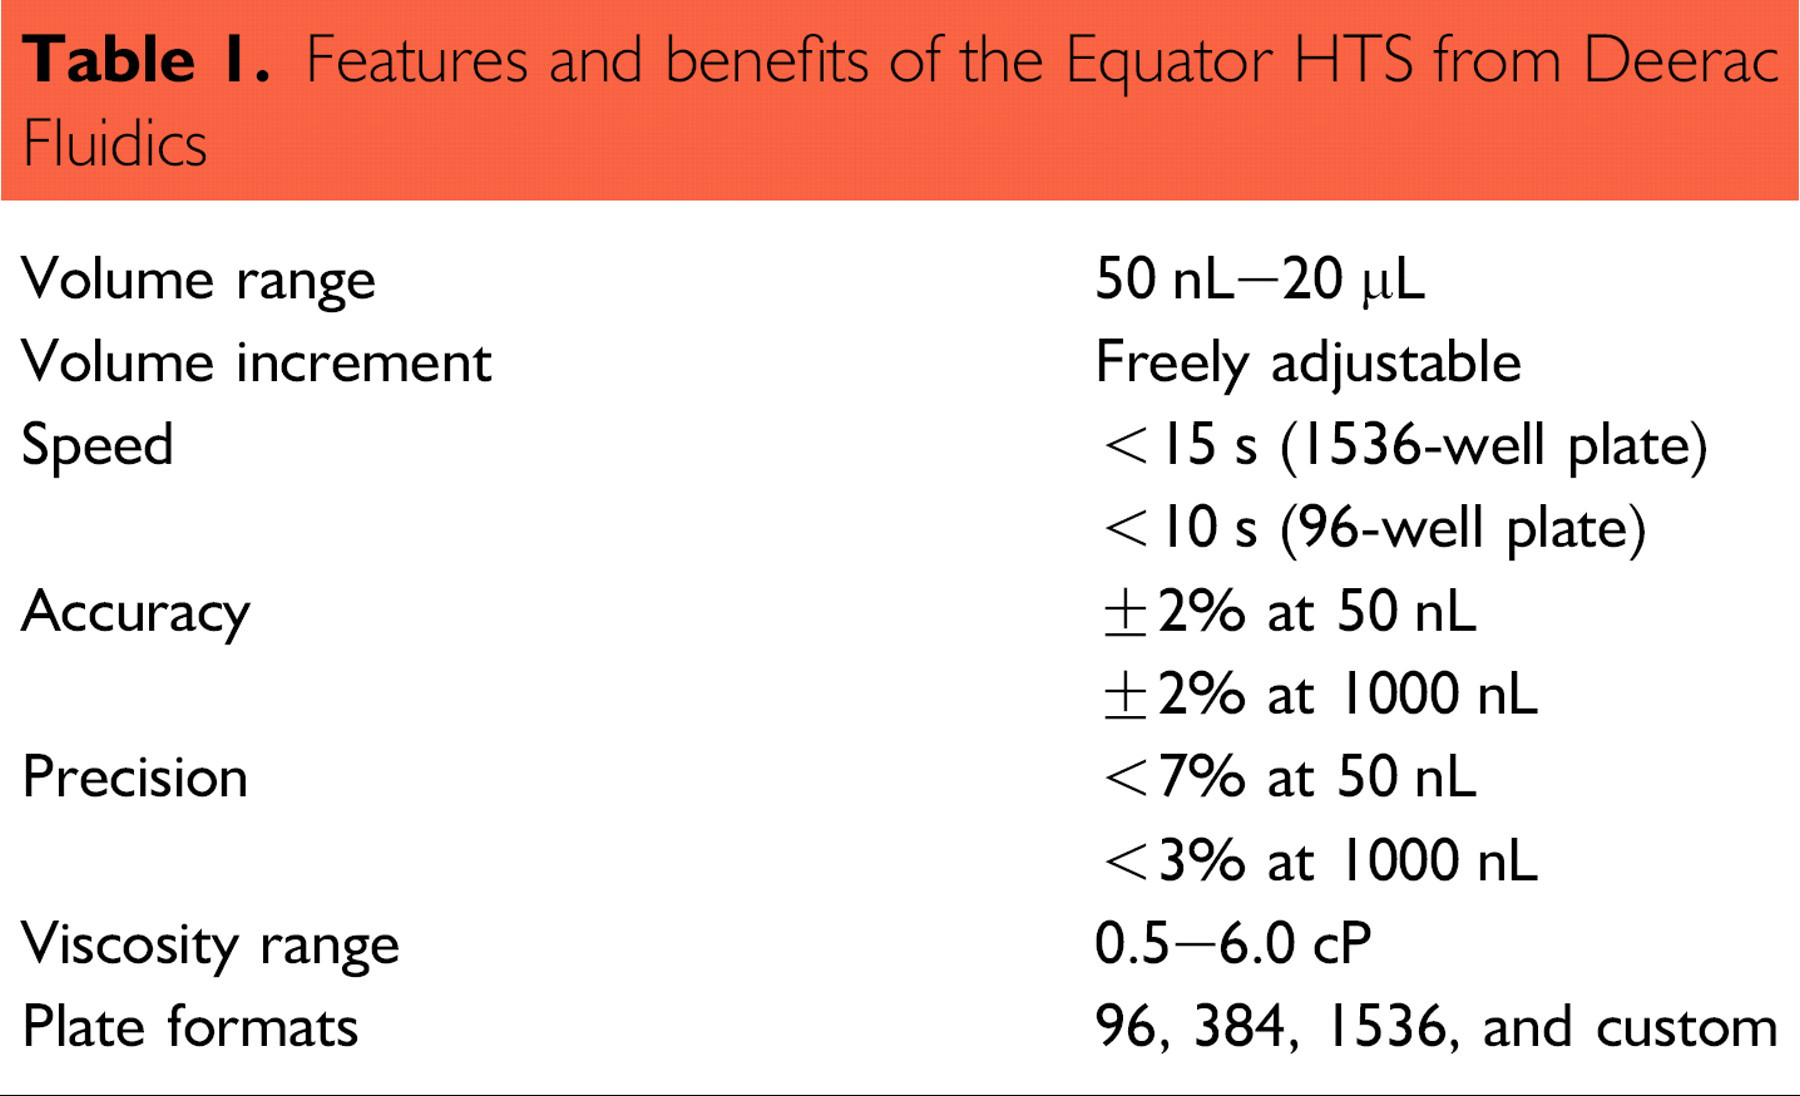
In this article, we demonstrate the concept of kinase profiling using a panel of four kinases and 10 kinase inhibitors. The Deerac Fluidics a Equator b HTS noncontact liquid-handling system is used for performing kinase assays in a 1536-well ultrahigh-throughput screening (uHTS) format. The functionality associated with the Equator HTS makes it an excellent tool for assay development. Independent channel control enables gradient dispensing of liquids and the potential to dispense up to eight different liquids. Using the gradient function in the software method setup it is possible to run column, row, or full plate gradients with different volumes in all wells to obtain the ideal conditions for an assay to be performed. The features and benefits of the Equator HTS are outlined in Table 1.
Features and benefits of the Equator HTS from Deerac Fluidics
uHTS is desirable for kinase profiling applications because it affords more wells for generating multiple data points. With the Equator system, we first optimized each kinase assay with respect to kinase amount, reaction time, and substrate concentration using the Kinase-Glo c Plus Luminescent Kinase Assay (Promega Corporation, Madison, WI, USA). Optimized kinase reaction conditions are then used to determine Z′-factor values for each kinase enzyme. 8 Z′-factor is a statistical measure of assay variability and reproducibility. 8 We profiled test compounds using the IC50 method of profiling, where each compound is analyzed at 24 different concentrations against each kinase. Resulting data are used to determine both selectivity and potency of each test compound against the different panel kinases.
Considerations for Optimizing Kinase Assays
Performing kinase screening first requires optimizing the reaction conditions for each kinase that will be used in the profile. In this study, we used the homogeneous Kinase-Glo Plus Luminescent Kinase Assay. This assay determines kinase activity by quantifying the amount of ATP remaining in solution following a kinase reaction (Fig. 1) and is easily amenable to uHTS formats. A feature of the Kinase-Glo Plus Assay is the unique combination of Ultra-Glo Luciferase and a proprietary buffer formulation that results in luminescence that is less susceptible to interference from library compounds compared to other ATP-based detection methods. 7 , 9 In addition to the features previously described for bioluminescent assays, this method also has the ability to assay a wide variety of kinase–substrate combinations. This universal assay can be used for a number of kinase substrates including peptides, lipids, and sugars.
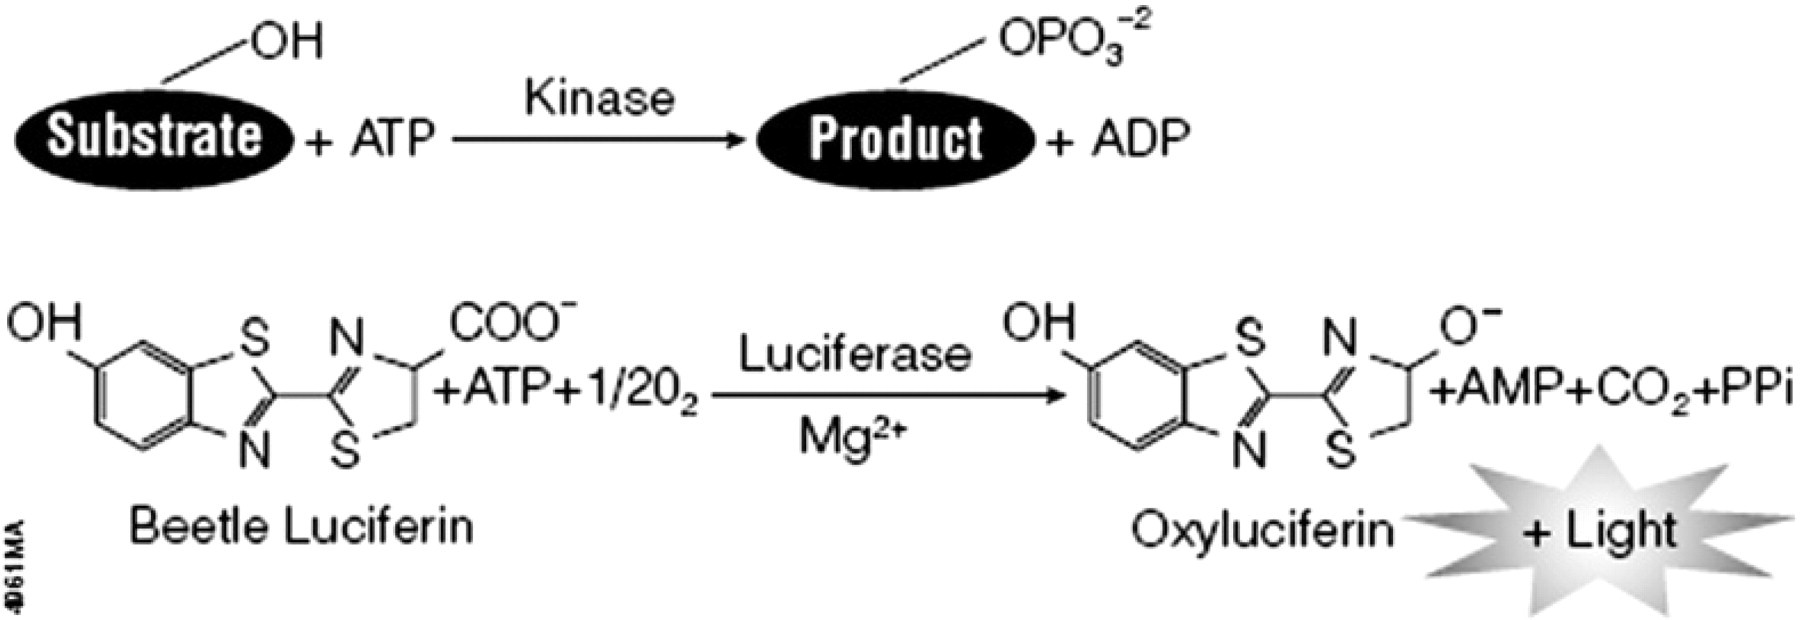
The Kinase-Glo Plus Assay reactions. The kinase enzyme phosphorylates a substrate using phosphate from ATP. The more active the kinase, the more ATP is consumed. Following the kinase reaction, the amount of ATP remaining in solution is quantified with the addition of the Kinase-Glo Plus Reagent. In the presence of ATP, luciferase catalyzes the mono-oxygenation of luciferin to generate light. Light output is inversely proportional to kinase activity.
Four different kinase enzymes were chosen for this application. The enzymes and their respective substrates include PKA enzyme with kemptide substrate (Promega Corporation, Madison, WI, USA), Src enzyme with peptide 2 substrate (Enzyme-Invitrogen Corporation, Carlsbad, CA, USA and Substrate-Promega Corporation), MAPKAP kinase 2 with MAPKAP substrate (Upstate Biochemicals, Lake Placid, NY, USA), and PI3 kinase with LA-phosphatidylinositol lipid substrate (Enzyme-Alexis Biochemicals, San Diego, CA, USA and Substrate-Sigma, St. Louis, MO, USA).
We followed three steps to optimize the kinase reactions. The first and second steps, performed simultaneously, optimized both kinase reaction time and amount of kinase for each reaction. The third step optimized substrate concentration. We then determined Z&prime-factor values with these optimized reaction conditions to assess the quality of the assay for subsequent profiling activities.
Kinase assays were optimized at room temperature to avoid temperature gradients across the assay plates. Room temperature assays were also more amenable to high-throughput screening because they prevented a heating bottleneck in the screening process.
The Kinase-Glo Plus Assay allows ATP concentrations up to 100 μM for screening. In this profiling application, all reactions were performed with 10 μM ATP (Promega Corporation, Madison, WI, USA). Table 2 lists the various addition steps and corresponding volumes used for each experiment described in this study.
Volumes used in optimization and profiling assays
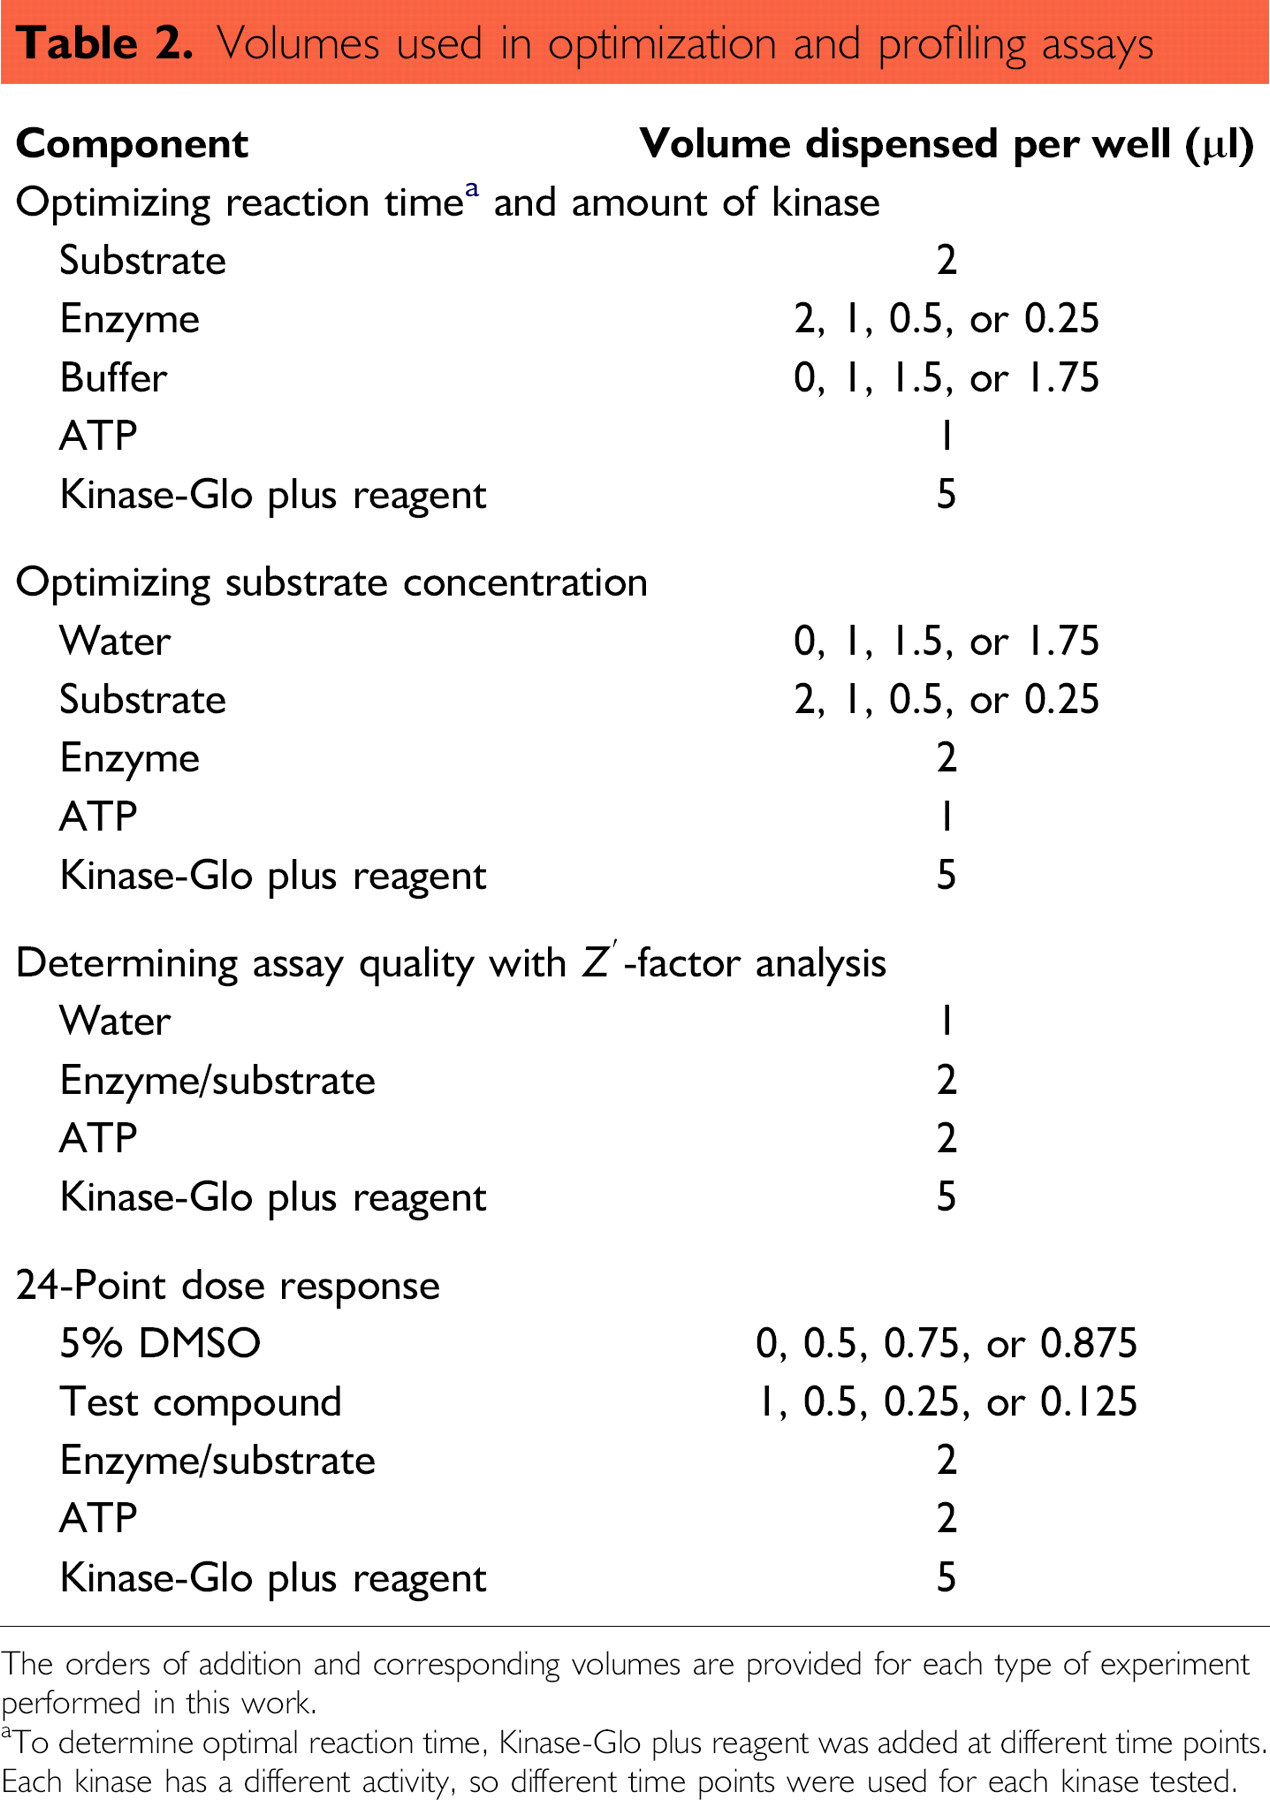
The orders of addition and corresponding volumes are provided for each type of experiment performed in this work.
aTo determine optimal reaction time, Kinase-Glo plus reagent was added at different time points.
Each kinase has a different activity, so different time points were used for each kinase tested.
Optimizing Reaction Time and Amount of Kinase
Substrate for each kinase was added to a 1536-well plate (Costar d Cat. # 3937). As a general guideline, we used a final substrate concentration equal to five times the amount of ATP per reaction: 50 μM substrate for all kinases except PI3 kinase, where 8 μg of phospholipid was used per reaction. Next, we used the gradient dispensing function of the Equator system to titrate enzyme by volume 1:2 across the plate with each tip dispensing a different enzyme concentration. Kinase reaction buffer was added to all wells to bring the contents to a constant volume before adding ATP to initiate reactions.
To determine optimal reaction time, Kinase-Glo Plus Reagent was added over a series of time points to stop the reaction. The time points were selected based on the activity of the kinase being tested. Following Kinase-Glo Plus Reagent addition, the plate was incubated for 10 min at room temperature and luminescence recorded with the BMG PHERAstar plate reader. Optimal kinase reaction time was defined as the point at which the EC50 from the enzyme titration no longer changes. The optimal kinase amount was determined from the EC50 curve for optimal reaction time. The optimal amount of kinase was defined as the smallest amount of enzyme that gave the largest dynamic range from the no-enzyme control in the linear portion of the titration curve (Fig. 2, Table 3).
Enzyme titration results showing optimal reaction times and corresponding kinase amounts
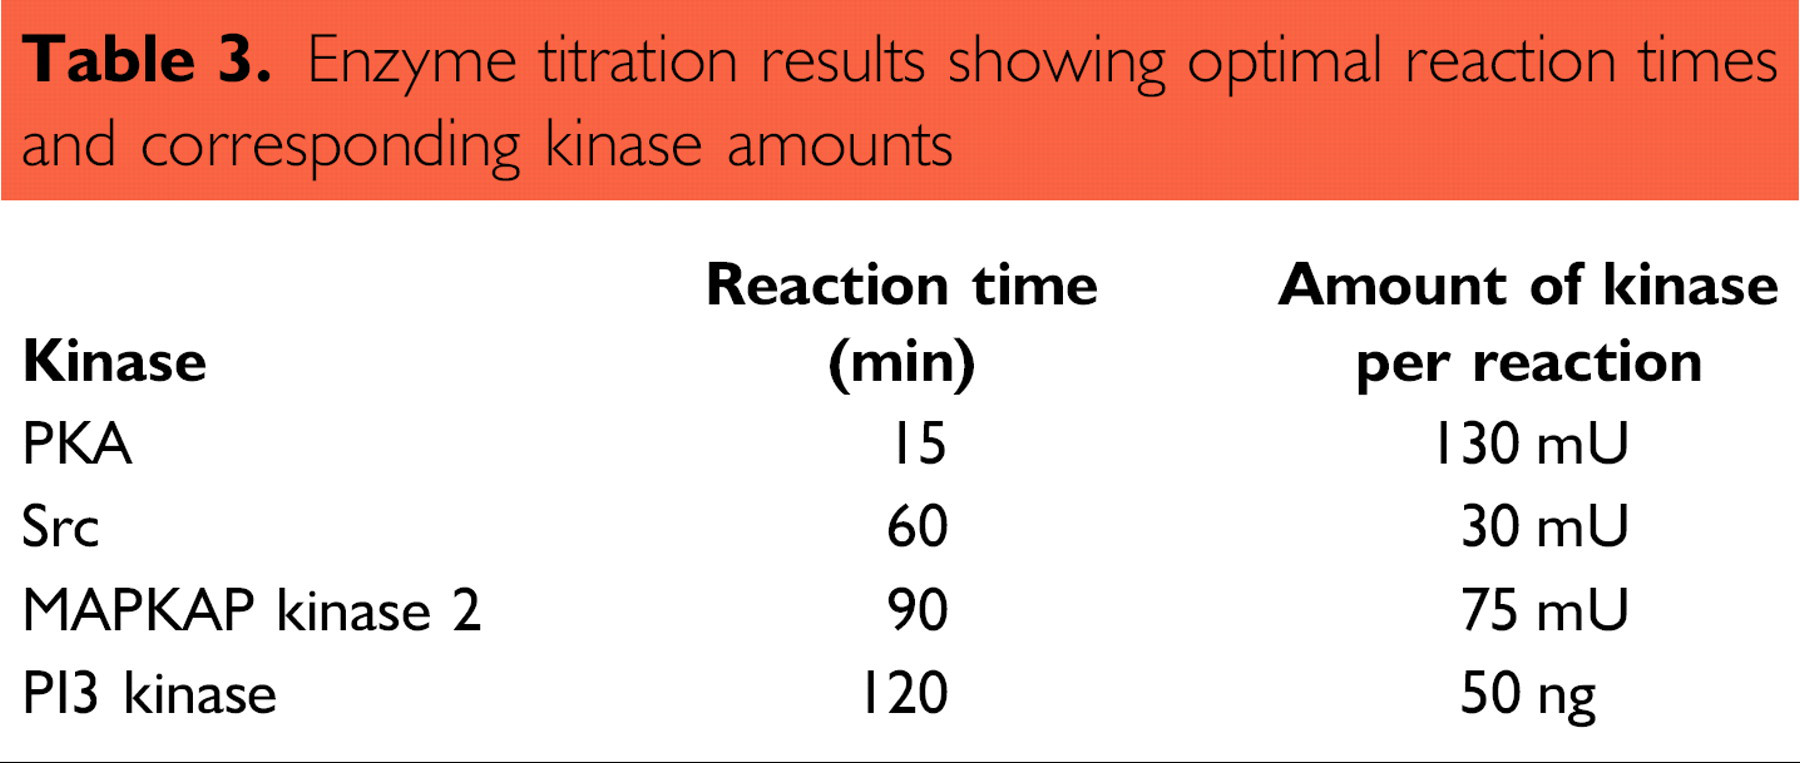
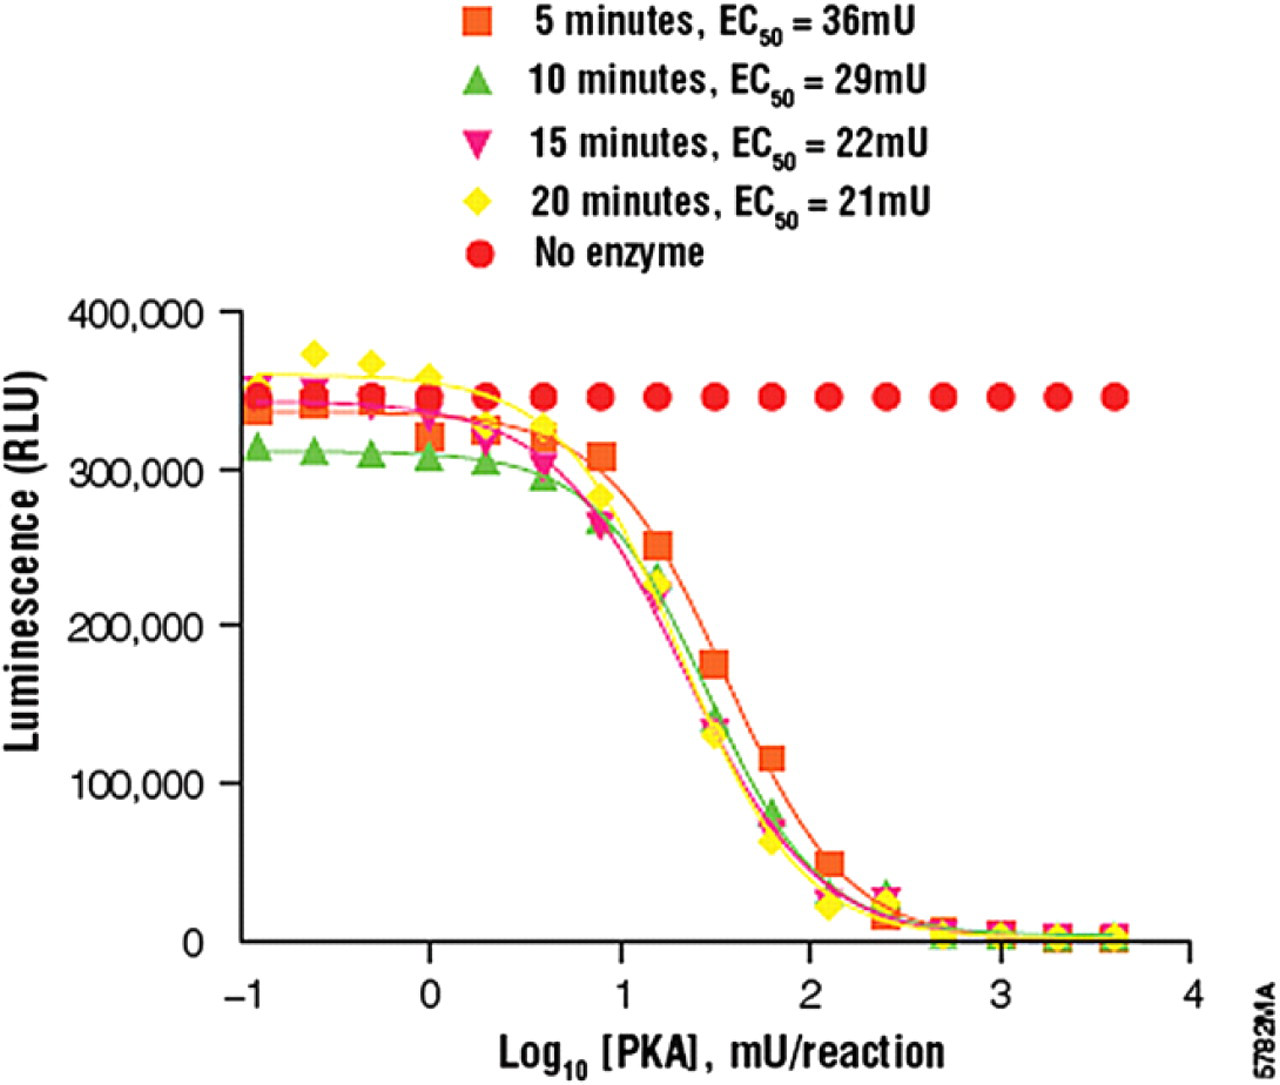
PKA titration results. We determined the optimal kinase reaction time for PKA to be 15 min. Using the curve for 15 min, the optimal kinase amount was determined to be 130 mU per reaction. Each titration point represents an average of four replicates. Titration curves were generated using GraphPad Prism 4.0 software.
aDeerac Fluidics is a registered trading name of Allegro Technologies, Ltd.
bEquator is a trademark of Allegro Technologies, Ltd.
cKinase-Glo is a registered trademark of Promega Corporation.
dCostar is a registered trademark of Corning, Inc.
Optimizing Substrate Concentration
The optimal substrate concentration for each kinase reaction was determined using the optimal reaction time and kinase amount from the initial experiments. Water was added to the plate at the volumes indicated in Table 2. Next, the gradient dispensing function of the Equator system was used to titrate substrate by volume 1:2 across the plate using a different substrate concentration per instrument tip. Enzyme was added to the plate, followed by ATP to initiate the reactions. The kinase reactions were incubated for the predetermined reaction time, and Kinase-Glo Plus Reagent was added to stop the reactions. Luminescence was recorded with the BMG PHERAstar plate reader. Optimal substrate concentration was defined as the lowest concentration of substrate that gave the largest dynamic range from the no-enzyme control in the linear portion of the titration curve (Fig. 3, Table 4).
Substrate titration results showing optimal substrate
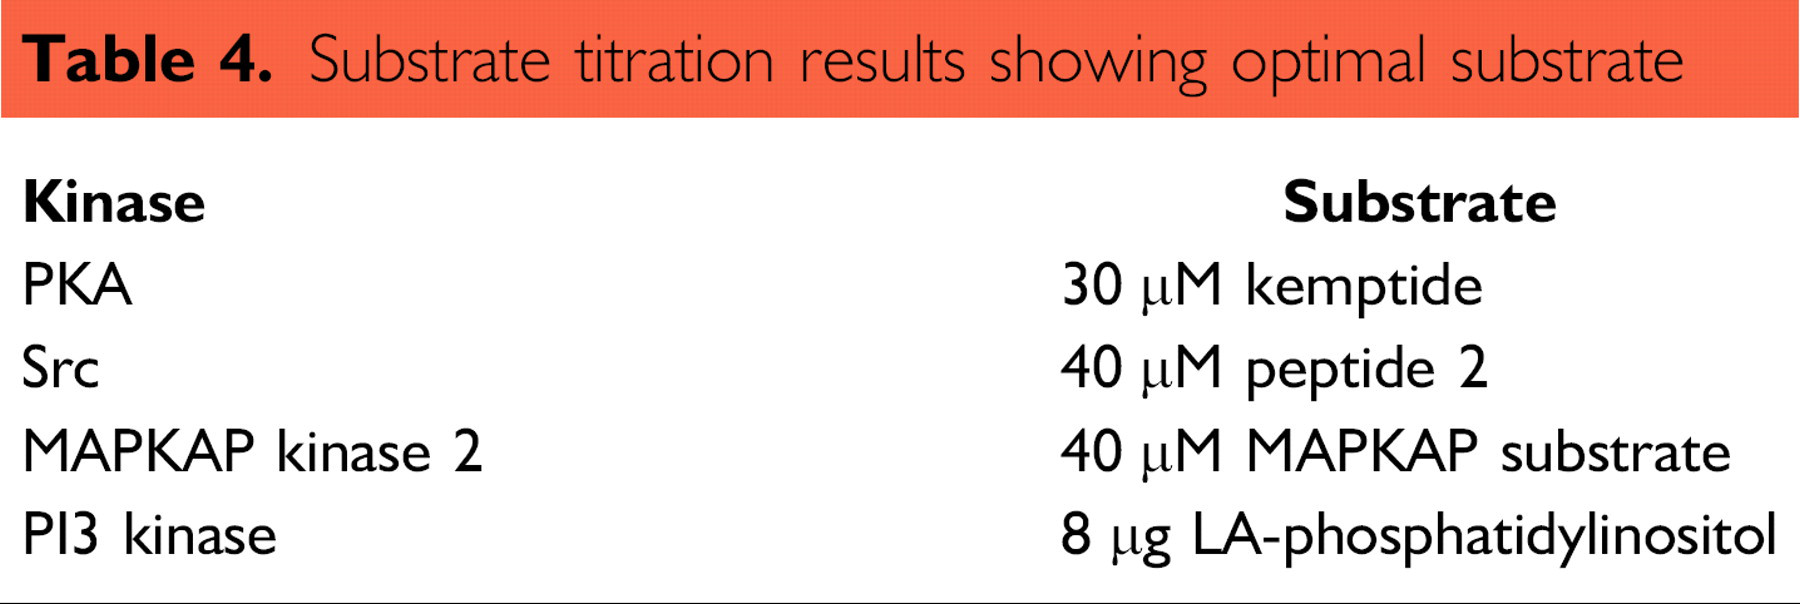
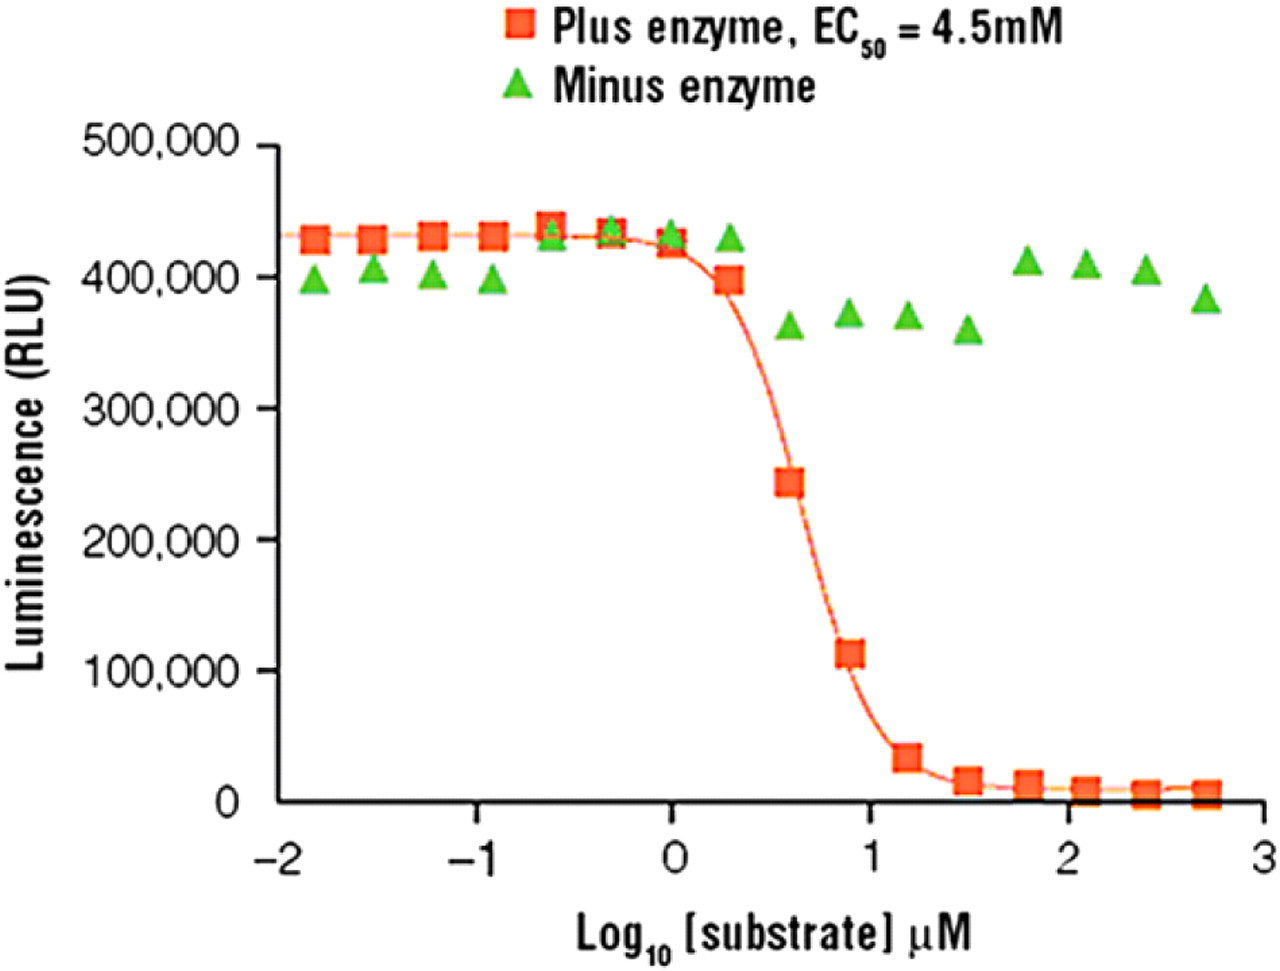
Kemptide titration results. Optimal reaction time and kinase amount were used to determine optimal substrate concentration. For PKA, optimal kemptide substrate concentration was determined to be 30 μm kemptide. Each titration point represents an average of four replicates. Titration curves were generated using GraphPad Prism 4.0 software.
Assessing Assay Quality by Z′-Factor Analysis
A Z′-factor test is performed to assess the suitability of the optimized kinase assays for subsequent profiling applications (Table 5). Z′-factor values are statistical measures of assay reproducibility and variability. 8 The volumes used for the Z′-factor analysis are provided in Table 2.
Z′-factor analysis
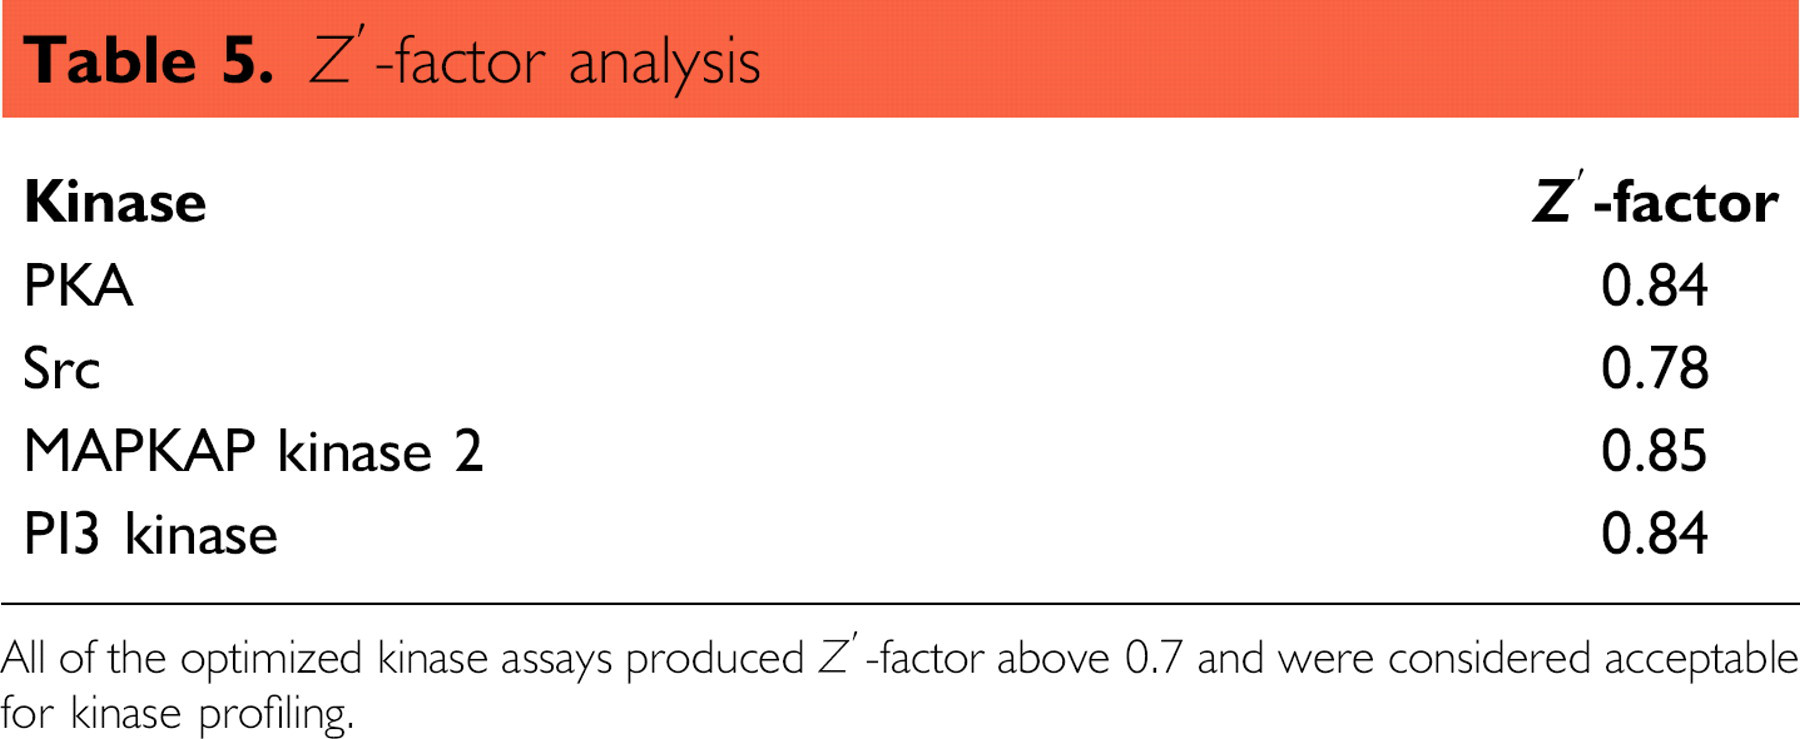
All of the optimized kinase assays produced Z′-factor above 0.7 and were considered acceptable for kinase profiling.
To perform the Z′-factor analysis, water was added to the assay plate. During the profiling experiments, the water was replaced with test compound. Next, a combination of enzyme and substrate at predetermined concentrations was added to the plate, followed by ATP to initiate the reaction. Reactions were incubated according to the predetermined reaction times, and then Kinase-Glo Plus Reagent was added to each well to stop the reactions. Luminescence was recorded with the BMG PHERAstar plate reader.
Kinase profiling for selectivity and potency of test compounds
Kinase profiling for selectivity and potency can help determine specificity and strength of inhibition of test compounds for their target kinases. After we determined optimal kinase reaction conditions and assessed Z′-factor values, we screened the kinase panel with 10 compounds of interest. The compound panel used for this application was comprised of a number of known kinase inhibitors for each respective panel kinase. The purpose of the experiment was to generate dose–response curves for each test compound with each kinase. The resulting IC50 data were used to generate an inhibitory profile for each kinase and test compound combination. We chose to perform 24-point dose–response titrations for each compound to obtain more data points for accurate curve fitting.
To perform the profiling screen, 5% DMSO was added to the assay plate at varying volumes as indicated in Table 2. This DMSO backfill assured that each well contained the same final DMSO percentage following the test compound titration. Next, the gradient dispensing function of the Equator system was used to titrate compounds by volume 1:2 across the plate using a different compound concentration per instrument tip. A combined mixture of kinase enzyme and substrate was added to the well, followed by ATP to initiate the reactions. The final concentration of each test compound ranged from 0.01 nM to 100 μM for the 24-point dose–response curve, with a final DMSO concentration of 1% per reaction. Kinase-Glo Plus Reagent was added after incubation (optimal times as previously determined above), and luminescence was recorded with the BMG PHERAstar plate reader.
Profile data are arranged in table format to show side-by-side results from the various enzyme/test compound combinations (Table 6). IC50 values of the test compounds that inhibit enzyme activity within the dose range tested are recorded. Test compounds that show weak inhibition at higher doses are recorded as having an IC50 greater than the highest concentration tested (100 μM). For these compounds, an accurate IC50 could not be determined because maximum inhibition at higher doses did not occur. Test compounds that show no effect on enzyme activity are recorded as such. For this study, 1 μM is chosen as a potency cutoff for compounds of interest. Compounds that exhibit a potency of 1 μM or less, in addition to being selective, would be considered for further lead optimization.
Results from 24-point dose–response profile
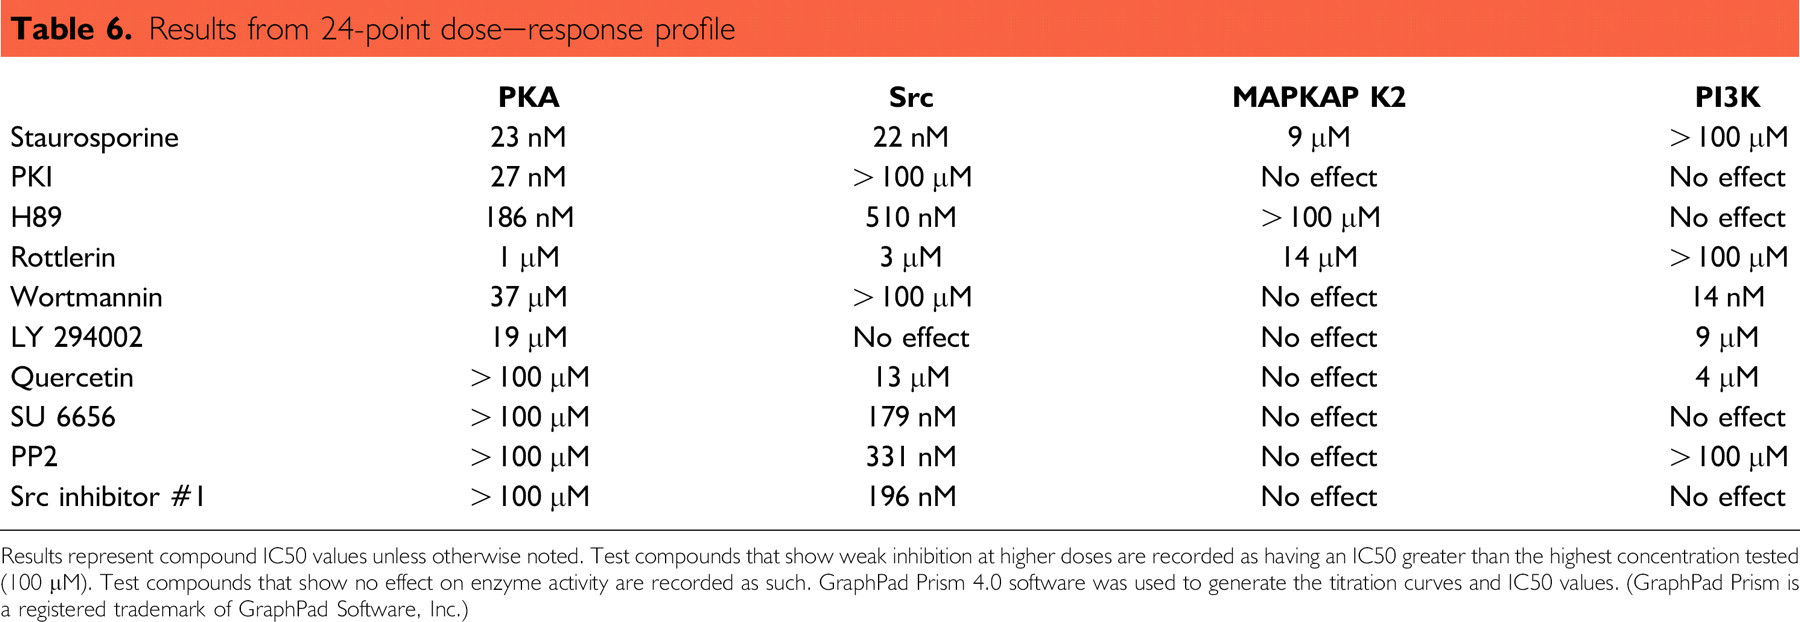
Results represent compound IC50 values unless otherwise noted. Test compounds that show weak inhibition at higher doses are recorded as having an IC50 greater than the highest concentration tested (100 μM). Test compounds that show no effect on enzyme activity are recorded as such. GraphPad Prism 4.0 software was used to generate the titration curves and IC50 values. (GraphPad Prism is a registered trademark of GraphPad Software, Inc.)
Results show that staurosporine is not selective because it inhibits several kinases. In addition, staurosporine shows potent inhibition of both PKA and Src enzymes. H89 is also nonselective and shows potency for both PKA and Src. However, PKI (PKA), rottlerin (PKA), wortmannin (PI3 kinase), SU 6656 (Src), PP2 (Src), and Src inhibitor #1 (Src) showed both potency and selectivity. These compounds would be of greatest interest for lead optimization as inhibitors for their respective kinase enzyme drug targets.
Summary
Kinase profiling is an important component of the drug discovery process. Profiling with IC50 provides simultaneous potency and selectivity information about compounds of interest. Profiling data assist in the detection of inhibitors that may have potential toxic effects due to off-target activity. Compounds that exhibit the strongest potency and specificity profiles can be identified as leads for further optimization. Miniaturizing this profiling process in uHTS format generates data from a wide range of compound concentrations, providing more meaningful and accurate information. The combination of the Kinase-Glo Plus Assay with low-volume liquid-dispensing equipment provides an excellent solution for assay optimization and kinase profiling.
Acknowledgment
The authors would like to thank Brad Lawson and Kerin Hsiao for their assistance during this study.