
Abstract
The process of optimizing the precision of robotic liquid-handling instruments can be improved using the Design of Experiments methodology. Design of Experiments (DOE) is “a collection of statistical and mathematical techniques useful for developing, improving, and optimizing processes.” Using DOE one can design and analyze experiments with the goal of optimizing the precision of liquid deliveries. Tecan has developed a software application, “Neptune” to automate this process for the Tecan Genesis series of instruments. This application has been used to perform experiments on the liquid-handling properties of a variety of liquids. As an example of this process, we will examine a set of experiments performed on a 50% concentration of polyethylene glycol 8000. These experiments resulted in an improvement in the pipetting precision from an average CV of 22.2% to an average of 2.9%.
INTRODUCTION
There are a variety of parameters that can be used to modify the pipetting of Tecan's Genesis series of robotic liquid-handlers. The base software for these instruments, Gemini, gives users around twenty-five different parameters that can be edited for a specified volume range. Gemini groups these parameters into a structure called a “liquid class” (see Figure 1). Each liquid class can have one or more “sub classes” that are specific to tip type and volume range.
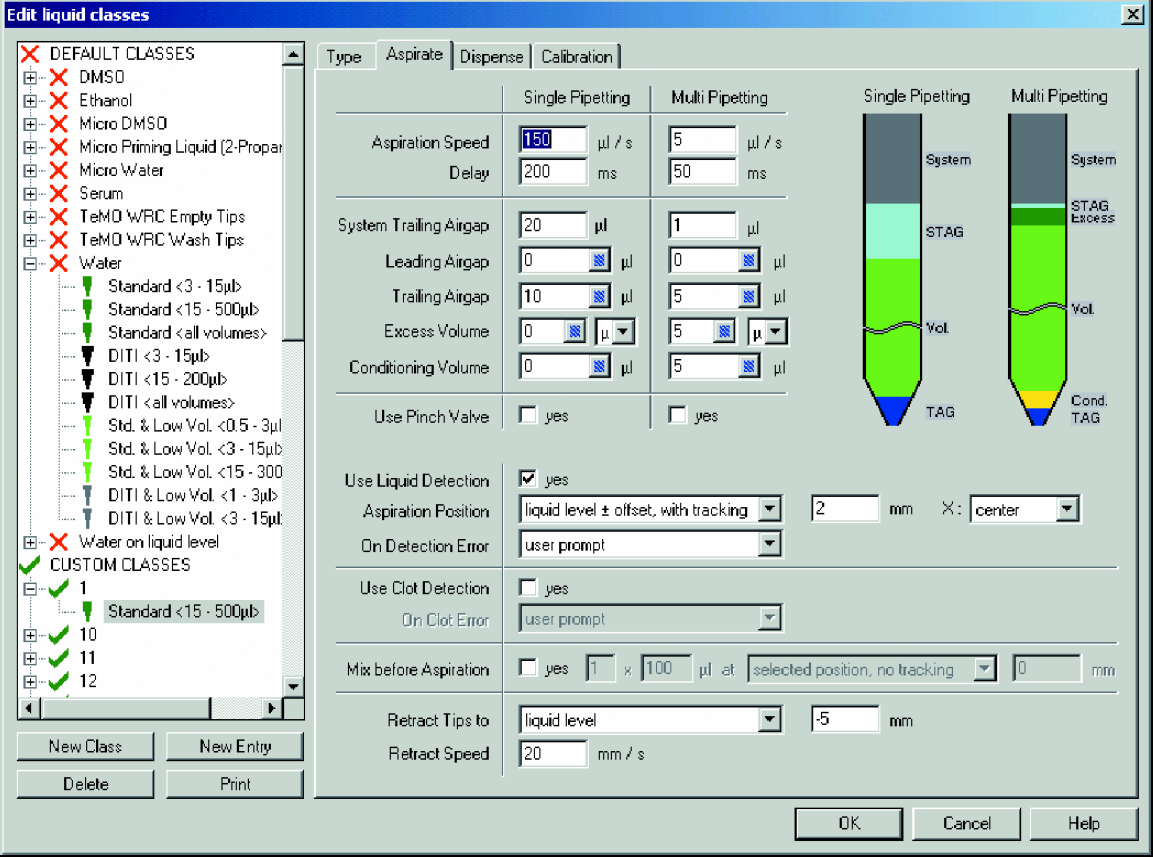
Gemini Liquid Class Editor
These liquid class settings allow the maximum degree of flexibility for addressing a wide range of liquid-handling problems. If a user is pipetting a new liquid for which the Gemini supplied default liquid classes do not produce the desired degree of precision, he/she can produce a new liquid class or sub class. However, the process of identifying which of the liquid class settings are important and then determining the optimal levels of those settings can be time-consuming when this is attempted using traditional methods of experimentation.
To address this problem, Tecan developed “Neptune”. Neptune uses Design of Experiments to design and analyze liquid-handling precision experiments. The goal of these experiments is to help users determine which liquid class parameters have the greatest impact on the pipetting precision of the liquid under study and to help them model the nature of this relationship. The accuracy of liquid deliveries is not analyzed in the initial version of the software but will be included in future revisions.
METHODS AND MATERIALS
A Tecan Genesis Robotic Sample Processor (RSP 150) with 1ml syringes and standard tips was used to perform all pipetting required for the experiments. A Tecan Spectra reader was used for performing absorbance reads of the Corning Costar 96 well, clear, flat-bottom plates.
The liquid under study was 50% polyethylene glycol 8000 (PEG 8000, manufactured by EM Science), 45% tap water and 5% 14g/l Orange G (manufactured by Sigma) solution in tap water.
Neptune was used to generate the liquid classes and accompanying pipetting instructions in the form of worklists (see Figure 2). Tecan's pipetting software, Gemini 3.4, was then used to execute the worklists. The worklists pipetted 100μl of the 50% PEG 8000 solution into 96 well plates into which 50μl of diluent (water) had already been pipetted.
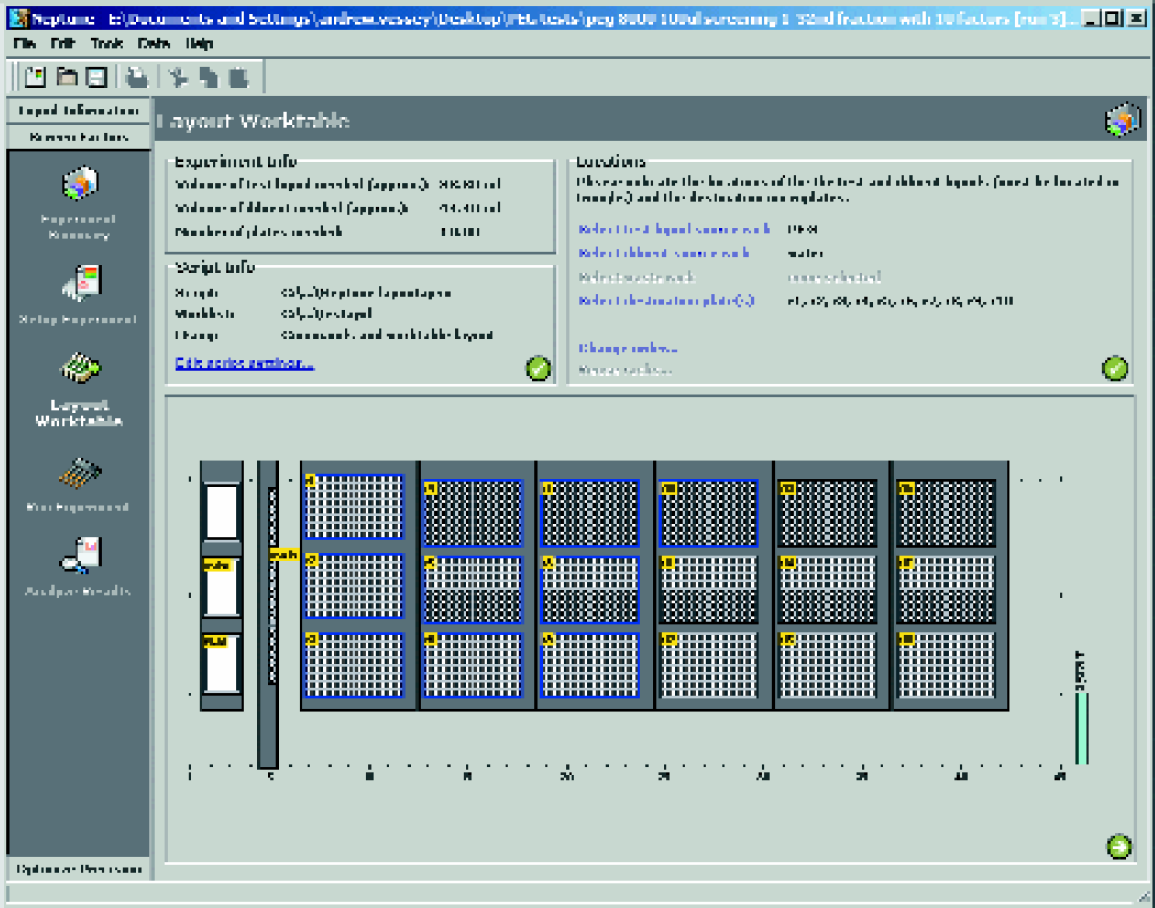
Neptune Software
These plates were read using the Spectra reader (with a wavelength setting of 492nm) controlled through Tecan's Magellan 2.0 software. No blank subtraction was used as it was deemed unnecessary (the measurement of blank wells was in the range of 0.002 to −0.002).
Prior to using Neptune, a set of initial benchmark plates were pipetted and read to determine what the level of precision was when using the default “Water” liquid class provided with Gemini. Four plates of the PEG solution were pipetted using this liquid class and the precision of the deliveries to these plates (as measured by coefficient of variance or CV) was analyzed. The wells on each plate were grouped by column into 24 well sets resulting in a total of 16 CV measurements. The average of these CV's was 22.2%.
Two experiments were then created using Neptune and pipetted using Gemini. A two-level Fractional Factorial design was executed first as a screening experiment. A response surface experiment was then run, based on the analysis of the screening experiment.
SCREENING EXPERIMENT
The purpose of a screening experiment is to determine which of a group of factors has a significant effect on the result variable. In the case of liquid-handling the most critical result to study initially is pipetting precision (as measured by CV).
Using the Neptune software, ten liquid class parameters were selected for inclusion in the experiment. For each of these ten factors, a high and a low level of the parameter was set (see table 1). The factors and their associated levels were selected based on previous experience with other viscous liquids (glycerol solutions of varying concentration). It was hypothesized that several of the factors listed would have little or no effect. It was also hypothesized, based on earlier results with glycerol, that Aspirate Speed, Aspirate Delay and Dispense Speed would be the most active factors in terms of effect on the CV.
Factors and levels of a screening design. 2
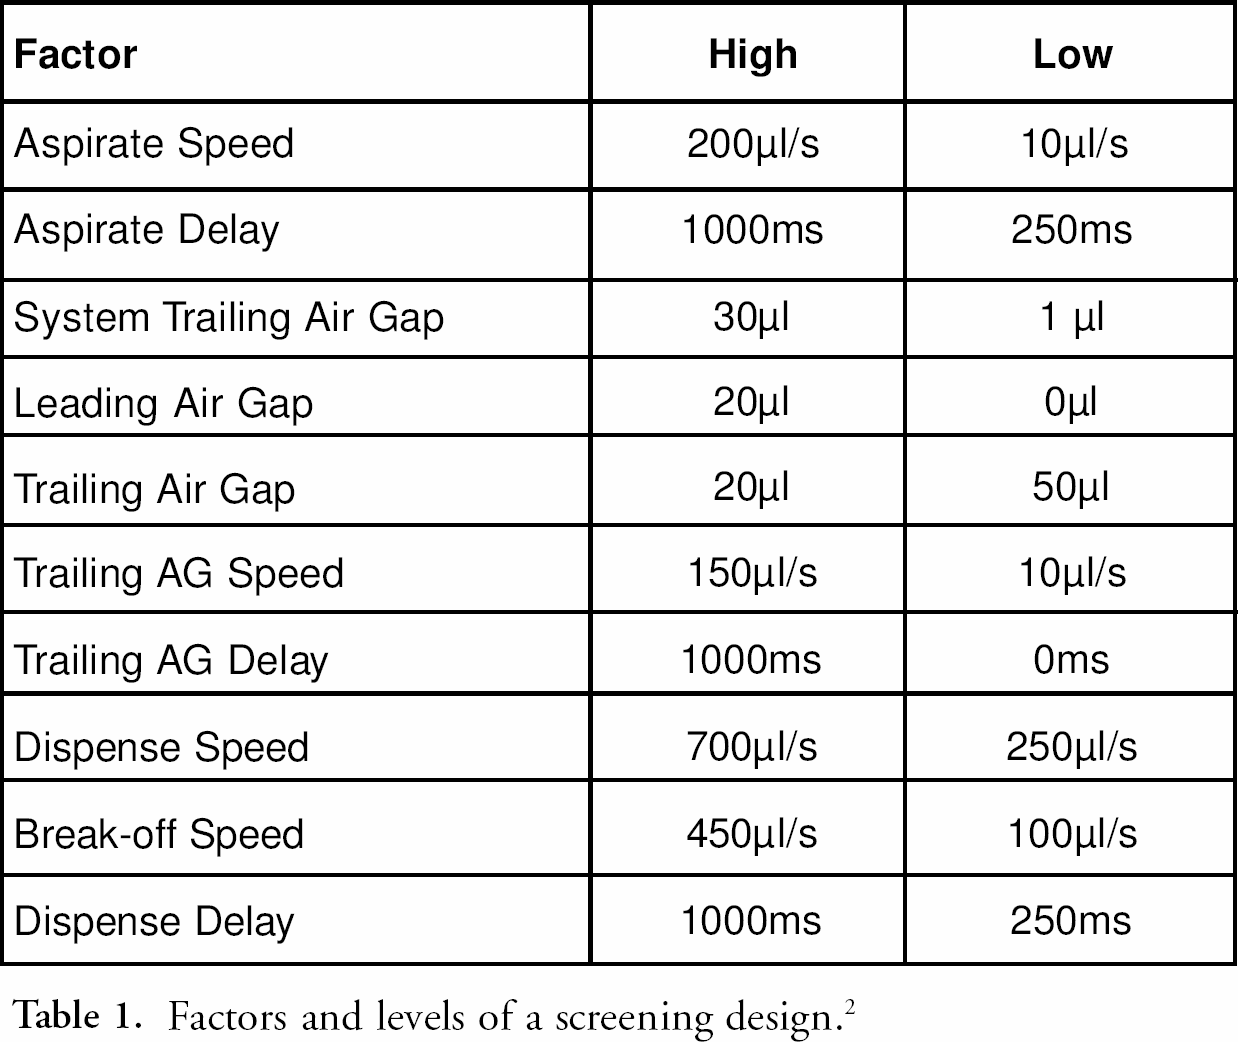
Using the Neptune software, a 1/32nd Fractional Factorial design was selected. This design produced 32 unique combinations of the ten selected factors. This was then augmented with five replicated center points. The center points are points in the design where each factor is set at a level that is centered between the high and low levels of that factor.
The Neptune software was then used to create several Gemini liquid classes — one liquid class for each of the factorial points plus a liquid class for the center points. The software also created a pipetting worklist that was used to pipette 24 replicated wells for each of the factorial points and for each of the replicated center points. A total of 888 wells were pipetted across 10 plates. Each set of 24 replicates was grouped together in three columns on the microplate and the order of these groups was randomized. Single pipetting was used as the pipetting mode.
Each completed plate was then read in the Spectra and a ASCII text output of the read was saved. The resulting 10 ASCII files were imported into Neptune and a CV was calculated for each set of 24 replicates (corresponding to a single point in the factorial design).
Analysis of the design's 37 CV measurements revealed that, of the ten included factors,
Aspirate Speed had the most significant effect on the results. This can be observed by
comparing the relative magnitudes of the main effects as shown in Neptune using a simple bar
chart (see Figure 3). Main
effects are calculated by subtracting the mean of all experiments where that factor is set
to its low level from the mean of all experiments where that factor is set high. This can be
expressed as: 
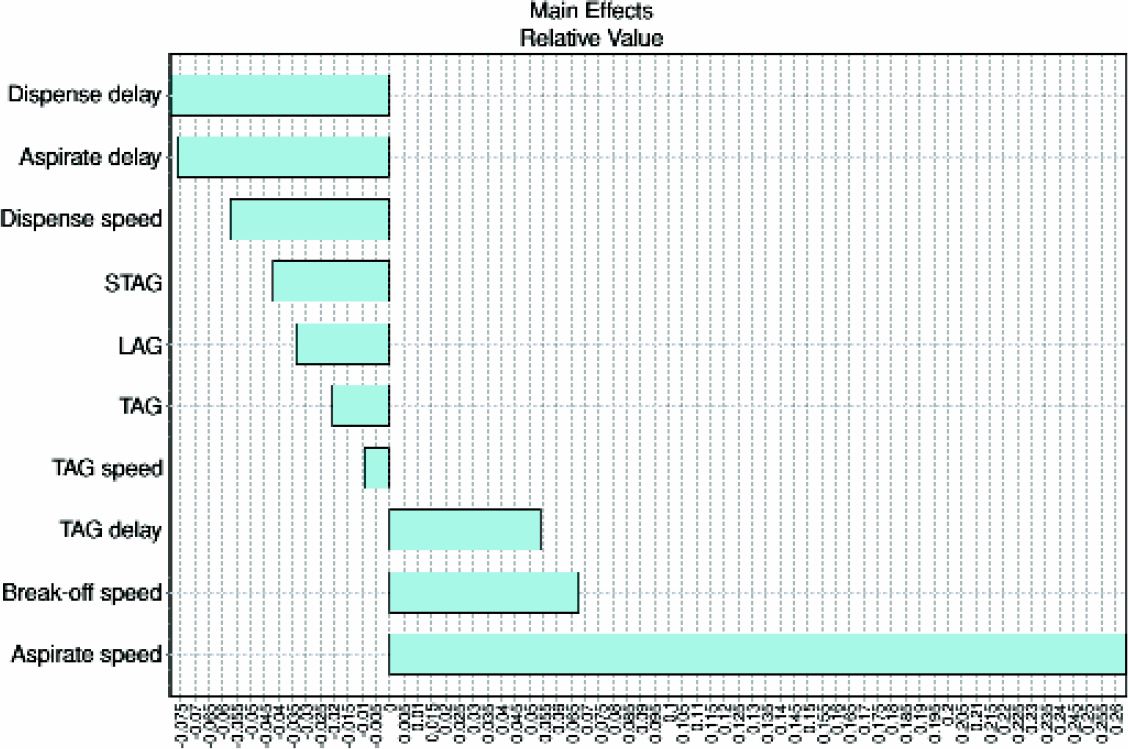
Main Effects
A more empirical measure of effect significance can be evaluated using Lenth's method of calculating the margin of error (ME) and the simultaneous margin of error (SME). In general, if the absolute value of the effect of a factor (or interaction) exceeds or is near the calculated ME result there is a reasonable chance that the factor is active. If it exceeds the calculated value for SME, it is clearly active. If the value exceeds neither the ME or the SME values, it is considered unlikely to be active. 3 For this experiment, the ME value is calculated at 0.127 and the SME is 0.214. Applying these values to the values of the main effects we find that the visual evidence found in the bar chart is confirmed. Only Aspirate Speed exceeds either of the ME or SME values with it's calculated effect of 0.264
The resolution of this design allows us to estimate the effects of some two factor interactions as well. Two factor interactions are calculated using the means of the high and low values as in the main effect calculation but the formula is modified as follows:
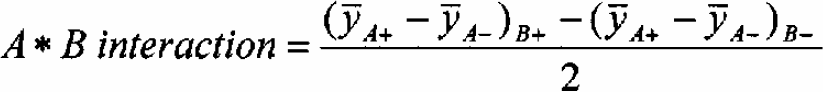
Viewing the two factor interactions together with the main effects in another bar chart (this time with lines representing the ME and SME) we observe that while no additional interaction effects have values above the ME demarcation, there are two interactions that may possibly be of interest due to there proximity to the ME value (see Figure 4). These are the interaction between Aspirate Delay and Trailing Air Gap (TAG) and the interaction between System Trailing Air Gap (STAG) and Leading Air Gap (LAG).
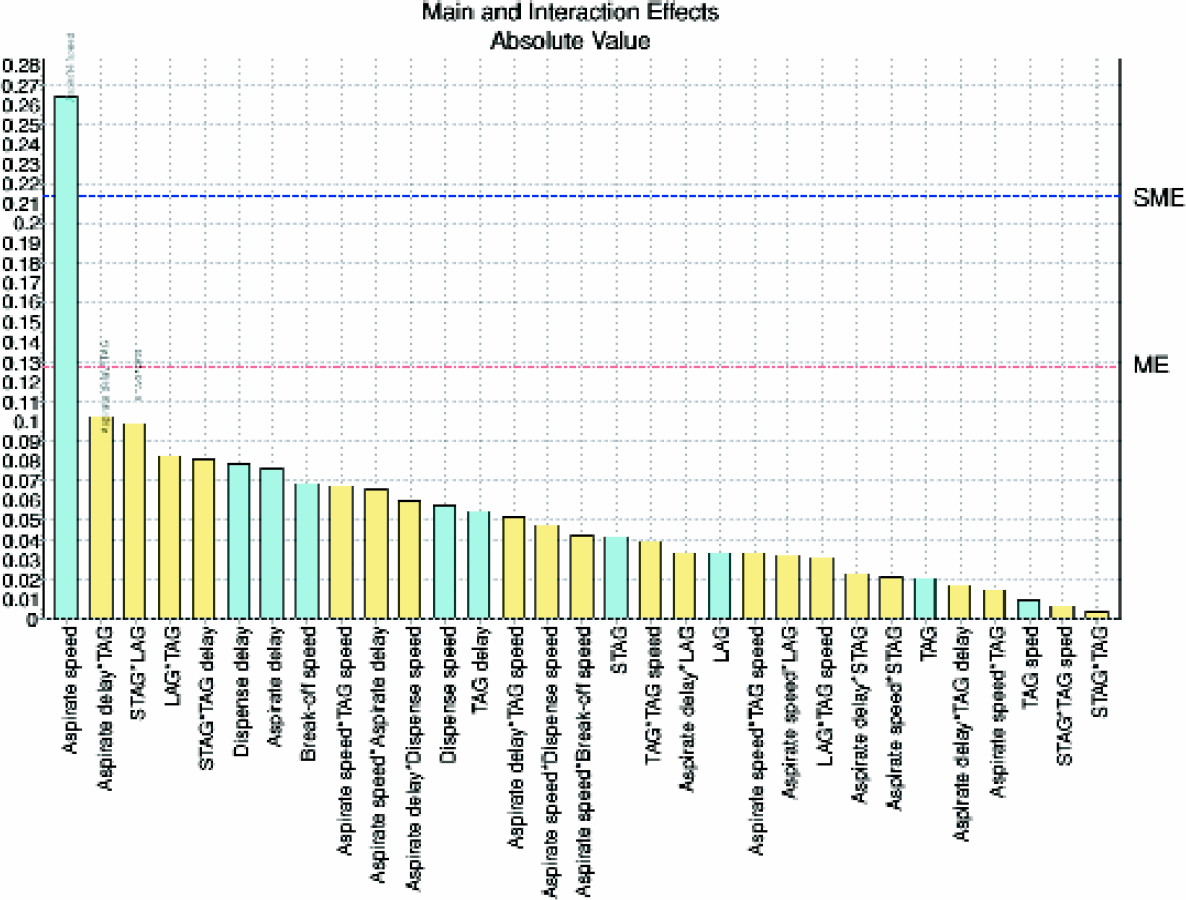
Main and Interaction Effects
Neptune can also perform analysis of variance (ANOVA). Using the ANOVA table we can confirm our suspicion that the interaction between Aspirate Delay and TAG and the interaction between STAG and LAG are significant, as we find that they both have a low probability of being caused by noise (3.33% and 4.03% respectively). In comparison, Aspirate Speed has a probability associated with it of less than 0.01%.
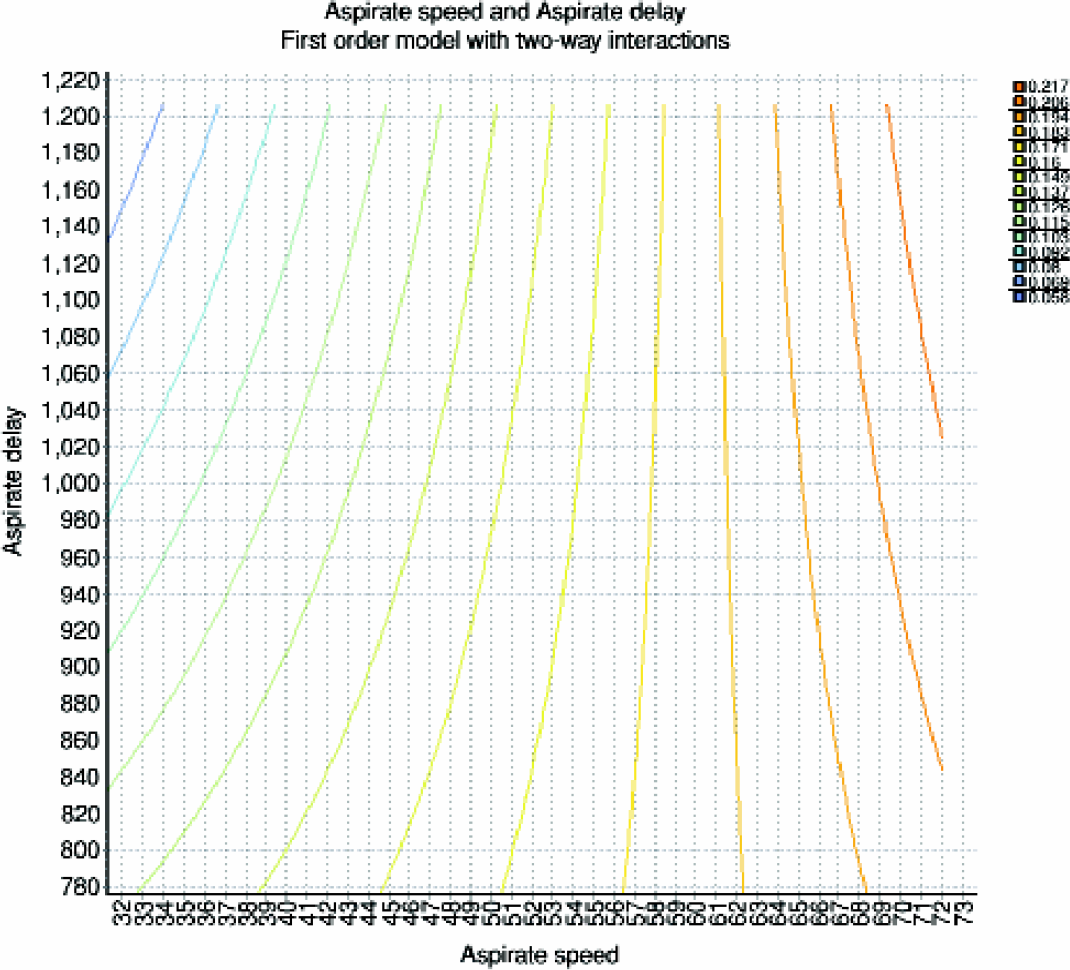
Contour plot (Aspirate Speed and Aspirate Delay)
RESPONSE SURFACE EXPERIMENT
Following the identification of the effects most likely to be active (one main effect and the two interactions), a response surface design was created to provide information about the best settings for the parameters involved. The design used for performing response surface experiments in Neptune is the Central Composite design (CCD). A five factor CCD was created using Aspirate Speed, Aspirate Delay, LAG, TAG and STAG. This design resulted in a total of 47 design points that were then evaluated using the same pipetting protocol used for the screening experiment. Again, Neptune was used to generate the liquid classes and pipetting instructions needed to execute this experiment. A total of 12 plates were required for this experiment.
After importing the data from the plates from the CCD experiment, a model was fit to the data using multivariate linear regression. The highest order equation that could be used to fit a surface to this data was a first-order model augmented with the two factor interactions. The generalized form of this model can be written as:
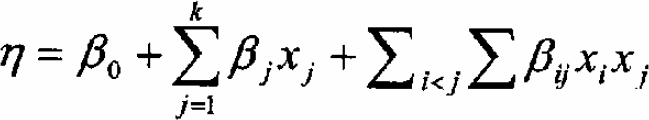
Neptune plots the chosen model in the form of a surface (see Figures 5 & 6). Since the result is a CV, the lowest points in the 3-dimensional response surface plots are the most desired. This type of plot can also be used to examine the two-way interactions. For example, the STAG and LAG interaction (shown in Figure 6) is such that when LAG is set at its low level, the contrast between the high and low levels of STAG is large with the high level of STAG resulting in the lowest CV. However, when LAG is set at its high level, the contrast for STAG is considerably flatter with a slight downwards slope towards the low level.
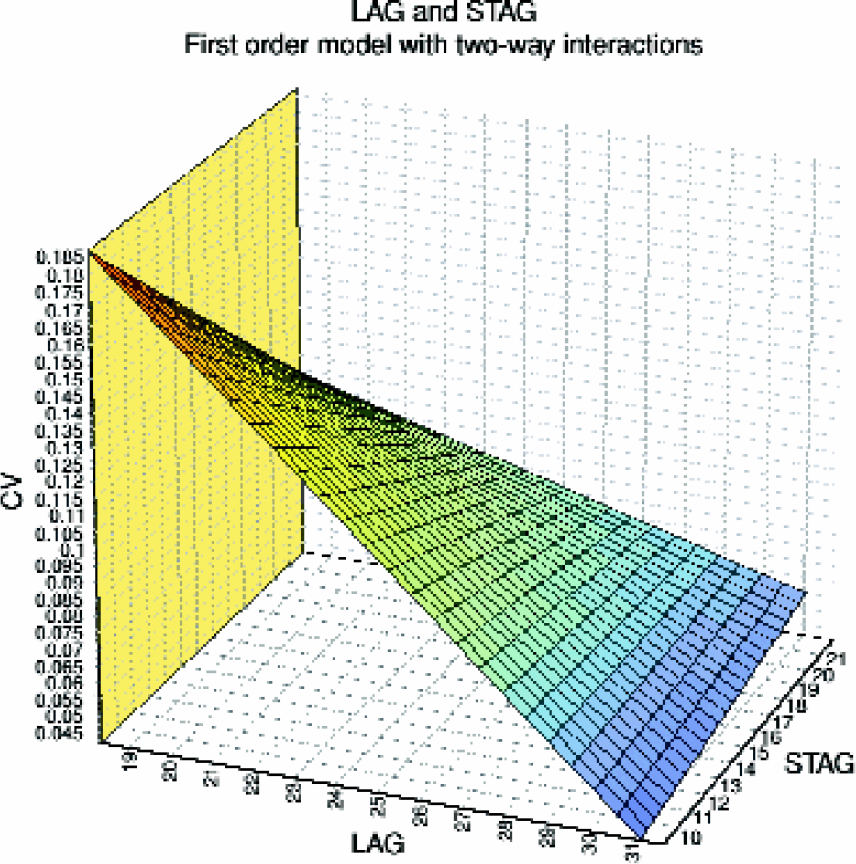
Response surface plot (LAG and STAG)
FINAL BENCHMARK AND CONCLUSIONS
Utilizing the parameter levels suggested by the response surface analysis, we pipetted another set of benchmark plates using the same protocol used for the initial set. Again, four plates were pipetted and the average CV was calculated. The original settings used in the default Gemini liquid class and the new “optimized” settings are shown in table 2. All other settings in the default liquid class remained unchanged.
Original and new settings of parameters
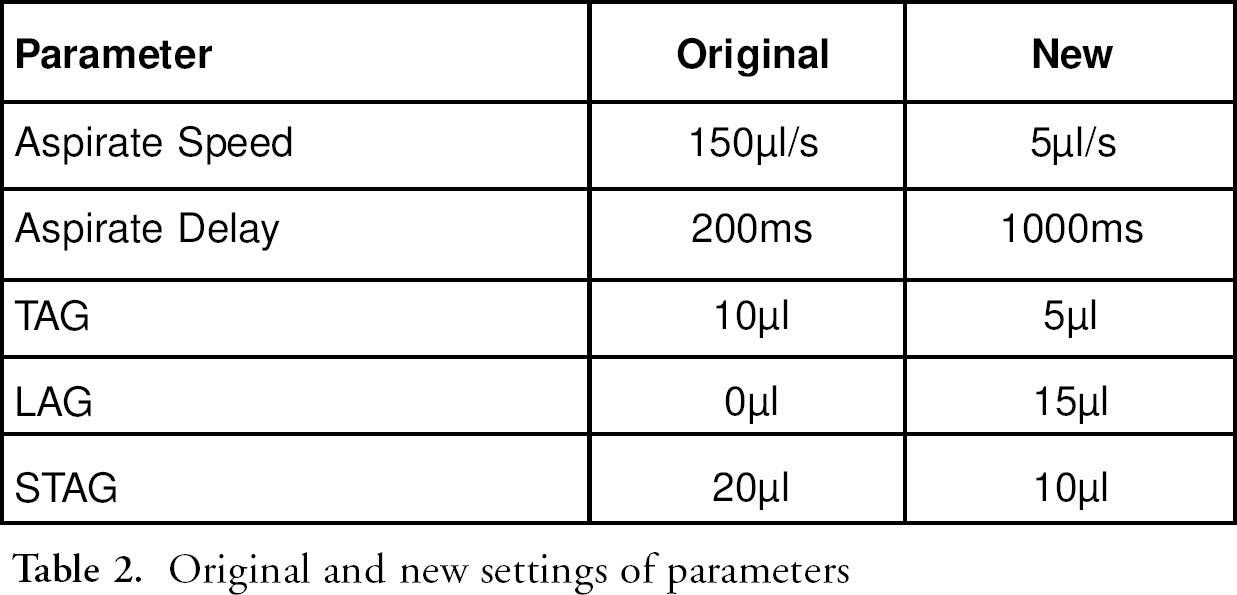
The new settings resulted in a considerable improvement over the original average CV of 22.2%. The average CV of the wells pipetted using the settings suggested by using Neptune and DOE to gather and analyze data on the pipetting characteristics of the 50% PEG 8000 solution was 2.9%. This indicates that the Tecan Neptune software and the Design of Experiments methodology that it utilizes can be a very useful tool for optimizing the precision of pipetting for liquids that would otherwise be difficult to pipette.