
Abstract
Nearly all assays performed within a microtiter plate are volume dependent. In turn, all concentrations of biological and chemical components in these assays, as well as the associated dilution protocols, are volume dependent. Therefore, it is imperative to quantify the volumes transferred to and from an assay. A volume verification method, which can be used to quantify the amount of transferred volume, is an essential component that enables proper interpretation of experimental results. A volume verification method can be used to help an operator optimize volume transfers as well as troubleshoot automated methods. Moreover, these methods can be used to compare performance between liquid handlers, show dispense drift over time, compare channel-to-channel (tip-to-tip) reproducibility, or statistically compare individual dispenses from a multisequential dispense. The focus of this paper, in part, is to discuss some of the many situations where a volume verification method should be implemented. This paper addresses important factors and their associated applications in understanding liquid handler behavior and is not meant to be specific to the volume verification process or the specific liquid handlers used. A robust and reliable volume verification method allows for measurement of transferred volumes at all levels in assay development, from a pure research level to a highly regulated laboratory environment. The goal is to achieve liquid delivery quality assurance through accurate and precise measurement of critical volume transfers. (JALA 2007;12:172–80)
Keywords
Introduction
The need to ensure quality in a laboratory process has become increasingly important.1–3 One such metric for learning about assay quality is the measurement of critical volume transfers, which inherently leads to accurate and precise analysis of the final results. As throughput increases and assay volumes decrease, there are more demands for accuracy and precision of volume transfer tasks, which can include aspirating, dispensing, diluting, mixing, and washing steps. A volume verification method can be used to quantify all critical volume transfers so that the behavior of each system, or automation task, is understood. Furthermore, when a verification method is used as a diagnostic tool, liquid handler performance and the need for maintenance or redeployment 4 become clear, reducing downstream troubleshooting and economic loss. The overriding themes discussed herein emphasize the importance of understanding liquid handler performance for all critical volume transfers within any application. If the volume verification procedures are scientifically based and the methods are properly executed, then the method can be used to increase confidence in assay integrity.
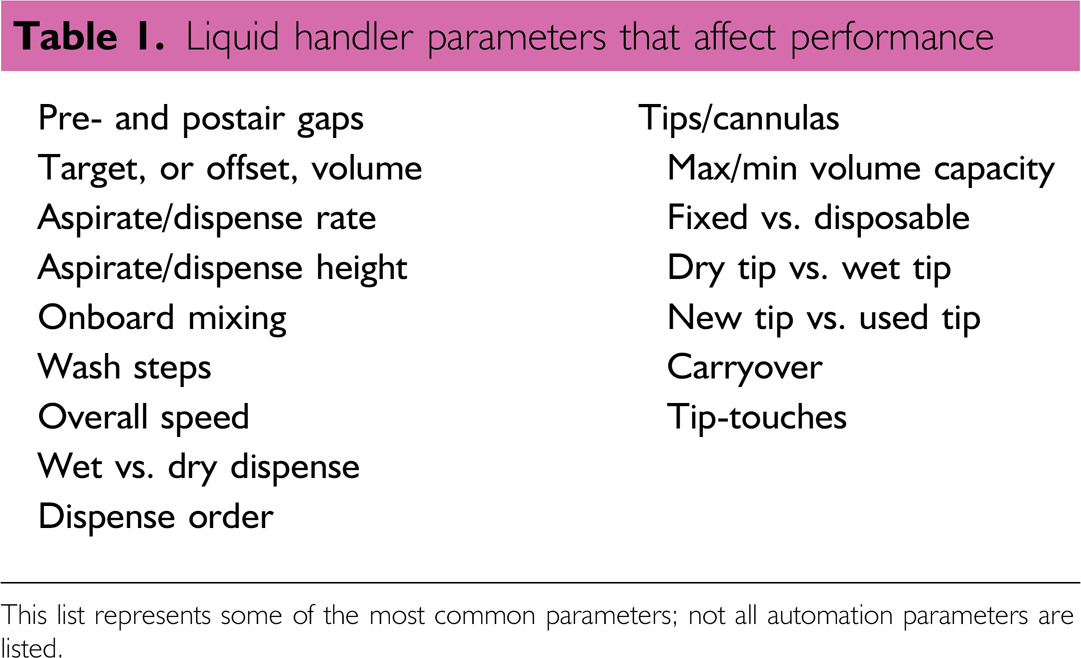
To increase the ease of assay development and to generate better quality data, it is important to understand how volume transfer steps can influence performance. When multiple automated liquid handlers are used in a process, each volume transfer step from each liquid handler is tied to the success of the process. Failure in any step of a complex process will have a detrimental effect. For instance, if a serial-dependent system uses 10 automated liquid handlers and each functions perfectly 99 out of 100 times, then the process will correctly work about 90% of the time. 5 On the other hand, if those liquid handlers correctly function 90 out of 100 times, then the process will correctly work about 35% of the time. 5 An underlying emphasis is to use a robust volume verification method at all stages of assay development to know how well a liquid handler is functioning at each stage. Liquid handler dispensing behavior can, in part, be affected when automation parameters, or procedural variables, are modified for volume transfer tasks. Table 1 lists a few of the common automation parameters relating to liquid transfer. A robust volume verification method can be an essential tool to facilitate the optimization of automation tasks by measuring changes in the amount of transferred volume resulting from adjustments to these and other automation parameters.
Liquid handler parameters that affect performance
Volume Verification Methods
There have been many reports about the need for volume verification methods and there are a few proven methods for checking the accuracy and/or precision of volume transfers.6–22 Most of these methods include photometric (fluorescence, absorbance) and gravimetric processes or a combination thereof. The focus of this paper is not to discuss the advantages or disadvantages of any method, but rather to stress the importance of using a reliable, robust method for proper volume verification at all stages of laboratory work. Ideally, the evaluation method should be analytically implemented with documented procedures and the method should be relatively quick and easy to integrate into a laboratory to minimize instrument downtime and required resources (labor, reagents). As the scientific community becomes more dependent on regulatory compliance, documentation, and system validations, standardized volume verification methods producing results that are traceable to the International Systems of Units may, in fact, become the preferred, or required, approach for quantifying dispensed volume. Traceable verification measurements may allow for the creation of standard operating procedures for liquid handlers in good manufacturing practice (GMP), and good labratory practices (GLP) laboratories and may also help when developing a performance qualification for an isolated volume transfer task or for a group of tasks. Volume transfer for critical target reagent screening should be standardized to compare all liquid handlers within a laboratory and the verification method should mimic the assay transfer task, that is, follow the same automation parameters as the assay.
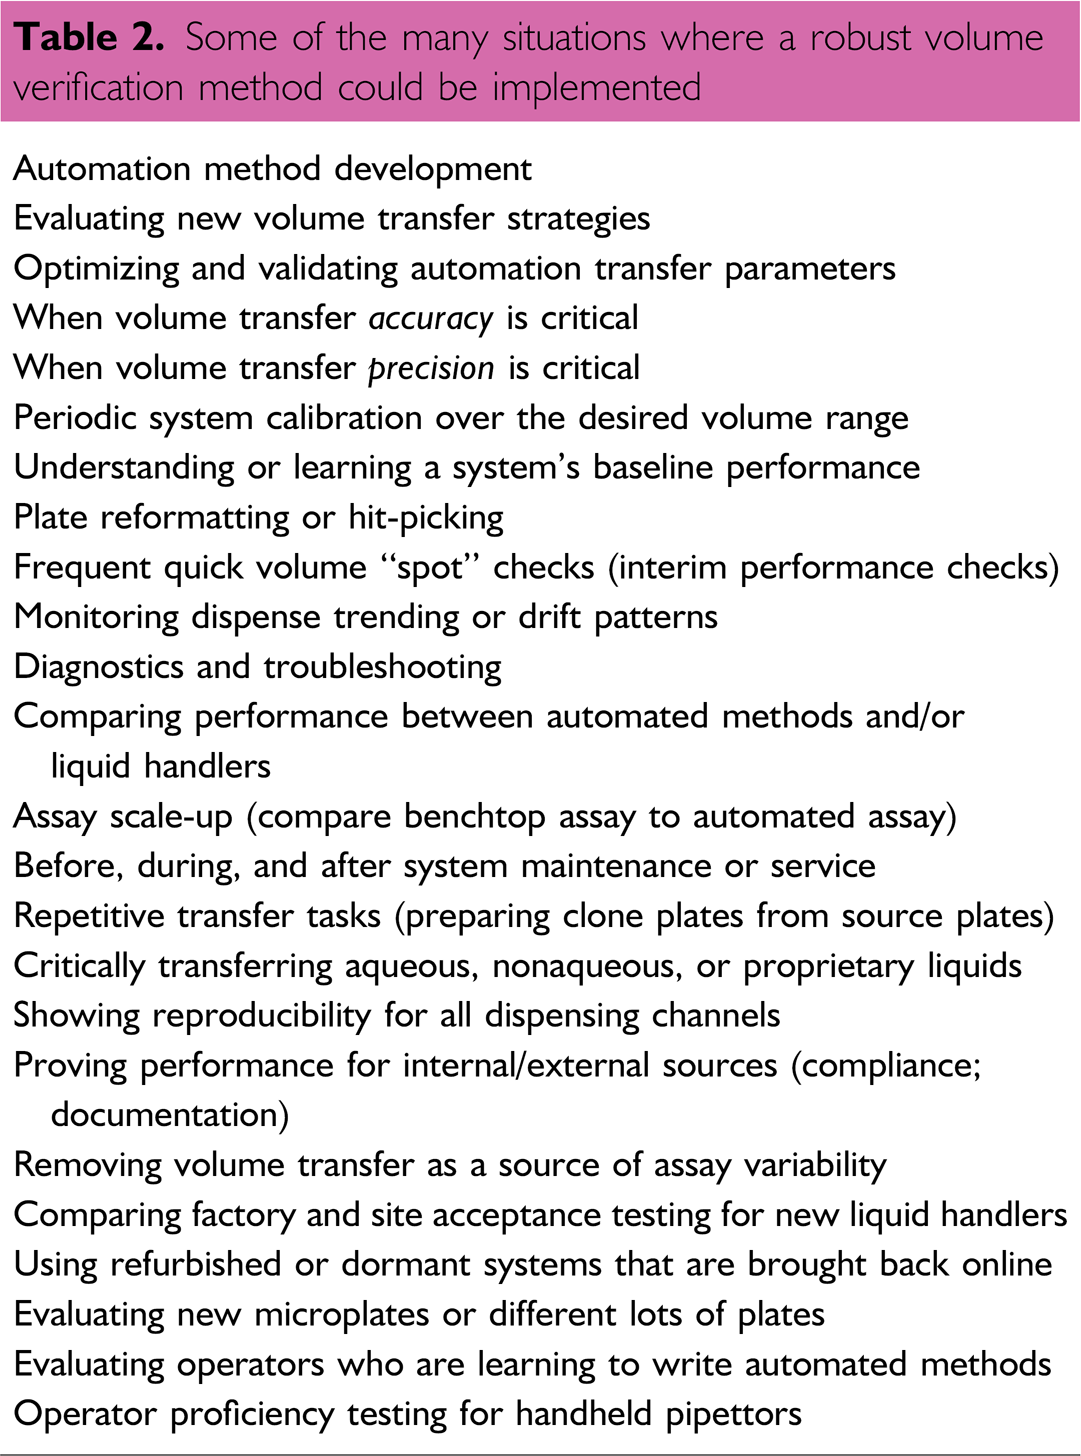
The importance of a volume verification method cannot be underestimated and such processes could enable, or at least facilitate, faster assay optimization where there is currently a significant bottleneck. 23 High accuracy for automated liquid handling as well as the refinement of the technologies used for detection are becoming more and more critical. 24 One area of critical importance of a volume verification method is troubleshooting and diagnostics. A recent study showed that a liquid handler's system fluid was diluting the sample volume and these findings were only discovered after comparing two volume verification methods side-by-side, 22 that is, the photometric method was able to detect the sample dilution effect whereas the gravimetric approach could not. A volume verification method can also be used to facilitate the transfer of benchtop assays to an automation platform to show improvements in robustness, stability, and to monitor assay variability. 14 Table 2 lists some of the many situations where a volume verification method should be implemented within a laboratory or process. A rapid, versatile verification method also allows automation parameters to be modified on-the-fly during developmental stages for quick optimization and validation before system use. By knowing exactly how each liquid handler is dispensing within each assay, it may become apparent when maintenance or calibration is required. Regardless of the frequency between calibration intervals, a verification method should be used for interim checks between intervals to replace ‘faith-based’ performance monitoring, which helps operators know exactly when liquid handlers fail assay-specific tolerance limits. Performing frequent quick volume spot checks also allows the user to have confidence in the automation methods and potentially avoids the initial loss, or unnecessary destruction, of rare or expensive reagents. For many situations in a process, it might be important to ask questions about each step, such as: What is the goal of the transfer step? Is the accuracy and/or precision critical? Is the performance of the liquid handler good enough for a given assay? Does the system need to be calibrated and subsequently validated? What is the desired volume range? Can the dispensing technique be improved to accurately transfer the target volume? If the target volume is not exact, is it better to underdispense or overdispense? What are the assay's experimental tolerances? It is important to note that these and other questions should be critically evaluated for each user-specific volume transfer task. This report shows examples of collected data and answers some of the above questions for a few general applications listed in Table 2.
Some of the many situations where a robust volume verification method could be implemented
Multichannel Verification System
The Multichannel Verification System (MVS) was used for all volume verification measurements reported herein and this system and technology have been discussed in detail elsewhere.6,10,20–22,25 Briefly, the MVS consists of dye-based sample solutions, a plate reader, a microtiter plate shaker, a barcode reader, laptop with software, and all components are placed on a mobile workstation (cart). The liquid handler is used to dispense the MVS solutions into dimensionally characterized microtiter plates. The solutions are thoroughly mixed on the shaker and photometric measurements are acquired using the plate reader. The system simultaneously measures accuracy and precision for each target volume per well via dual-dye, dual-wavelength ratiometric photometry.6, 10
Case Studies Involving Specific Volume Transfer Tasks
As discussed above, it is imperative to quantify critical volume transfers in many different situations for achieving liquid delivery quality assurance. In all cases discussed herein, the volume verification method was used to monitor liquid handler performance by quantifying the transferred volume for specific tasks. The applications and data discussed are simple in some respect but they serve as an important subset of the types of critical information that define liquid handler behavior. In some of the volume transfers included in this paper, an 8-μL gravimetrically-calibrated Hamilton syringe was used as a volume transfer standard. The calibration of the syringes is performed at the Artel Laboratory, which meets the requirements of the ISO/IEC 17025:1999 and ANSI/NCSL Z540-1-1994 standards.
Automation Method Development and Optimization
A Caliper Sciclone ALH 3000 with a 96-channel high-volume head (HVH) was used to dispense target volumes of 2 μL and 8 μL, each into a 96-well plate format. The system was initially used to dispense the target volumes with no optimization of the automation parameters. The nonoptimized results for the transferred mean volume for the 2-μL and 8-μL dispenses were 1.551 μL (±0.162 μL) and 7.233 μL (±0.091 μL), respectively (Fig. 1). Adjustments were then made to the automation method's aspirate/dispense rates and requested volume, to produce more optimal results. The optimized method's mean transferred volumes for the 2-μL and 8-μL targets were 2.034 μL (±0.05 μL) and 8.025 μL (±0.086 μL), respectively. Within minutes, the liquid handler was optimized for both target volume dispenses.
The relative inaccuracy and CV of dispensing target volumes of 2 and 8 μL were measured before and after adjustments were made to a few of the automation parameters. Within minutes, the methods were optimized and validated. The “not optimized” data were acquired with aspirate and dispense rates of 40.5 and 85.5 μL/s, respectively, and the requested volumes were 2 and 8 μL, respectively. The 8-μL “optimized” data were acquired with both the aspirate and dispense rates at 5.5 μL/s and the requested target volume was 8.8 μL. The 2-μL “optimized” data were acquired with both the aspirate and dispense rates at 3.5 μL/s and the requested target volume was 2.5 μL.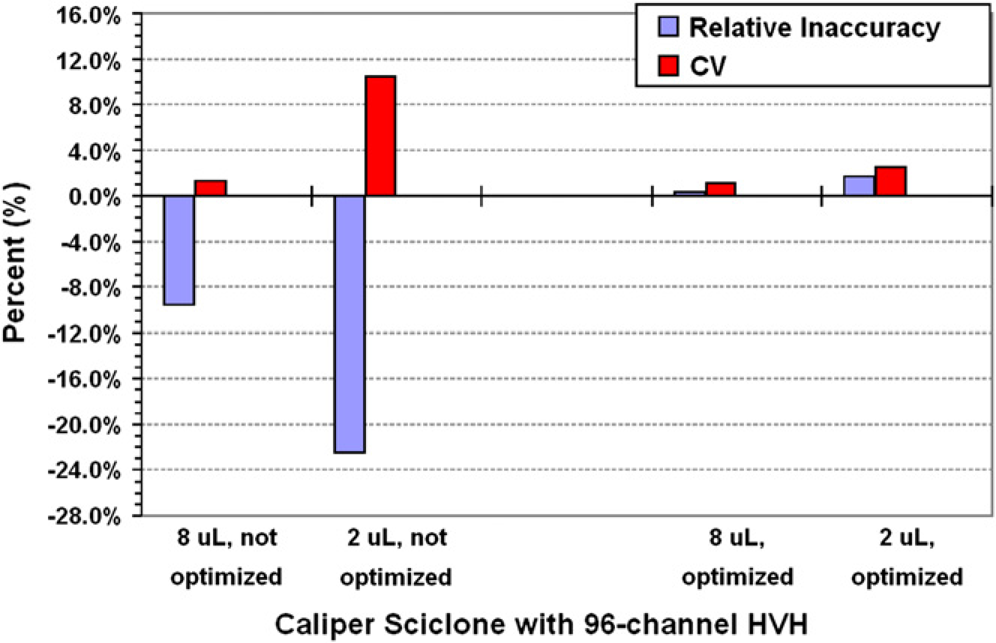
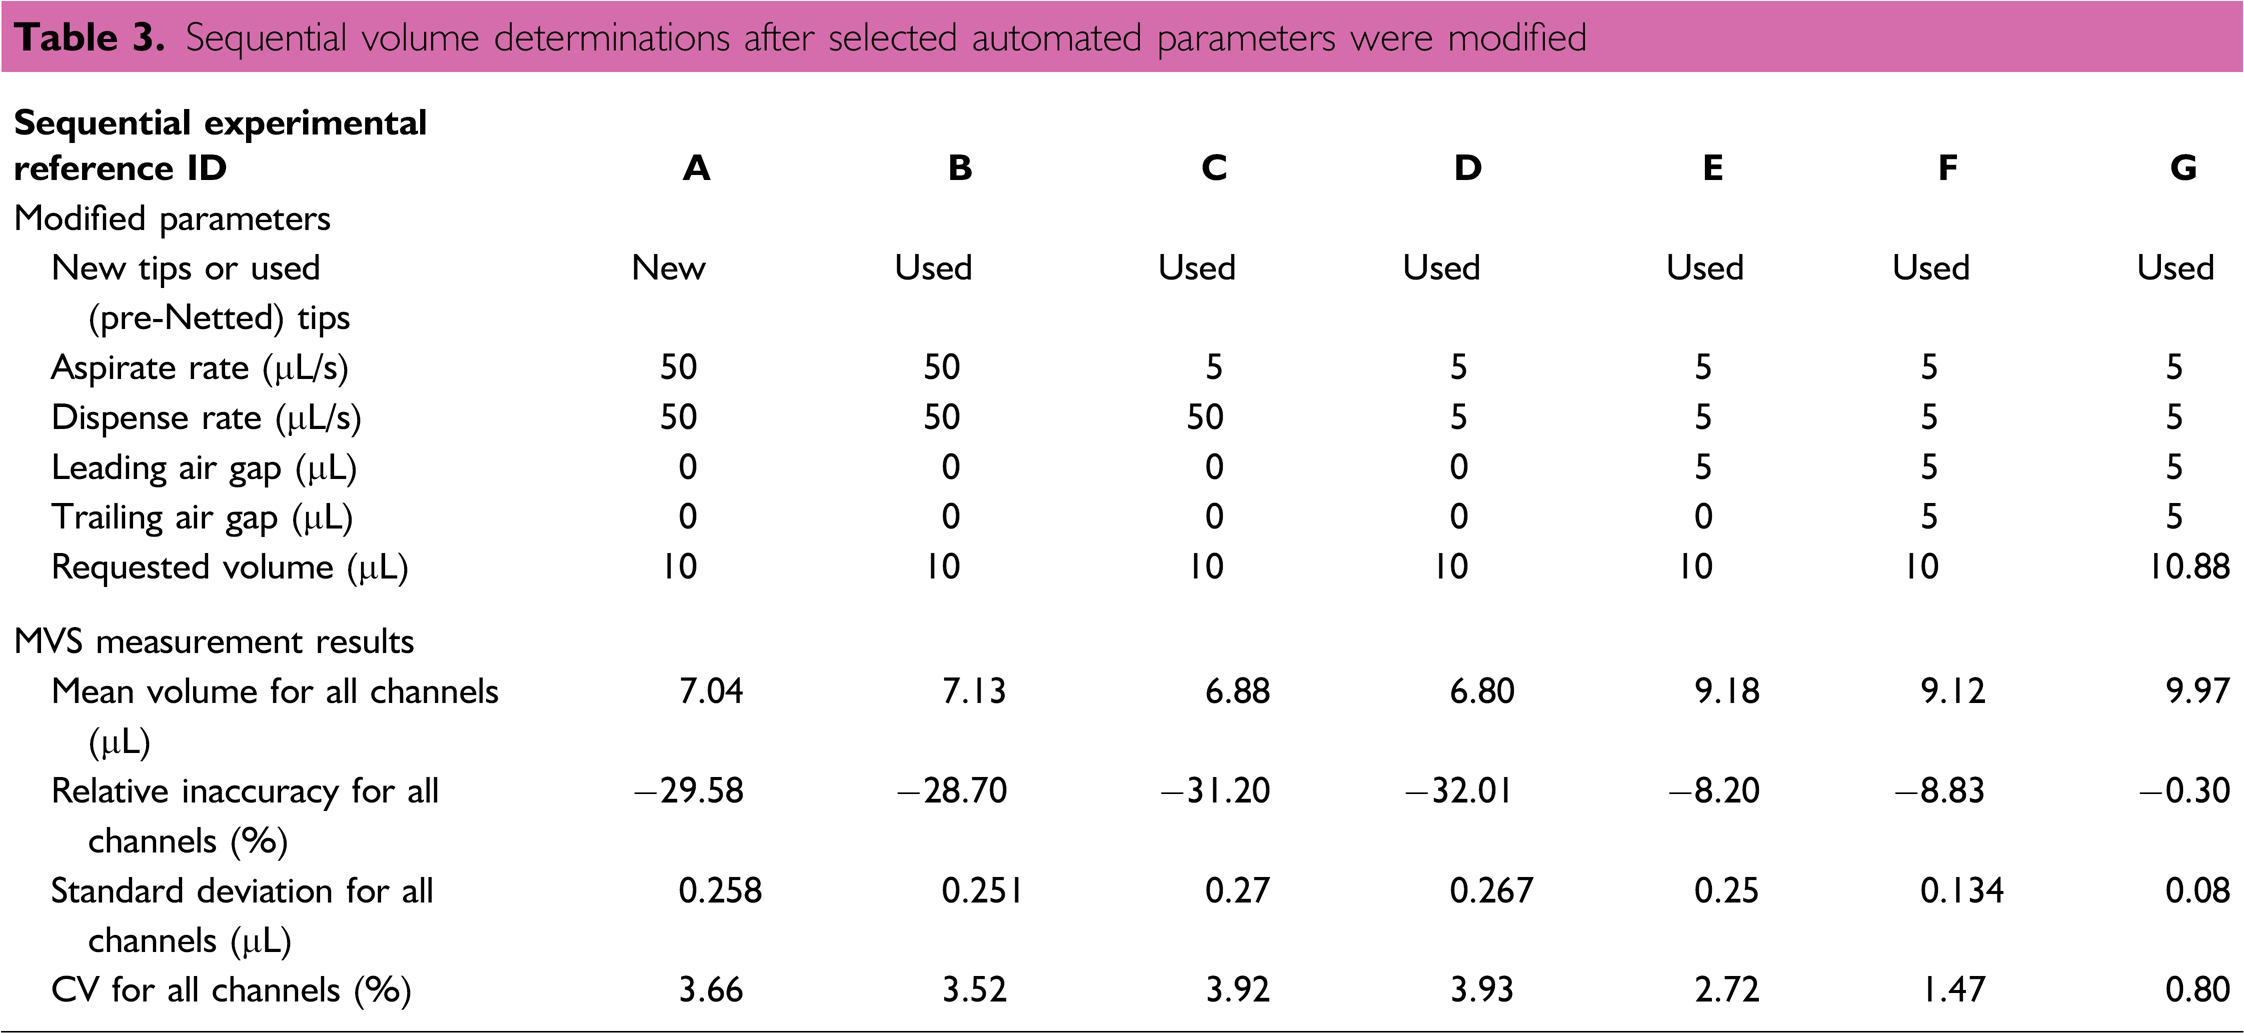
Another optimization study used the Sciclone and the 96-channel HVH to dispense a target volume of 10 μL into a 96-well plate. For this work, all automation methods used high-level commands in the Sciclone software. As shown in Table 3, the automation parameters were sequentially manipulated and the resulting dispensed volume was measured after adjusting each parameter until the target volume was achieved. Though this process for optimizing the automation task could have been performed with alternative approaches (different parameters, different order, defining liquid classes, etc.), this process highlights the importance of a cause-and-effect volume verification method used on-the-fly during method optimization. The results show that the initial ‘as found’ relative inaccuracy and coefficient of variation (CV) data were –29.58% and 3.66%, respectively. After six sequential parameter adjustments, the optimized data reflect relative inaccuracy and CV values of –0.30% and 0.80%, respectively.
Sequential volume determinations after selected automated parameters were modified
Automation Method Validation and Channel-to-Channel Reproducibility
Once the automation parameters were optimized for the 10-μL transfer task (Table 3, column G), they were used to dispense three replicate plates to validate the method and quantify statistics for each independent channel. The optimized automation method was validated to dispense a measured mean volume of 10.04 μL (±0.12 μL) with relative inaccuracy and CV of 0.40% and 1.20%, respectively. The results were further analyzed to check reproducibility from channel-to-channel to monitor any potential problems, such as inconsistencies and/or edge effects, for the 96-channel head into the three 96-well microtiter plates. There is always a chance that individual channels within a multichannel liquid handler perform with some variability. Defining this variability, or determining which channels “misbehave”, allows assay results to be properly interpreted and may help predict the need for system maintenance. A volume verification method should be able to measure performance data on a channel-by-channel basis. There were three individual channels that showed relatively larger standard deviations compared to the other tips and a surface plot was used to show that the middle of the 96-channel head was dispensing slightly higher volumes compared to the front row of the dispensing head (Fig. 2, row H).
Channel-to-channel reproducibility for a 96-channel Sciclone dispensing a target volume of 10 μL. (A) Two-dimensional representation of mean volume and standard deviation (error bars) for each independent channel. (B) Three-dimensional surface plot showing the mean volume across the 96-channel head. All accuracy and precision data were simultaneously collected for each of the three replicate plates used in this study and the data shown are the averaged values for each tip.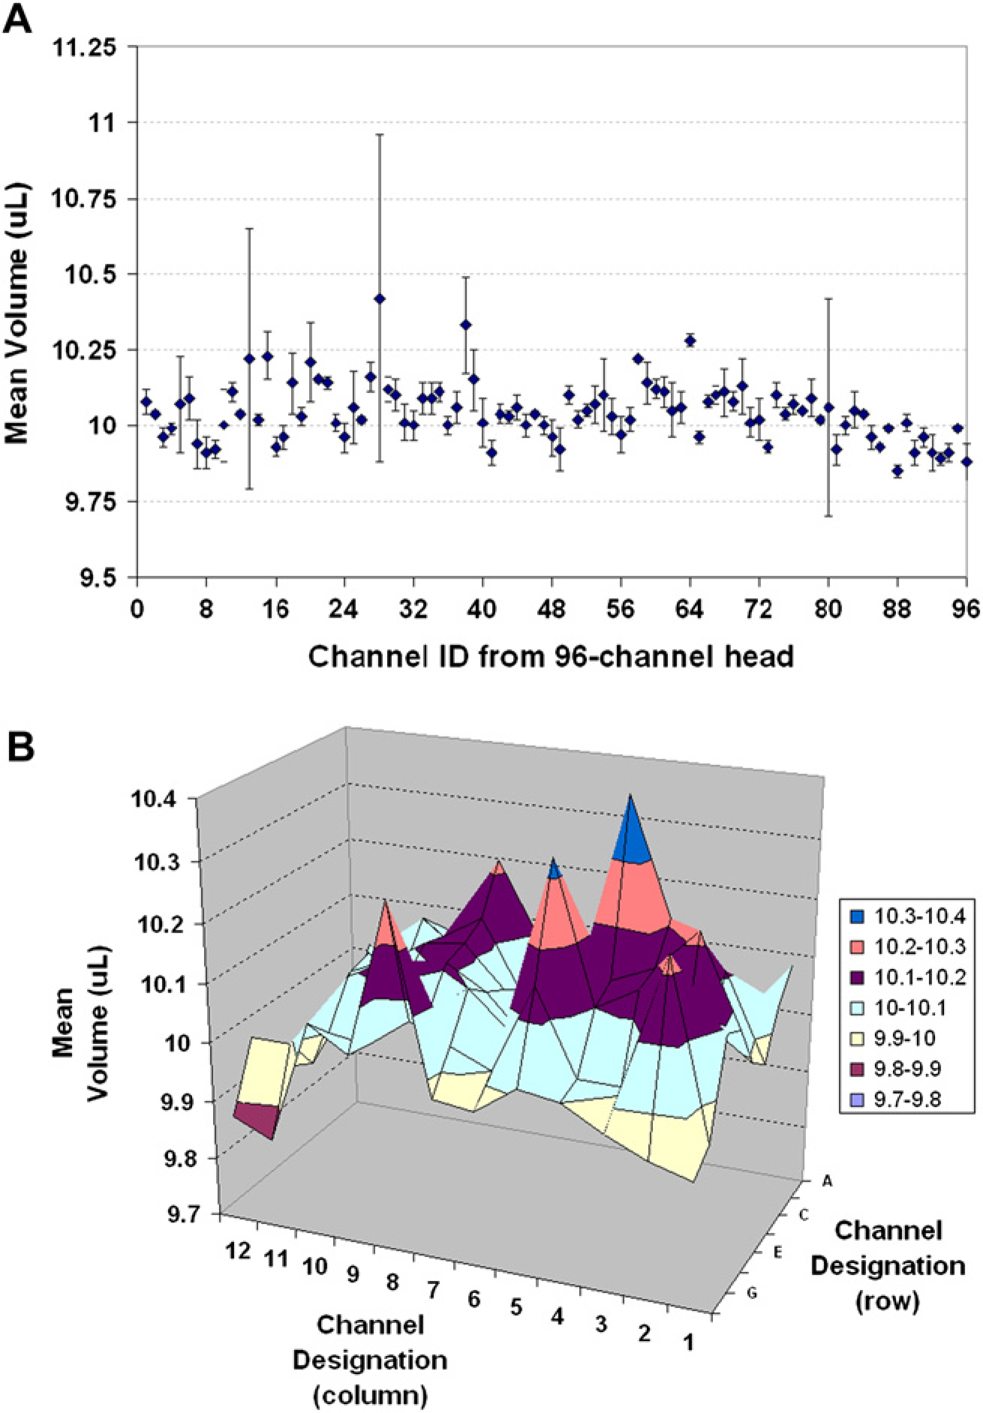
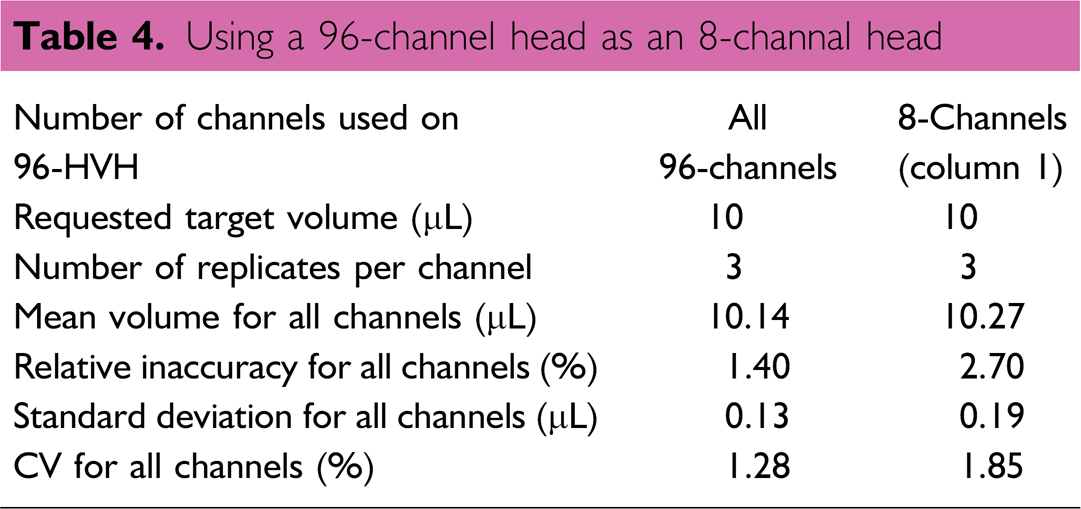
Channel-to-channel reproducibility checks might also be important if unique volume transfers are performed with automation equipment. For instance, a different set of automation methods were written to use the 96-channel head as an 8-channel head. In other words, only eight of the 96 channels were used (column 1 of the 96-channel head). In this situation, the operators wanted to understand the differences between dispensed volumes from the two head configurations when the 8-channel configuration was used for serial dilutions in a 96-well plate. For this task, the prepared automation method used all low-level commands in the Sciclone software. In both cases, three replicate dispenses were performed for each head configuration and though the two automation parameters were scripted differently, the resulting dispensed volumes were directly compared. The results in Table 4 indicate that the 96-channel head does not behave too differently for the automation methods when used as an 8-channel device. The percent difference between the measured mean volumes is 1.28%. Moreover, if optimization of the automation parameters were performed, it is likely that the dispensing performance for the two configurations could have been more similar. Interestingly enough, the two different automation tasks prepared for the 96-channel head show slightly different results for a 10-μL dispense, which can possibly be attributed to using a different methodology in the Sciclone software, that is, high-level vs. low-level commands, and not optimizing the methods side-by-side.
Using a 96-channel head as an 8-channal head
Device-to-Device Comparison
Eight different pipettors, which included both manual and automated devices, were directly compared for dispensing performance when transferring a target volume of 8 μL (Fig. 3). Because the volume verification method's measurement results are traceable to international standards, performance can be directly compared regardless of liquid handler make, model, manufacturer, or location. The eight liquid handlers all show slight differences in performance and these differences could be very important if the devices were used in parallel, that is, in assay scale-up, transfer, or for preparing reproducible samples. These sorts of comparisons might be critical if equipment is new, if it is transferred from another laboratory, if the equipment has been dormant and is being brought back online, or if the equipment is being directly compared to a “standard” or calibrated liquid handler.
Eight pipetting devices were compared for an 8-μL target dispense. Dispense data for single-channel devices were collected in replicates of eight and included (A) an 8-μL calibrated Hamilton syringe with a 10-μL barrel; (B) a Hamilton electronic syringe with a 10-μL barrel; and (C) a 2–20 μL Eppendorf manual pipette. Dispense data for eight-channel devices were collected in replicates of three and included (D) a 0.2–10 μL Biohit Proline electronic pipette; (E) a 20–200 μL Rainin electronic pipette; and (F) a 20–200 μL Rainin manual pipette. Dispense data for two 96-channel automated liquid handlers included (G) Caliper Sciclone with a 96-channel HVH and (H) a CyBio CyBi-Well Vario with a 25-μL head. The data shown for the two automated liquid handlers were acquired after adjustments were made to the automation parameters.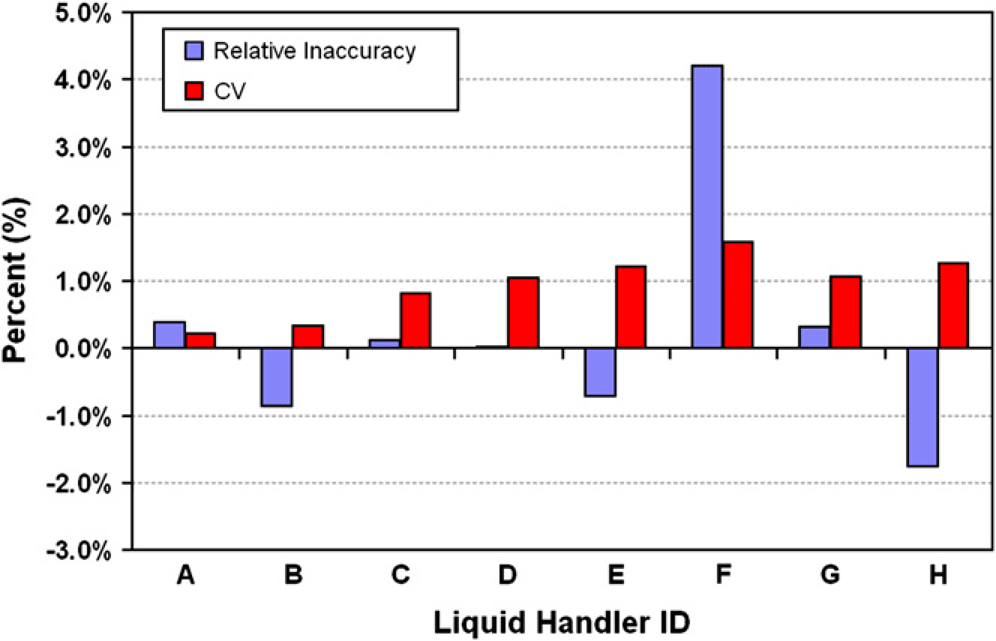
Monitoring Trending Patterns of Sequential Dispenses
It is quite common to aspirate a large volume followed by sequential, smaller-volume dispenses to multiple wells, rows, columns, or even multiple plates. A robust volume verification method can be used to identify statistical relationships between sequential dispenses and to characterize dispense trending to avoid a possible ‘first shot’ or ‘last shot’ effect where the first or last dispense of a series is often different from the other dispenses. A quick study was used to monitor differences in pipetting from two different operators, who each performed sequential dispenses in a 96-well plate. Both operators used the same measurement system, materials, and 20–200 μL Rainin electronic 8-channel pipette. In each case, 20 μL was dispensed into the first column of the 96-well plate (as a control) and the pipette was then used to aspirate 200 μL and sequentially dispense 20 μL into columns 3–12. Both 96-well plates from the two operators were prepared and volume-verified within 10 min of each other. The transferred volumes for the control column for each operator are near identical, but the sequential dispense data show significant differences between operators. The plots also show that the multisequential dispense protocol produces a similar dispense pattern (relative inaccuracy for columns 3–6, 9–12), but the data are not the same (Fig. 4). In both cases, however, the first dispense (column 3) of the sequence shows a relatively large inaccuracy (overdispense) and column 12 shows a significant underdispense. These data show the significance of comparing assays between groups, whether they are groups of operators, groups of automation tasks, or groups of different liquid handlers. In this case, either the instrument did not reproducibly deliver each aliquot of the multisequential dispense or, and more likely, the two operators used different techniques (tip depth in solution for aspirate and dispense steps; angle of the pipette during each transfer; new tips vs. used tips after the control dispense; amount of time allocated to each transfer; tip touches on sides of the wells; etc.).
The MVS was used to monitor the differences in performance when two different operators (A, B) used an eight-channel handheld electronic pipette to sequentially dispense 20 μL. The testing procedure consisted of dispensing 20 μL into column 1, and columns 3–12 of a 96-well verification plate. Column 1 was a ‘single dispense’, where 20 μL was aspirated and directly dispensed (control). Columns 3–12 consisted of ‘multisequential dispenses’ where 200 μL was aspirated into the tips and 20 μL was sequentially dispensed starting with column 3 and ending with column 12. The multisequential dispense performance differs from operator-to-operator and in both cases, the volume delivered was not reproducible between operators.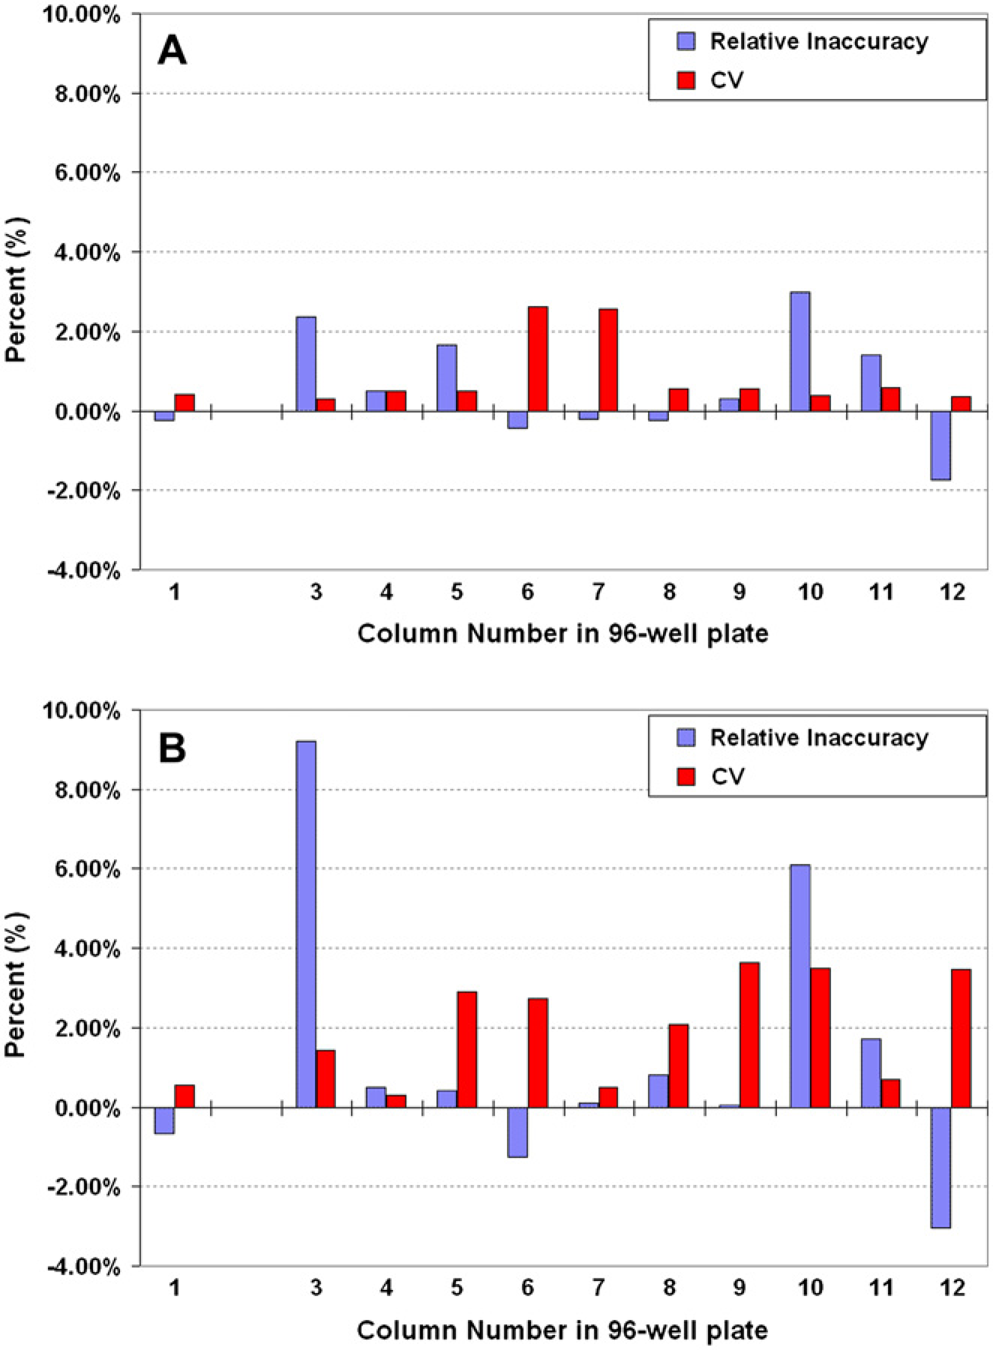
Testing Various Liquid Types
Liquid handlers are certainly capable of handling a wide array of reagent types, but it is commonly known that performance parameters can vary between different types of liquids. If a system is validated or calibrated for accurately dispensing water, but is used to dispense a different type of solution, the performance characteristics could be quite different for the test liquid. It can be very helpful if the volume verification method provides a means to which different test liquids can be quantified in a single, simultaneous measurement for both accuracy and precision. The methods used to prepare and test different liquids will not be discussed further herein (the details have been recently reported 21 ). The three prepared alternative test solutions were composed of (vol/vol) 20% glycerol in water, 50% ethanol in water, and 90% DMSO in water. Using an 8-μL calibrated Hamilton syringe with Chaney adapter, the 100% aqueous MVS solution and the three various test solutions were dispensed into a 96-well plate in replicates of eight. All the solutions were dispensed to have measured relative inaccuracies !1.5% (Fig. 5). The ability to verify dispensing performance for assay-specific reagents, that is, complex and/or nonaqueous solutions, can be an advantage of some volume verification methods because the methods can help an operator define and validate liquid class parameters within a liquid handler's software package.
Using an 8-μL calibrated syringe, four different test liquids were dispensed in replicates of eight into a 96-well microtiter plate.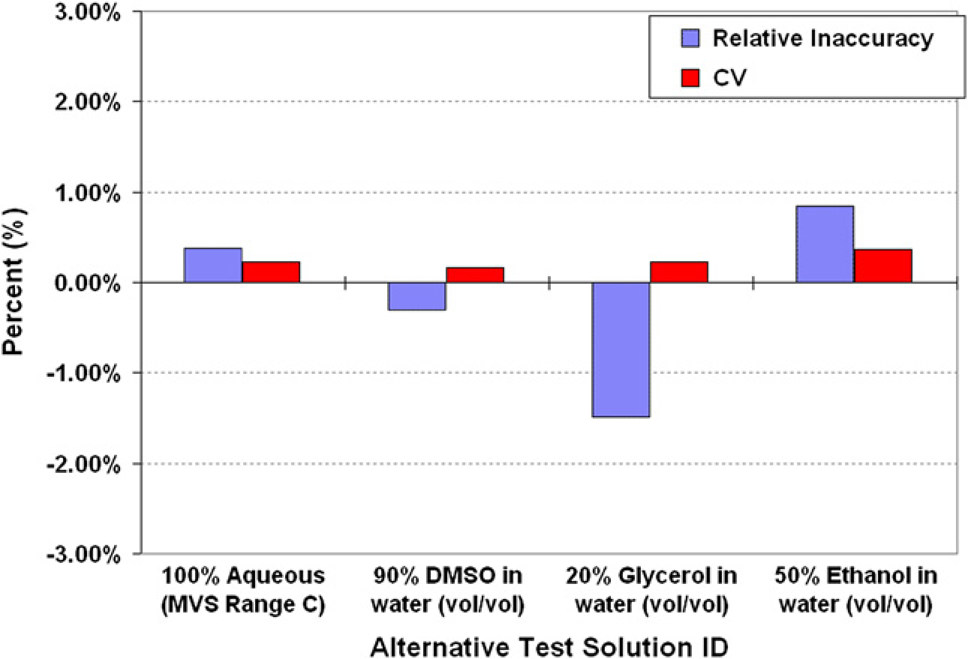
Proper Execution of the Volume Verification Method
A very important facet of understanding liquid handler performance is proper execution of the volume verification method. If the volume verification method is not properly implemented, a false sense of liquid handler performance could result. In photometric-based verification methods, solution mixing and the type of microtiter plate are critical. Volume verification methods that average data across multichannel head types (common with gravimetric methods) might not observe a channel “misfire” due to averaging the data and these results might go unnoticed until the liquid handler is used for an assay. The data presented below show two different scenarios where the volume verification methodology, if used with different steps or materials, could result in different perceived performance of the liquid handler.
Proper Integration of the Volume Verification Method: Plate Mixing
In the case presented herein, a two-dye sample solution and a mixing step were used to emphasize how the results can be very different if the verification method is not fully implemented (or validated). For photometric verification methods, proper sample mixing cannot be stressed enough and without it, the verification method may not be useful in monitoring dispensing performance for a liquid handler. In fact, without proper mixing, the performance for the liquid handler could be misinterpreted, especially when dispensing into 384-well and higher density plate formats, where the mixing step becomes even more critical and challenging. 26 An experiment was designed and executed to monitor perceived performance of a device before and after solution mixing. Using a 2–20 μL Rainin electronic 8-channel pipette, a 2-μL target volume was dispensed into columns 2–12 of a 96-well plate. Column 1 of the plate was used to hold a premixed dye stock (control), which did not correlate to a 2-μL target volume, that is, the study focused on monitoring the change in CV. The plate was mixed on a Big Bear Automation shaker (model HT-9100-1), with a 1 mm orbital rotation, for 60 s at 2000 rpm. The volume was measured using the MVS before mixing and after each sequential mix (Table 5). The CV in the measurement before mixing was nearly 37%, which was drastically reduced to a plateau value of approximately 1.2% after multiple mixing steps. As opposed to the measured performance before mixing, the liquid handler's performance could only be assessed after the verification method was properly implemented and executed. In this case, the perceived performance of the liquid handler, could have led to misguided data interpretations if the mixing step was not performed (or not performed correctly). Regardless of the volume verification method used, if the method is not properly documented and implemented, the performance data and information might be suspect, or, at worst, be meaningless.
Measured CV% for a target volume dispense before and after mixing
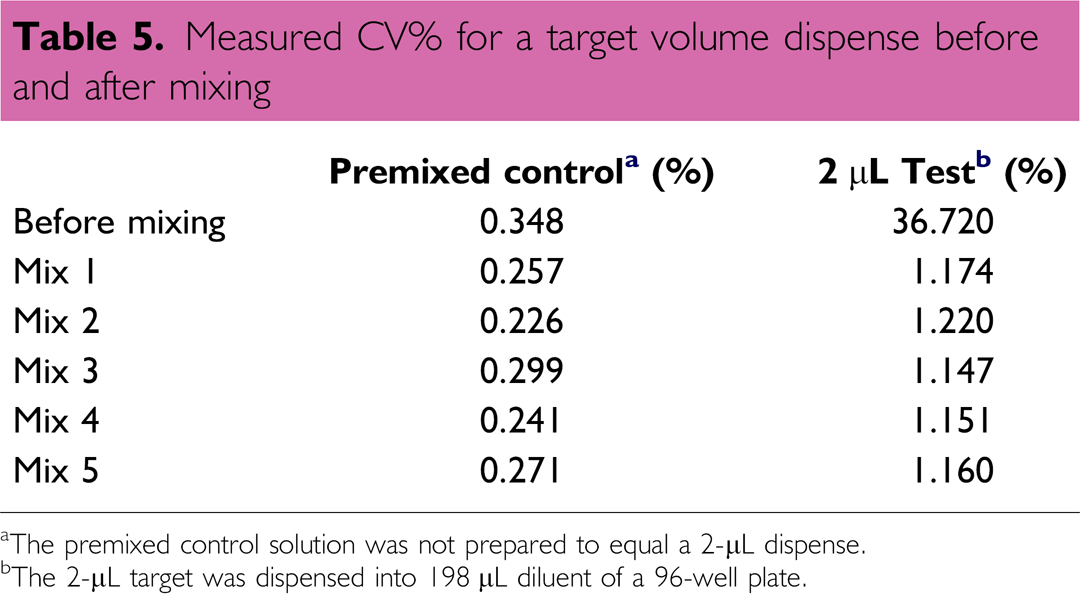
The premixed control solution was not prepared to equal a 2-μL dispense.
The 2-μL target was dispensed into 198 μL diluent of a 96-well plate.
Proper Integration of the Volume Verification Method: Plate-to-Plate Correlation
Because microtiter plates have become an essential component for so many assays, careful selection of these plates can have a significant impact on the success of the volume verification method. Therefore, it might be necessary to take into account the dimensional differences in well size/shape between plate types so that proper volume measurements can be acquired. Differences in measurement results could be observed if plate types, or lots, are interchanged in the verification method. Three different, optically clear, flat-bottom plate types, in replicates of three, were used to compare and correlate measured volume for 20-μL transfers. In this correlation experiment, a 20–200 μL Rainin electronic 8-channel pipette was used to dispense 20 μL into each column (3 plates × 12 columns = 36 total dispenses). The plate manufacturer's dimensional information for each plate type (top diameter, bottom diameter, and well height) was used in the volume measurement calculation. 10 The measured volume differences between the three plate types were relatively minor for a 20-μL dispense, resulting in a ~4% difference between the average dispensed volume for the Nunc plates vs. the Greiner plates, and indicating that the performance of the liquid handler is based on the materials used (Table 6). These differences, however, could have been more pronounced for a smaller target volume delivery. Microtiter plate dimensions for each type can usually be obtained from the manufacturer but it is recommended that volume-to-volume correlations be repeated when a new lot of plates is used because well dimensions do vary. In many cases, plate types should be dimensionally characterized or correlated to plates of known dimensions to account for any differences in measurement performance.
Plate-to-plate correlation for dispensed volume (in μL)
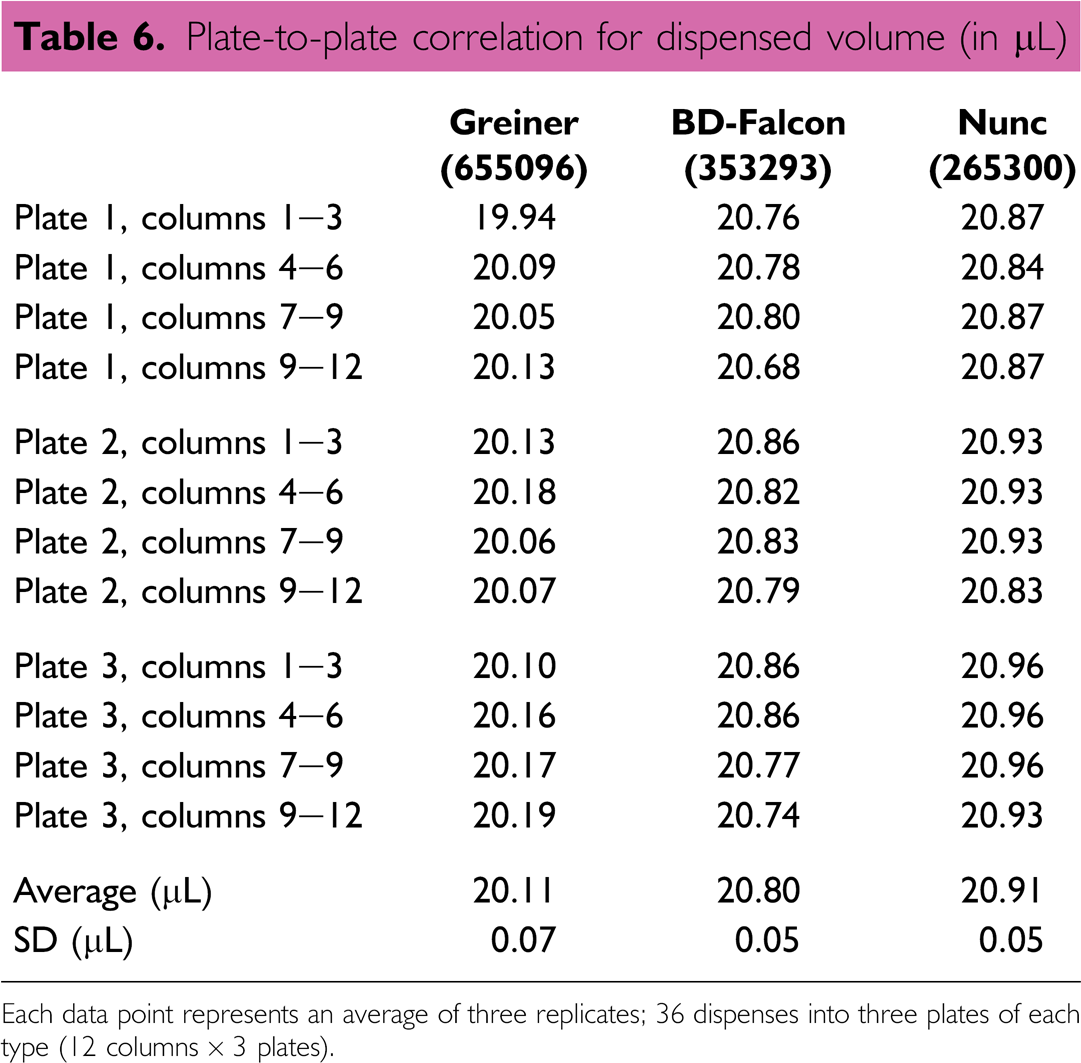
Each data point represents an average of three replicates; 36 dispenses into three plates of each type (12 columns × 3 plates).
Conclusions
If automated liquid handlers are not dispensing the exact, or desired, volume for critical reagents, then it is likely that unseen error can increasingly propagate as a process continues. Without knowing the exact volume transferred at each step from each liquid handler, for instance, true concentrations of species in solution may be unknown and results could be falsely interpreted. Even slight discrepancies in delivered volume can compromise results, leading to poor quality (or useless) data and downstream costs associated with remedial actions. The economic impact of allocating resources for research or production efforts, which is based on potentially false results, may be severe. Moreover, if the liquid delivery systems are overdelivering target volumes of expensive and/or rare reagents, then there may be a significant economic impact due to the loss of precious materials. The resulting downstream economic loss suggests that a method of performance evaluation should be continuously implemented to verify that all liquid handlers are accurately dispensing critical volumes. As process control within a laboratory continues to be emphasized, a volume verification method should be implemented so that liquid handler behavior is known and optimized to deliver the desired target volumes for all levels of assay development, even when those reagents are complex and/or nonaqueous. A robust and reliable volume verification method should be implemented to serve as an essential tool for knowing an assay's exact volume and component concentrations, which is critical for assay interpretation, optimization, avoiding unnecessary downstream costs, and achieving liquid delivery quality assurance.
Footnotes
Acknowledgments
The authors would like to thank Tanya Knaide (Artel) for collecting the data on the CyBio liquid handler and Ben Spaulding (Artel) for collecting the plate mixing data.