
Abstract
The push for higher throughput screening coupled with the desire to use smaller volumes of material has sparked the development of new technologies. Caliper Technologies, Corp. (Mountain View, CA) has designed a microfluidics chip with unique properties yet to be fully exploited. The translation from a traditional plate-based assay to a microfluidic chip format has provided insights into assay development, screening data requirements, and the technology itself. Running a screen with this new technology presented challenges in throughput, signal acquisition from slow-conversion enzymes, the provision for a negative control, the translation of a time series into a single data point per compound, reagent adhesion in the channels, and fluid property mismatches. Overcoming these obstacles has resulted in a simple, robust system with significant savings in reagent use. Measures to improve throughput and generalize the system will be discussed.
INTRODUCTION
From vacuum tubes to transistors to integrated circuits, the electronics industry has experienced benefits of miniaturization. Such benefits are most evident in terms of cost, speed, and new applications that can improve everyday efficiency and productivity. In recent years, attempts have been made to duplicate this success in the biopharmaceutical/drug discovery arena. Microchip based technologies have been developed on substrates such as glass, quartz, silicon and commercial polymers for various applications in chemical synthesis and analysis. 1––––––––9 The question of whether it is possible to scale down costly and time-intensive drug discovery processes onto functional microfluidic chips was also raised in the High Throughput Screening (HTS) community. 10–––13
Miniaturization of laboratory equipment can benefit areas of drug discovery including the reduction of concept-to-data time-frame and the space-savings of smaller footprints. Miniaturized systems require the smallest amounts of hard-to-produce reagents, enabling assays not previously possible. The advent of a benchtop HTS device could remove the question of whether to screen, and potentially could increase both data and an understanding of the data through cross referenced compound activities against multiple targets. Designs should include scalability and flexibility. If the entire test apparatus (e.g., reaction vessels, filtration and separation columns, dilution channels, incubators, electrophoretic columns, mass spectrometry components, detector interfaces) were incorporated into a chip, many hidden expenses would be eliminated (e.g., maintenance, reagents, space, assay setup, changeover effort between assays) and new benefits would arise (e.g., individual stations, ease of use, reaction stability). However, achieving volume reductions below ∼1 μL/assay will require fundamental changes in multiple technological areas.
One commercially available system able to perform assays in low, nanoliter volumes is the Caliper® LabChip® instrument. Instead of a plate-based assay, the reagent mixing and detection are done in the channels of a microfabricated glass chip. The chip has wells for reagent loading, and capillaries normal to the surface that can sip from a microtiter plate. This configuration is designed to sip library compounds through the capillary, mix with enzyme and substrate at channel junctions in the chip, and optically detect product downstream after a certain incubation time. Detection is set for a fluorogenic assay, with a diode laser excitation source and a photomultiplier detector with a dichroic filter. Process control is simple. The flow paths are fixed, flow is controlled at a single vacuum port, and reaction volumes of 5–100 nL pass by the detection point. A typical four-hour run needs less than 40 μL of enzyme and substrate. Solution flux is approximately 0.5 nL/min from the two on-chip wells, so enzyme stability is the limiting factor in screen duration. Assay preparation and execution are simplified with the system, and fixed mixtures allow for start-and-walk-away capability. Figure 1 shows a schematic of the chip layout.
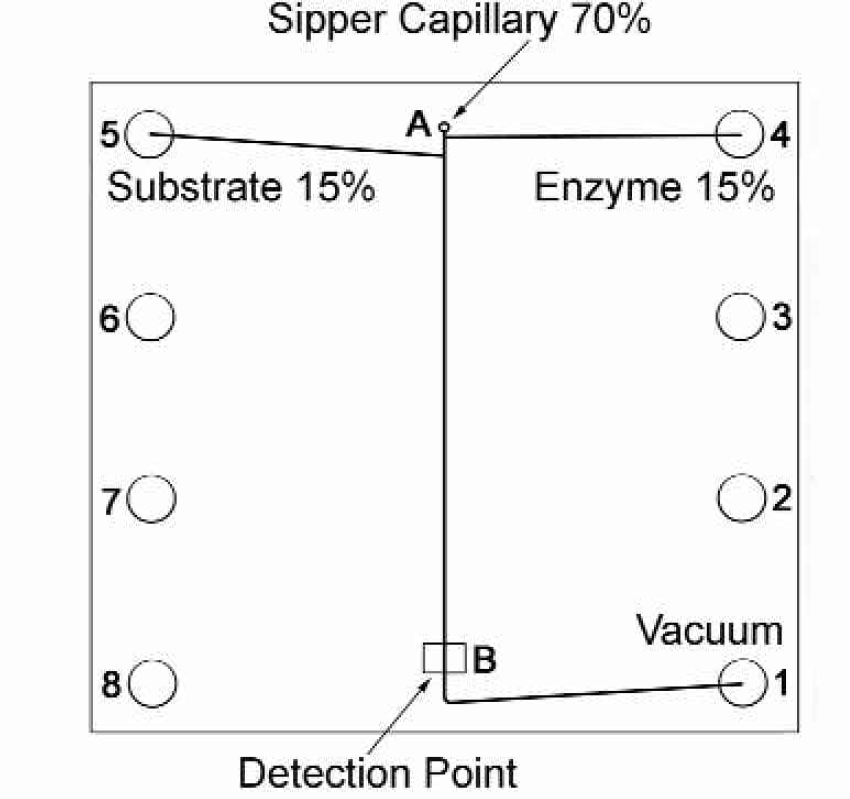
A schematic layout of the inhibition Caliper® LabChip. The proportion of compound from the capillary to on-chip reagents is 70/15/15, respectively. A typical assay consists of test compound being sipped through the capillary (A), enzyme being drawn from well 4, substrate drawn from well 5 and detection at (B).
It would be desirable to take the conventional assay parameters and directly scale them down for use in a LabChip system. The dramatic differences between well and flow-based systems, however, require significant changes to convert the assay. The flow-based system has a fixed path length such that the incubation time for reagents is limited to less than one minute. This short time results in a need for concentrated reagents to get the necessary signal and may exclude enzyme systems with slow kinetics. The flow-based system, by definition, is not stagnant, and has the possibility to build up material on the surface of the channels. Unless additives are included to keep the reagents suspended, the intended composition of the solution of interest may not get to the detection site. The maximum incubation time, from sample introduction to detection, is limited because diffusion of the compound plug will confound neighboring compound activity. For high throughput applications, this time must be optimized. This technology is in its infancy, but some of the benefits are already realized. The footprint of the system is much smaller than the three meter ORCA (Beckman Coulter, Fullerton, CA) rail system (see Figure 2). The system is simpler and more tightly integrated. The fixed geometry of the chip circuitry includes reagent introduction, incubation and detection steps.
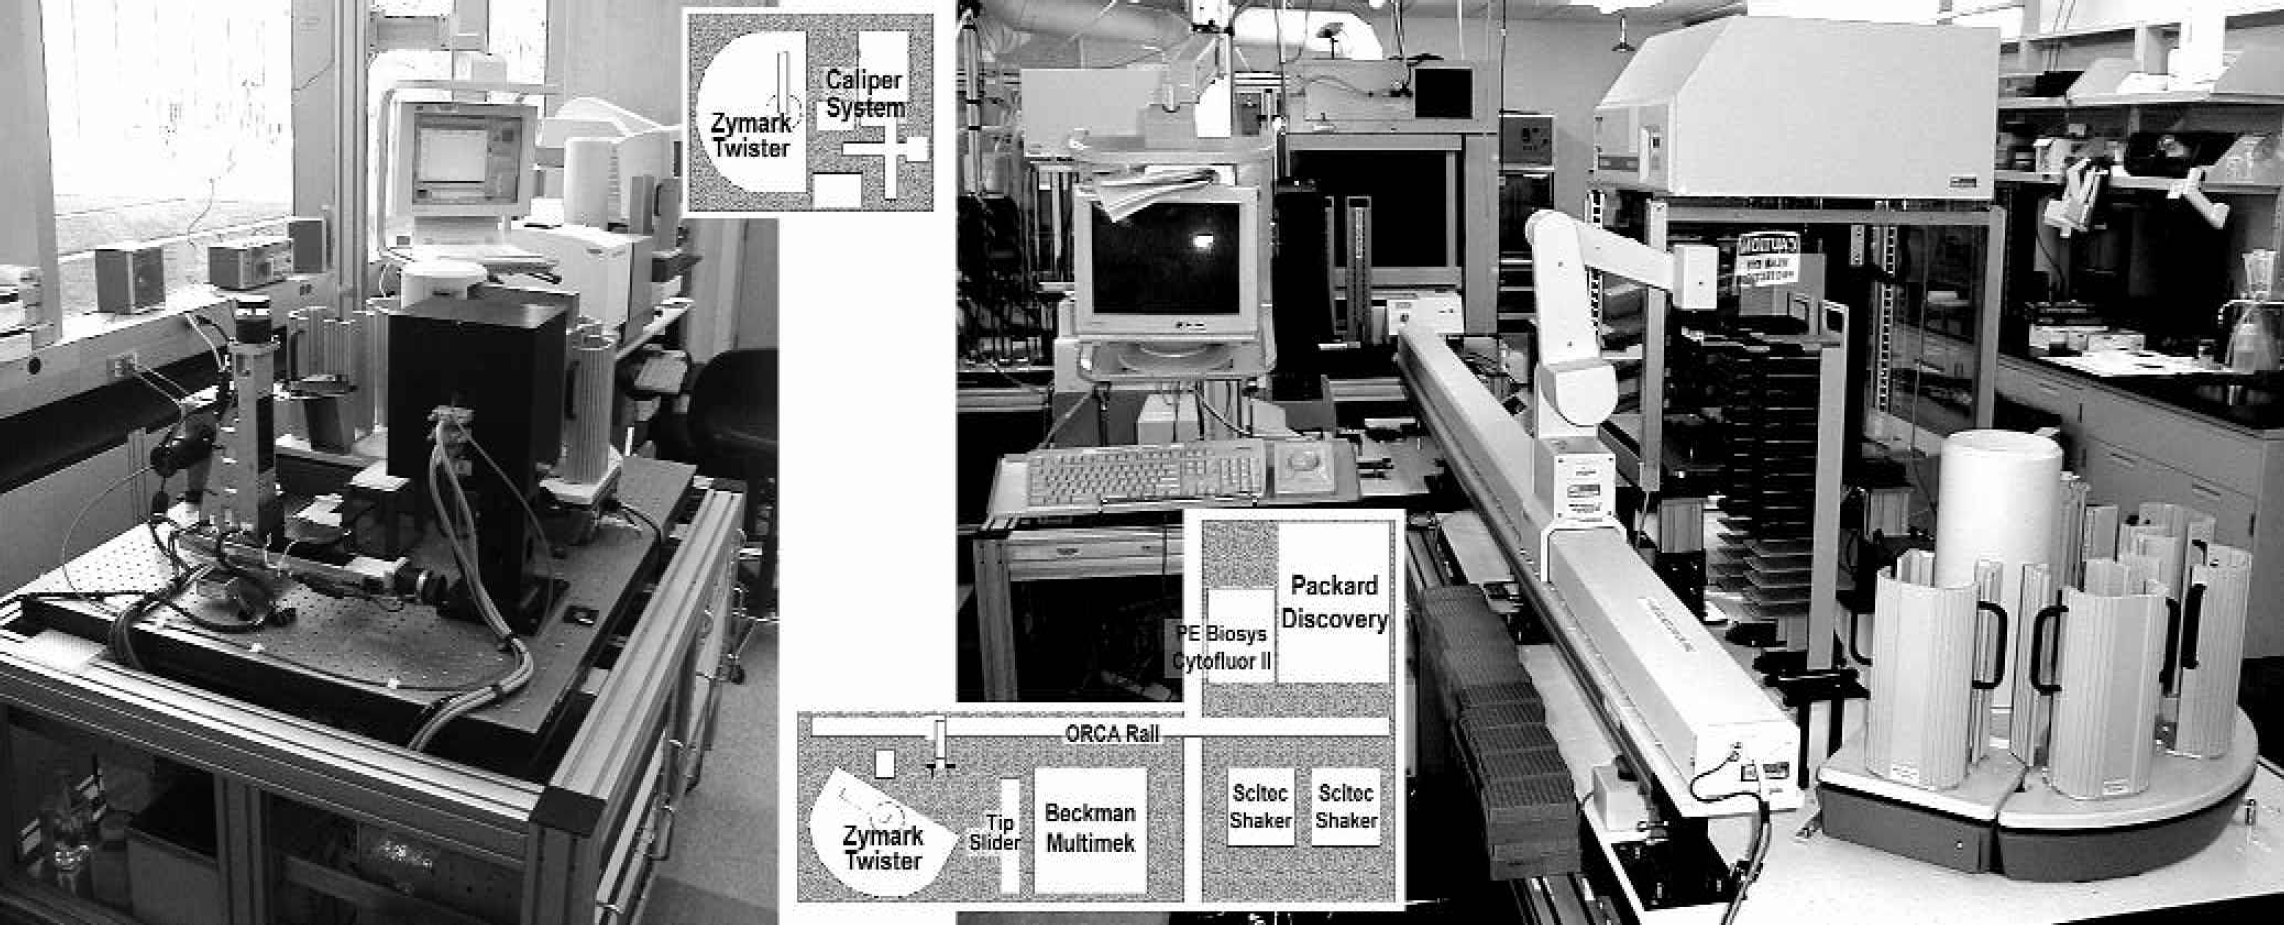
The ORCA and Caliper®-based systems. Inset shows the relative footprints to scale.
This paper compares a conventional integrated automated HTS platform and a Caliper system for a particular screen for small molecule inhibitors of a cysteinyl protease. Reagents were similar for both assays. This paper will discuss the changes required to transition to this new technology in terms of assay parameters and data, and the realized and projected benefits of the transition.
METHODS
CONVENTIONAL SCREEN PLATFORM
A conventional format fluorogenic screen of the protease was run on an integrated automation platform. The platform was constructed in-house and consisted of a three-meter ORCA rail system with an articulated arm for transporting 96-well assay plates and consumables (i.e., tip boxes and reagent reservoirs) from device to device. These devices included a Multimek (Beckman-Coulter) liquid handler, two 17-plate shakers (Scitec, Zymark) for incubation, a Twister robot (Zymark, Hopkinton, MA) for compound plate storage, tip box sliders for automated supply of 20 tip boxes, an eight-reservoir hotel, and a Victor fluorescence plate reader (Wallac). The devices were integrated and controlled by in-house software written primarily in Visual Basic.
CONVENTIONAL SCREEN ASSAY
All compound plates were prepared in assay buffer with a final concentration of 10% DMSO. On each plate, one column was used as positive control (i.e., protease + substrate, no compound), and one column was used as negative control (i.e., substrate only, no compound). The steps in the automated screening protocol were as follows:
Decks of 96 well compound plates (80 wells filled with two columns for positive and negative controls, 80 μL/well) were manually loaded into Twister.
A Compound plate was picked up by the ORCA robot and put on the Multimek.
Multimek added 5 μL of protease to all wells on the compound plate and 5 μL buffer to the negative control column.
The ORCA put the plate in shaker where it was lightly agitated for 30 minutes at room temperature.
The ORCA put the plate on the Multimek. 15 μL of substrate was added to all wells.
The ORCA put the plate in the shaker and agitated for 30 minutes at room temperature.
The plate was read on a photomultiplier (PMT) based fluorescence plate reader, one well at a time (approximately 0.1 second/read).
CALIPER PLATFORM
The flow-based system developed by Caliper has the distinct advantage of integrating many of the discrete parts and steps of a conventional assay. After a compound is sipped into the capillary, reagent introduction, mixing, incubation and detection all take place on-chip. Volumes are small enough that diffusion does the necessary mixing within the timeframe of the assay. Liquid handling is a function of the fixed geometry of the chip, so sample-to-sample variability is greatly reduced. These advantages come with particular requirements; reagent buffer systems and signal detection systems need special attention.
CALIPER ASSAY
In the LabChip system, enzyme and substrate mixed continuously with the capillary stream when one psi vacuum was applied to the waste well. All compound plates were prepared in assay buffer with a final concentration of 5% DMSO in order to match on-chip solutions. Positive control was the flowing enzyme and substrate mixed with buffer-only wells on the plate. Since the flow could not be stopped within an arm of the chip, negative control was defined as the effect of a concentrated amount of known inhibitor. Cy5® dye was sipped after each row of the plate for fiducial marks in the continuous fluorescence data output. Liquid handling, mixing and detection were all done within the device. The following steps detail the basic protocol for the protease assay:
Chip prepared for assay by placing 40 μL of enzyme and substrate into appropriate wells.
Decks of 96 well compound plates (80 wells with compound, 100 μL/well) loaded into Twister.
A compound plate was picked up by the Twister robot and put on the Caliper robot.
The robot presented the various fluid wells to the capillary for a predetermined length of time.
The system detector output a time series of fluorescence.
The software automatically controlled the plate handling, plate positioning, sample aspiration, detection, data display and storage. The substrate product excitation (470 nm) was from a filtered Hg lamp with emission measured at 525 nm. The red dye was excited at 635 nm with a laser diode and detected with a 670–730 nm filtered photodiode. The chip sits in the bottom of a black box, with the capillary extended downwards. The robot alternates between feeding the compound plate and buffer to the sipper capillary to keep compounds separate in the channel. Dye was presented to the sipper capillary at the end of each plate row to frame the wells in time. The following series of steps is required to complete a 96 well plate:
buffer flush (to flush and equilibrate the channels)
dye sip
buffer (to separate compound plugs from each other in the downstream detection)
compound
buffer
compound
repeat
dye at end of each row
after 96 compounds and nine dye sips, a control inhibitor is sipped (negative control)
flush chip with buffer while the robot exchanges compound plates.
Time-series fluorescence readouts were captured as text files for each plate. Post-run analysis identified the time frames for each well and reported percent inhibition relative to the negative control inhibitor. A hit was indicated by a reduced fluorescence count from a fitted baseline.
CALIPER ASSAY DEVELOPMENT
This miniaturized assay was developed using the Caliper system with serial dilution plates to explore parameter space. The format of the system allows for rapid assay optimization. The functional windows for [E], [S] and dwell times were established with a series of semi-automated experiments. The chip was loaded with single-concentration reagents, and the microtitre plate contained a gradient of reagents to be measured. Signal levels and enzyme and substrate concentrations were selected this way. For example, Figure 3 shows graphs at one and two psi (approximately 1 and 2 mm/s flow rates, respectively). Each graph is the signal trace as the capillary goes through nine samples of a plate containing a dilution of substrate. The three curves represent repeats with no enzyme, 1.75 nM and 17.5 nM enzyme. A number of points are highlighted here. Increasing substrate increases the signal, but also increases the background. The lower pressure gives longer reaction times and greater turnover, but at the expense of throughput. Higher enzyme concentration gives better signal, but at the cost of reduced efficacy of active compound and, in the case of this protease, autocleavage. Higher substrate concentrations will increase signal, but also at the risk of missing active compounds.
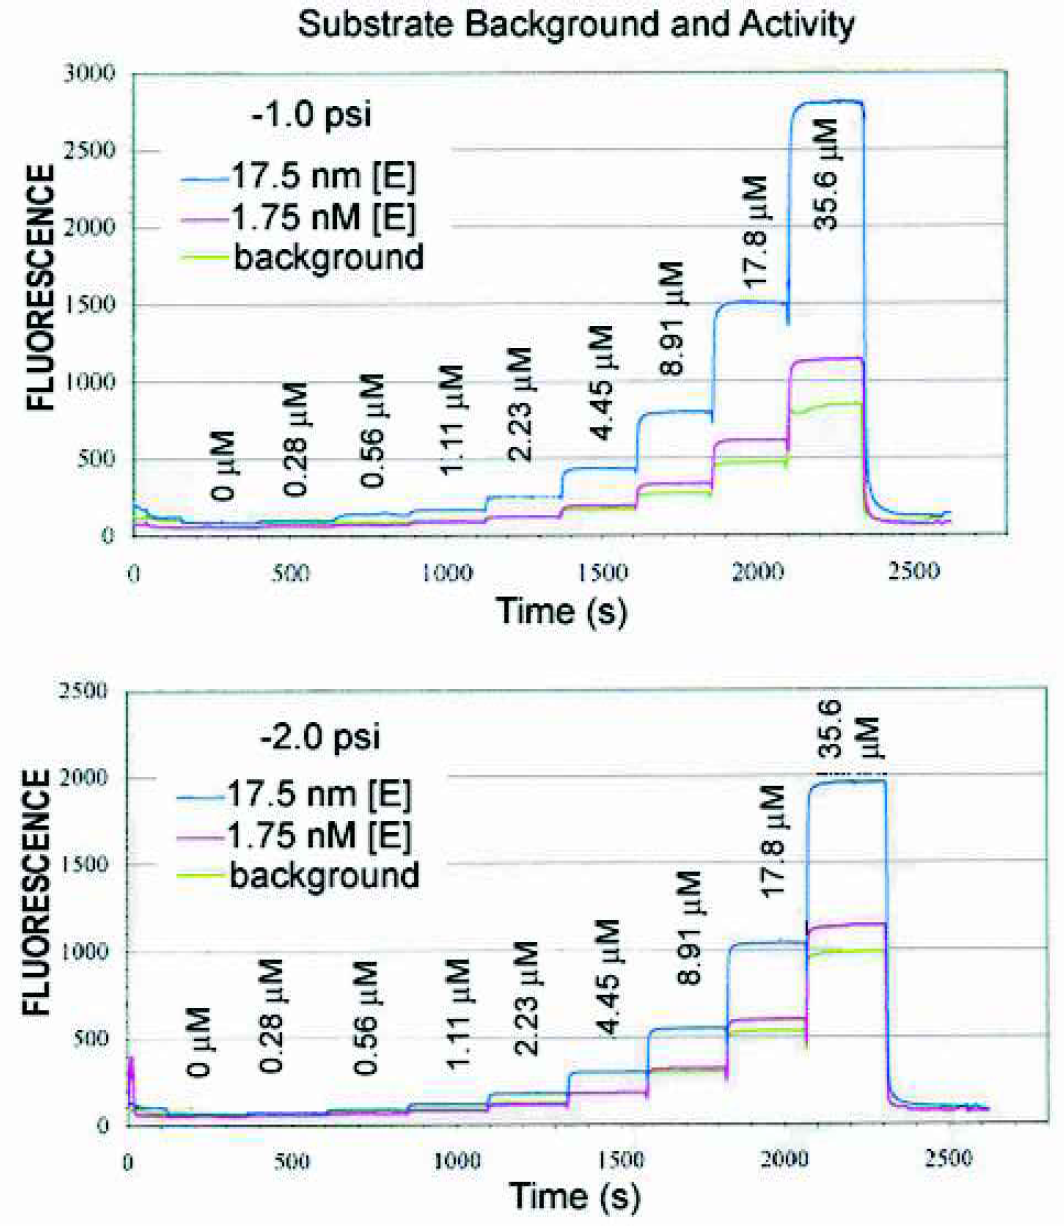
Signal for increasing substrate concentration using two enzyme concentrations and a substrate baseline.
The development of the assay for the LabChip device started with establishing the enzyme concentration necessary to get the required turnover from kinetic studies. Minimum substrate concentration was chosen in order to obtain the highest sensitivity to test compounds. Pressure was chosen empirically to balance throughput with enzyme turnover. The compound sip time was minimized to two seconds. Less time would not produce the required concentration at the assay point, and more time would decrease throughput. Buffer time was also minimized to be as small as possible while keeping the compound plugs separate along the channel. Control inhibitor was selected from the literature, and run at approximately four times the concentration necessary to produce 100% inhibition.
RESULTS AND DISCUSSION
CALIPER ASSAY
The fundamental difference between the Caliper system and conventional plate handling necessitates specific changes to the assay parameters and protocols. Surface adhesion in a flow system with a large surface-to-volume ratio must be considered, limited incubation times come from the continuous flow design, and the issue of diffusion needs to be addressed due to the lack of barriers between test compounds. Channel adhesion was reduced by the addition of surfactants to the buffer mixture. The limited incubation time required a concentration increase from the conventional concentration of 28X enzyme and 3X substrate solutions. In the current system, the on-chip path is fixed and pressure alone determines the time from mixing to detection; 40 seconds in this assay. Decreased pressure gives longer incubation times, but also lowers throughput by necessitating larger spaces between compounds to accommodate diffusion spread.
Because the on-chip flow of [E] and [S] was constant, the conventional negative control of no enzyme was not possible. The negative control for an inhibition assay in the flow chip was defined as the signal from a high concentration of inhibitor in the last well of the sample plate. Introduction of this inhibitor onto the chip required a thorough flush (250 s) before the next sample was sipped. Thus, only one negative control point was collected per plate. This occurred while the plate handling steps were being done. Positive control was defined by the presence of only a buffer in the last well of each row as well as enzyme and substrate from the chip. Data were acquired at 5 Hz.
The raw data were time series of fluorescence. Activity of the inhibiting sample compound on the enzyme-substrate reaction caused a decrease in signal. Figure 4 shows a typical trace of the raw data. A 90 second delay before the start of sampling and a 250 second delay after the last well are included in the trace. Note that after the 90-second delay, there is also a lag time to allow the sample to reach the detection point. This is independent of sample-to-sample throughput; plugs can be stacked within the channel. Peak height was an accurate metric to reduce these data to one point per well as required by HTS. Throughput was maximized by setting two-second sampling and eight-second buffer times. Compound plugs can diffuse as long as the signal is within the correct window. Each well is represented by a ten second cycle. Dye peaks were detected at a different wavelength using the same time axis and served to frame the wells for analysis.
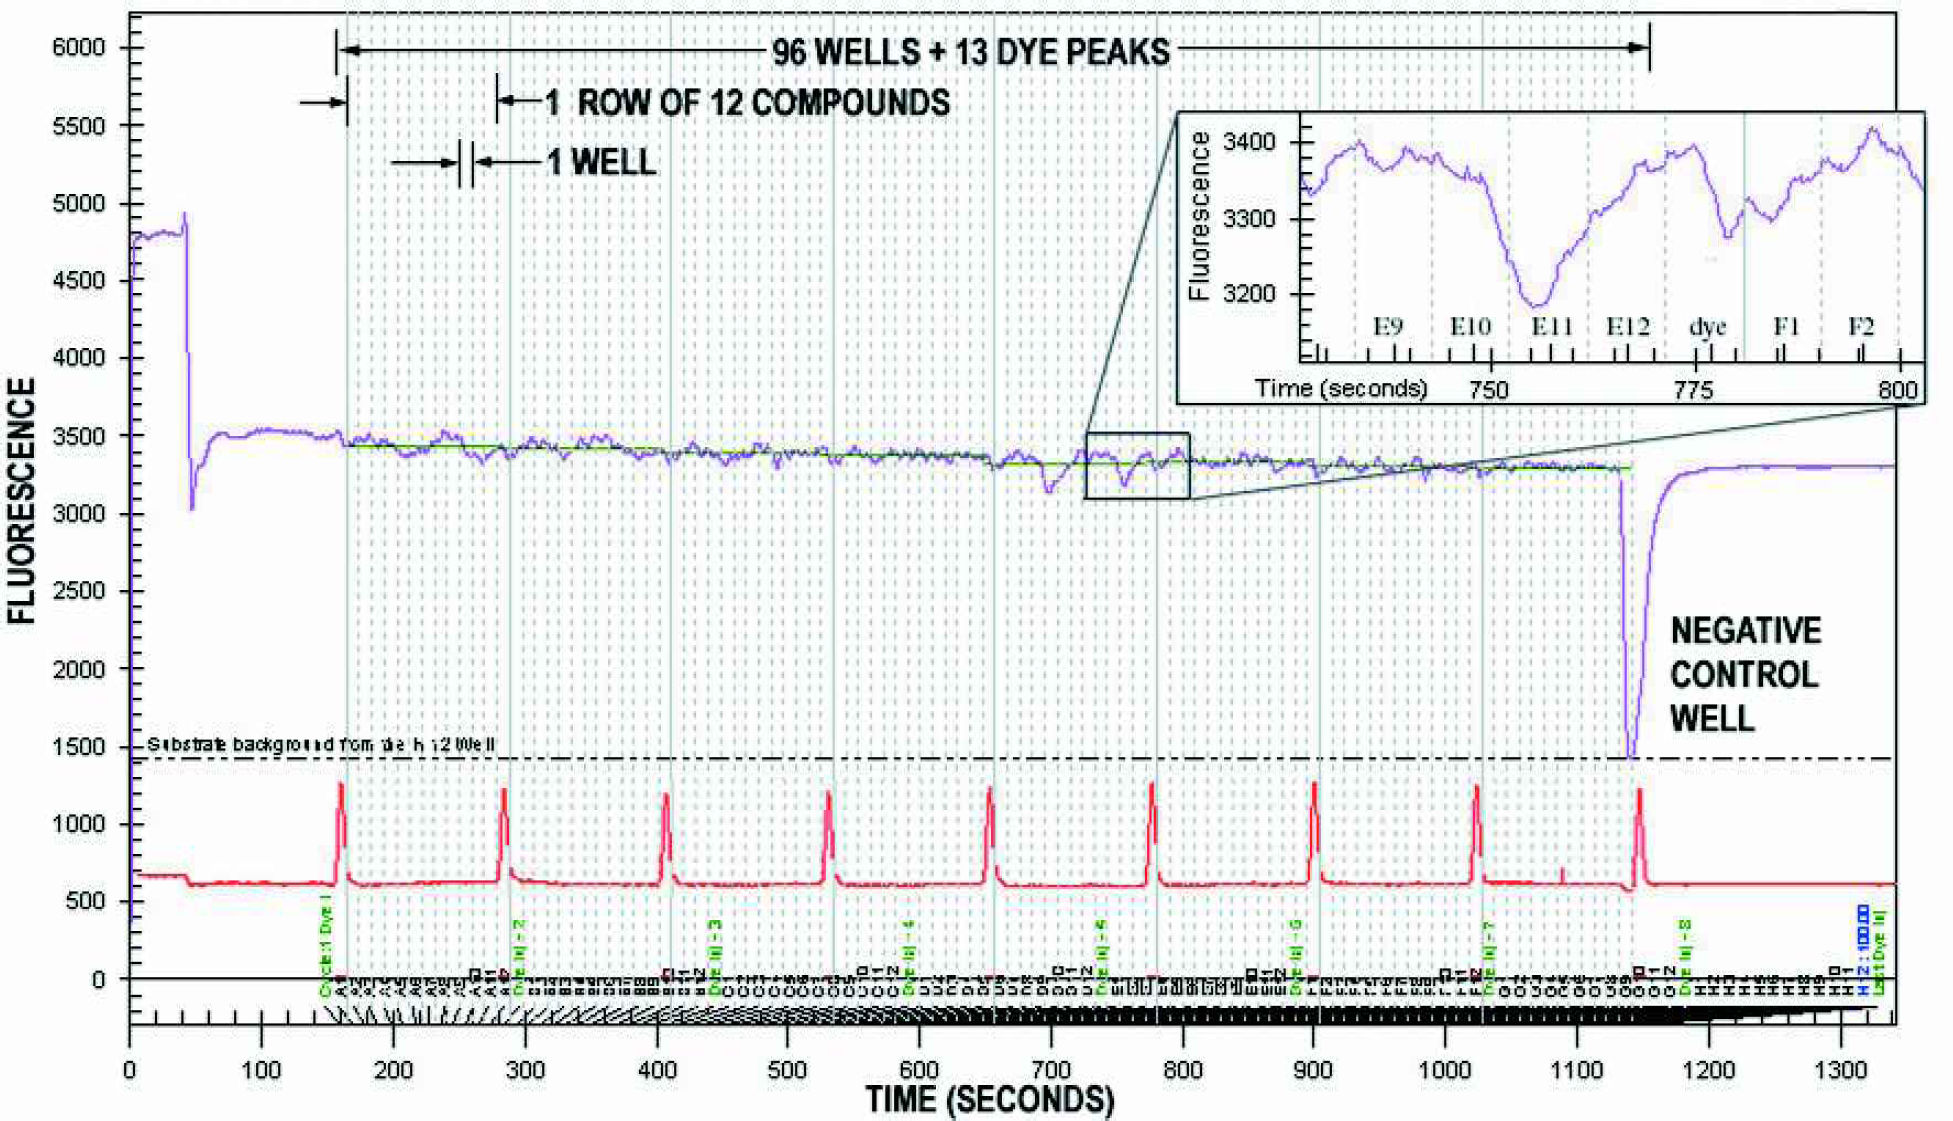
Data output by the Caliper® 110 system for an entire 96-well plate. The 1350 s (22 min) trace was a time series of fluorescence. Dye peaks frame the signal trace to distinguish compounds. For an inhibition assay, the signal is the maximum from enzyme activity on the substrate, and any inhibition shows up as a decrease in signal, resulting in a negative peak (e.g., the large inhibition in well H12).
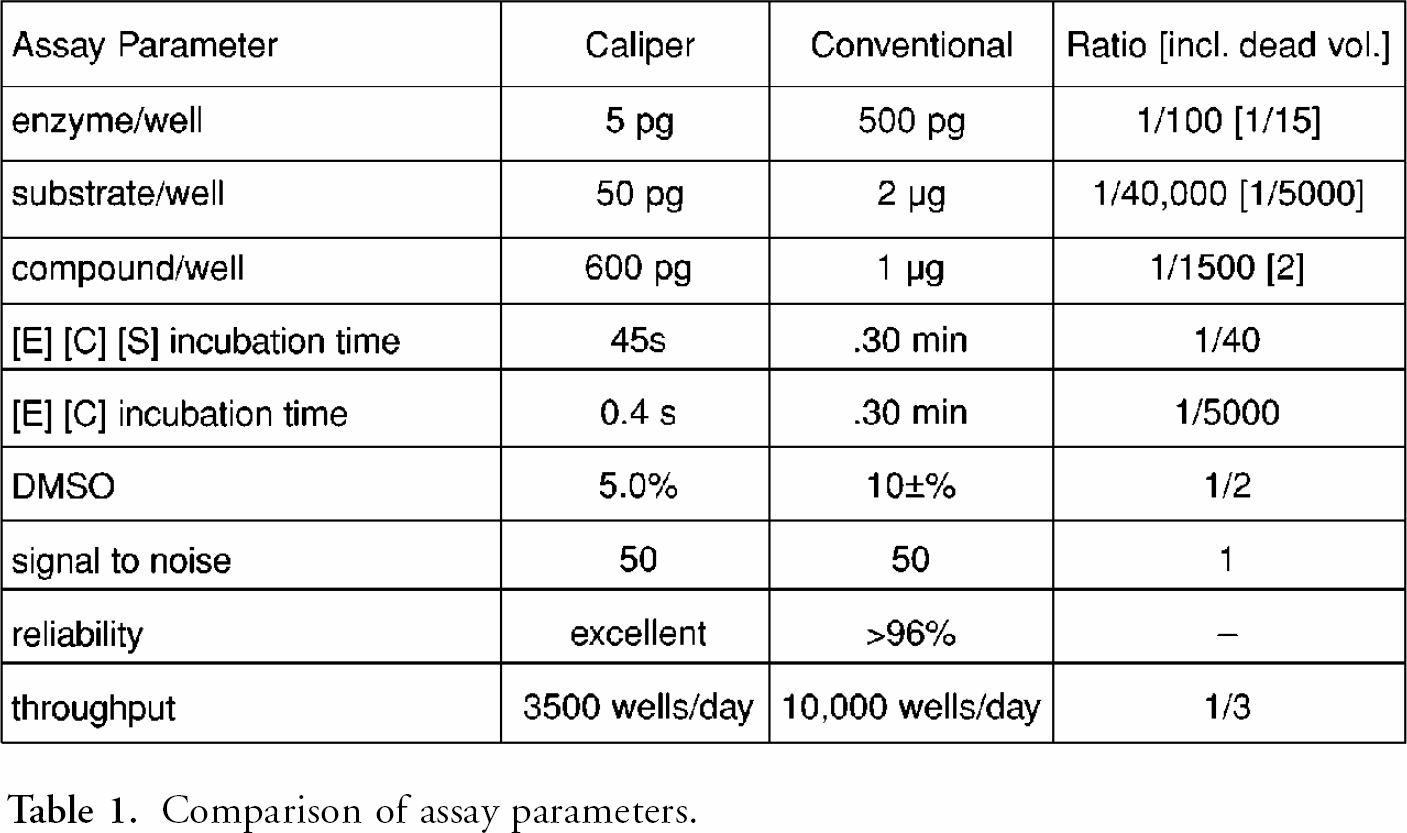
table 1 compares critical parameters of the Caliper assay with the conventional 96 well-based assays. The differences between the two assays show up not only in the ratios of the parameters, but also in the difference between each ratio. The two assays are distinctly different.
REAGENTS
The primary benefit of miniaturization of an assay is the reduction of reagent use. As table 1 shows, the amounts of enzyme, substrate and compound used for detection were many orders of magnitude smaller for the flow system. However, the unused volumes required for delivery of reagents to the channels and the increased concentrations needed to react within the limited incubation times brought the material use much closer to conventional. The flow-based assay was a serial process. To increase throughput, the speed was necessarily increased, resulting in a short incubation time. Diffusion also required flow speeds to be high, thus decreasing the effective distance between plugs of compound with increased time.
Comparison of assay parameters.
The difference between plate and flow system was apparent in the need for more tightly controlled reagents. Filtration to 0.2 mm of all reagents was necessary, and assay stability required that all reagents have the same component concentrations. Reagent mismatches caused instabilities in the baseline of the signal which decreased the signal-to-noise ratio. The assay parameters were changed to match the signal to noise detection limits in this side-by-side comparison. The complex interaction of flow rates, reagent adsorption and desorption in the channels, and pressure changes as the tip moves in and out of the compound plate caused changes to the detected signal. The systematic fluctuations might possibly be modeled and removed, but they have been treated as noise in this study.
RELIABILITY AND THROUGHPUT
Signal reproducibility on the same chip is very high. The signal trace for 12 columns of eight overlaid wells is shown in Figure 5. For a given buffer system, the perturbation in the baseline is highly repeatable. In this experiment, the well-to-well cycle time was extended to 45 seconds to assess the unconvoluted signal trace from an individual event. The initial peaks and troughs in the traces are a function of the change in state of the chip system. Pressure differences as the capillary travels between wells are negligible. Viscosity differences cause changes to the mixing ratios in the chip, but are controllable simply with matched buffers. Miscibility and surface energy effects are also minimized by carefully matched buffers. However, differences in solution properties, especially DMSO concentration, even as low as +/−0.5%, cause shifts in reagent adhesion within the channel and result in this characteristic signal.
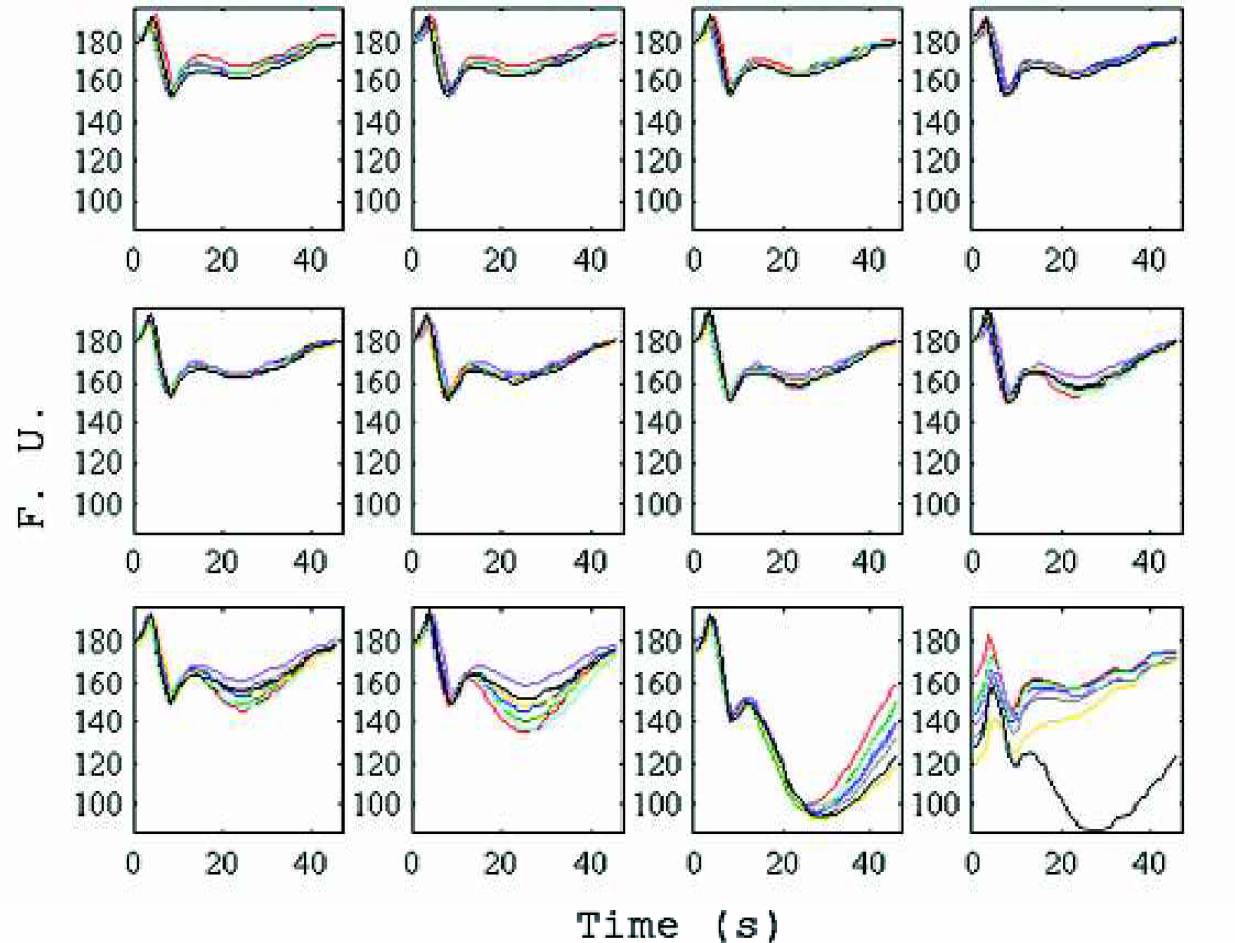
Overlay of eight sample well traces for 12 columns
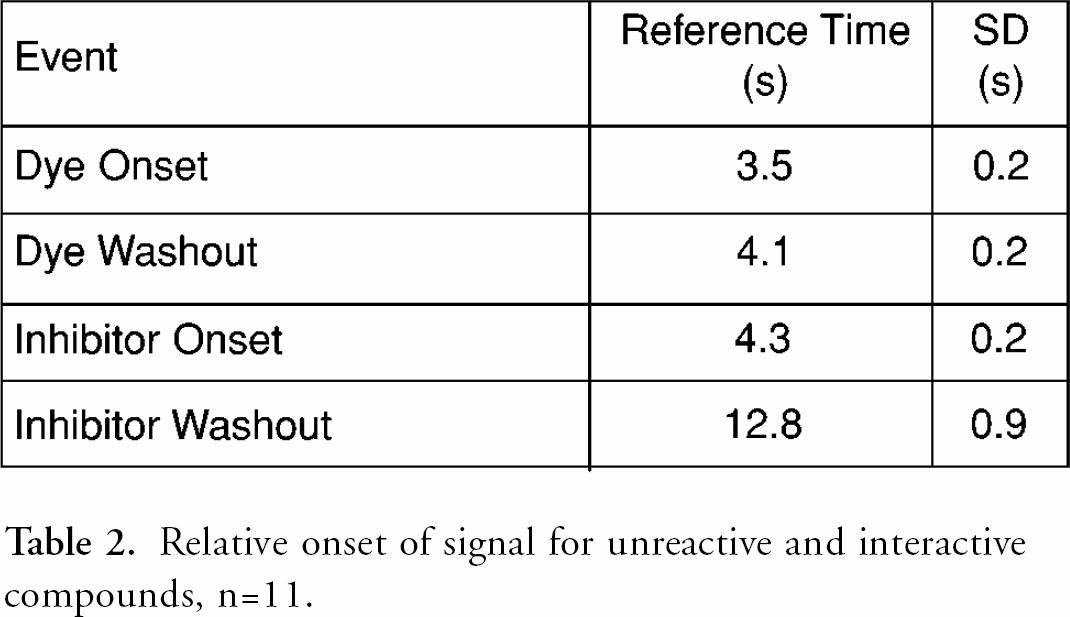
One of the key aspects of the flow system defining throughput is its serial nature. A finite plug of compound is injected into the flowing stream of enzyme and substrate. This plug must travel approximately 20 mm before meeting enzyme and substrate streams, then another 30 mm to the detection position. The compound disperses by flow and diffusion, and therefore even the sharpest injection will spread. Buffer plugs are required to keep the compound plugs separate, and this limits the test-compound sampling rate. The behavior of the compound can be examined through the onset and washout of the unreactive dye and the control full inhibitor. table 2 shows estimated relative times for onset and washout of the signal. Inhibitor is highly concentrated, and in this assay it is also sticky, so it takes a significant amount of time to thoroughly wash the inhibitor out. An exact time point for complete signal stabilization is not possible, so the reported times are the extrapolation of the maximum slope of the curve from one signal state to the other. See Figure 6 for a typical slope calculation. The functional times required for an assay are at least twice as long.
Relative onset of signal for unreactive and interactive compounds, n = 11.
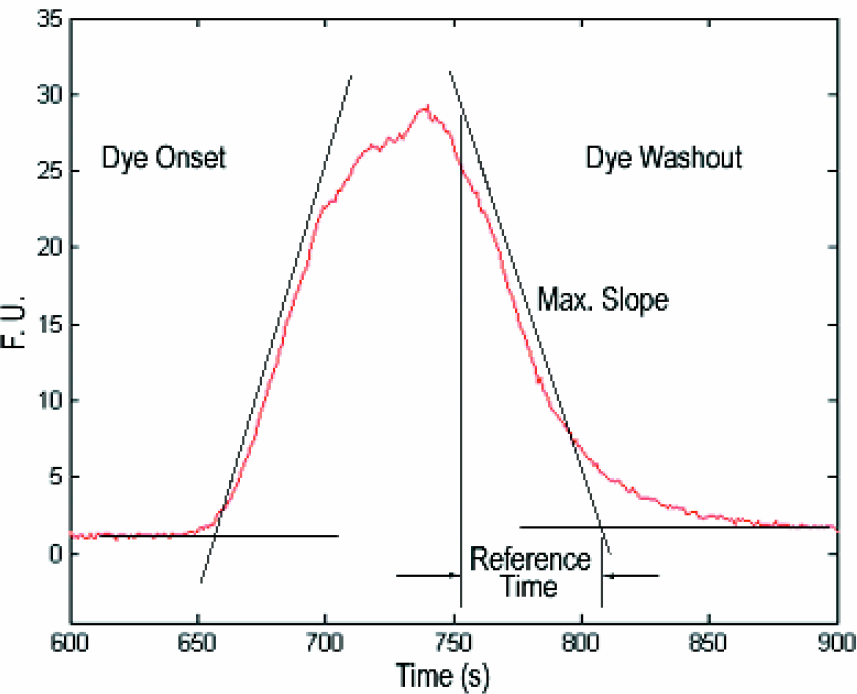
Schematic of relative onset ans washout time calculation.
The difference in throughput may be misleading. The comparison is between a flow system in its infancy and a well-established, well-supported method. The serial throughput is approximately one-third of the parallelized conventional assay. Figure 7 shows the time to run 15 plates (in 96 well format) on the conventional robotic platform and the Caliper microfluidics platform. Setup times are similar. While the conventional assay has higher throughput compared to the chip-based assay for the protease in this study, recent changes have made significant advances in throughput as shown in the figure.
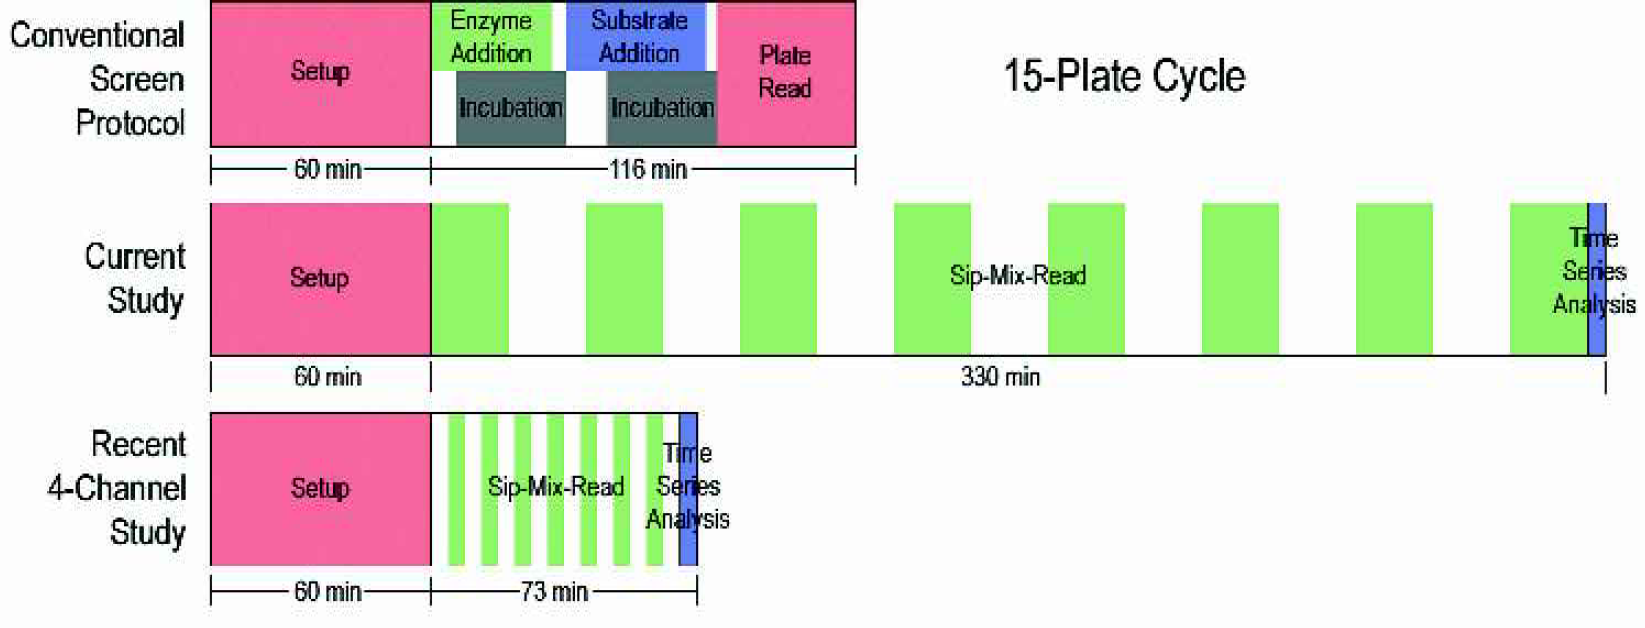
Comparison of conventional and LabChip process flows.
The chip's single sipper and channels have been expanded to four, with additional ones planned for future designs, making the throughput increase almost equal. Both plate-based and LabChip systems will benefit from steps to 384 and 1536 well plates. The chip system already has generic sample introduction, sample volume and detection configurations.
The spreading of the plug of compound is the essential limit to throughput, but may be advantageous. A single sample disperses as it travels along the capillary and channels, creating a dilution profile before introduction to the enzyme and substrate. 14,15,16 If the forward diffusion were to be modeled well enough, this would enable an IC50 estimate to be done from a single sample injection. Many possibilities for the LabChip technology are still unexplored.
CONCLUSIONS
The throughput of this iteration of the LabChip technology is fundamentally limited by the serialization of flow through the chip. Throughput could be improved by both multiple sipping capillaries (ongoing) and by the parallelization of on chip channels that, coupled with the ability to select single compounds on a plate, would allow for hit validation and on-the-fly IC50s during a primary screen. The ability to get high content screening out of the present system is also a real possibility because of the high repeatability of on-chip liquid handling. The elimination of systematic noise through post processing, the estimation of kinetics by measurement of slope changes over the finite plug length, and the side-by-side comparison with conventional data may enable a leap to better screening though information extraction instead of incremental increases in throughput. Since this study, fluorogenic assay throughput has increased to approximately five seconds per well. Further developments in this technology will not only increase throughput, but also improve many aspects of drug discovery.
A clear challenge facing microfluidic systems is interfacing with other processes in the drug discovery pipeline. Changes in the HTS process must be accommodated while not giving up any robustness and reliability. These are hardly the characteristics one expects of a cutting-edge, rapidly developing technology. Applying microfluidics to High Throughput Screening is terribly demanding, but is a potentially enablingtechnology.
Caliper and LabChip are registered trademarks of Caliper Technologies Corp.