
Abstract
Abstract
Purpose
Biomechanic factors play a role in the pathogenesis of knee osteoarthritis. The aim of the study was to find out whether there is a relation between femoral, acetabular anteversions, anterior, posterior acetabular coverages and primary osteoarthritis of the knee.
Methods
Thirty patients with primary osteoarthritis of the knee and 29 control subjects were enrolled into the study. Femoral anteversion, acetabular anteversion, McKibbin's instability index, anterior acetabular sector and posterior acetabular sector angles were measured using tomographic scanograms.
Results
There was no difference between groups for each parameter (P > 0.05).
Conclusion
This study did not show any relationship between the axial plane changes in the hip joint and primary knee osteoarthritis.
Keywords
Introduction
Knee osteoarthritis is the most common joint disorder and is characterised by abnormal articular cartilage and subchondral bone of the tibiofemoral joint [1]. There is growing evidence that several biomechanical factors contribute toward the pathogenesis of knee osteoarthritis [2]. There are several studies pointing out the relation between the lower limb torsion, axial plane coverage of the hip and osteoarthritis of the hip [3–9]. We found only one study reporting the relation between the femoral anteversion and osteoarthritis of the knee [10]. In addition to that, there is a high probability of coincidental diagnosis of the primary osteoarthritis of the hip and the knee at the same extremity of the patient both at clinical and/or radiographic evaluations. Depending on these, we hypothesised that there is a deviation of femoral, acetabular anteversions or loss of compensation of these to each other and a deficiency of anterior or posterior acetabular coverage of the femoral head in patients with primary osteoarthritis of the knee when compared to normal subjects.
Materials and methods
We examined the patients who were admitted with knee pain at rest and with passive, active knee range of motion, joint line tenderness by computed tomography (CT) to be included in the patient groups (Group P). The study was designed prospectively. Patients with primary knee osteoarthritis were included in the study. Patients who had suspicion of a previous episode of infection, rheumatoid or other inflammatory diseases, trauma (femoral condyle, tibia plateau, patella fractures) in their medical history, physical or X-ray examinations were excluded. Our important inclusion criteria were medial compartment joint space narrowing in their single-leg-stance antero-posterior radiograph. Patients having symptoms and signs for other joints were also excluded from the study.
The control group (Group C) was set up by the CT analysis of hip joints that was already performed in the patients who were referred to our radiology department because of abdomino-pelvic diseases and who had healthy hip and knee joints in their scanograms without any symptoms attributable to any hip or knee disease.
Our local ethics committee approved this study. Written and informed consent were obtained from both the patients and the control subjects.
According to the above described criteria, 30 patients (Group P) with primary osteoarthritis of the hip and 29 control cases (Group C) were included in the study. The demographics of both groups are described in Table 1.
Demographics of the patient and control groups
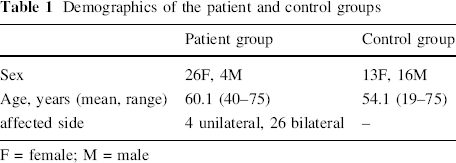
F = female; M = male
The CT examinations were performed in the supine position with the femurs in neutral rotation and the hips and knees in extension. Scanograms were obtained between the anterior superior iliac spine and the level distal to the knee joint in the frontal plane. Guided by the target scan, continuous 5-mm axial slices through both hip joints, femoral necks and two 10-mm sections through the femoral condyles with parameters of 120 kV, 90 mA and 2 s exposure were obtained using a Hitachi Radix Turbo (Tokyo, Japan) high-resolution scanner with a 512 matrix.
The femoral anteversion (FeAv), acetabular anteversion (AA), McKibbin instability index (Mi), anterior acetabular sector angle (AASA) and posterior acetabular sector angle (PASA) were measured. The measurements were obtained from enlarged film copies by two independent observers blinded to the scope of the study. Interobserver concordance for AA, FeAv, AASA and PASA were tested in both hips separately by calculating the intraclass correlation coefficients (ICCs).
Femoral anteversion was calculated as the angle between the projected head–neck line and the line that intersects the anterior and posterior condylar tangents. Tomogram section with the largest diameter of head was projected to the other section with the largest, best vision of the femur neck. The centres of the femur head and femur neck were identified. The projected head–neck line is made by connecting these two centres (Fig. 1).
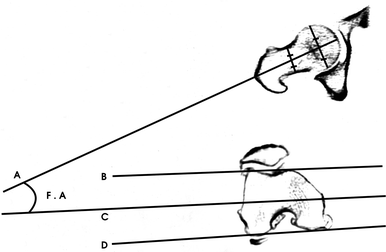
Femoral anteversion measurement technique. Femoral anteversion (F.A) is calculated as the angle between the projected head–neck line (A) and the line (C) that intersects the anterior (B) and posterior (D) condylar tangents
While measuring acetabular anteversion, obliquity caused by improper positioning of the patient in the CT scanner was controlled by drawing a baseline intersecting the most posterior edges of the iliums. Acetabular anteversion describes the angulation of a line through the anterior lip of the acetabulum and the lip of the posterior acetabulum with the sagittal plane [11] (Fig. 2).
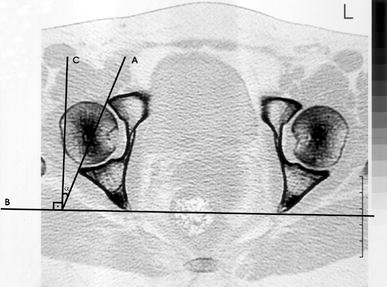
Acetabular anteversion measurement technique in the axial plane computed tomographic (CT) section. Line B = baseline intersecting the most posterior edges of the iliums. Line A = line intersecting the anterior and posterior lips of the acetabulum. Line C = line perpendicular to line B. α (acetabular anteversion angle) = angle between the lines A and C
AASA and PASA were measured in the equatorial plane in the axial plane sections, like Anda et al. used [9, 12]. The equatorial plane was defined as the plane passing axially through the centre of the femoral heads. We used concentric circles for detecting the centre of the femoral heads. AASA is defined as the angle between the anterior acetabular margin, the centre of the femoral head and the intercapital centre line. PASA was described as the angle between the posterior acetabular margin, the centre of the femoral head and the intercapital centre line (Fig. 3).
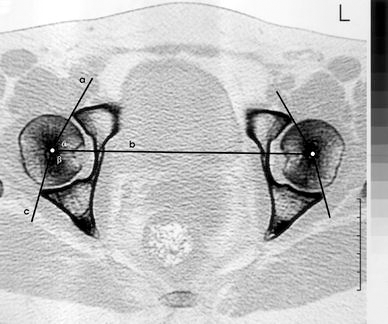
Acetabular sector angles measurement technique in the axial plane CT section. Line b = the equatorial plane is defined as the plane passing axially through the centres of the femoral heads. Line a = line connecting the centre of the femoral head and anterior lip of the acetabulum. Line c = line connecting the centre of the femoral head and posterior lip of the acetabulum. α (AASA) = angle between the lines a and b. β (PASA) = angle between the lines b and c
The McKibbin instability index (Mi) is calculated by summation of the angles of femoral anteversion and acetabular anteversion. Values lower than 20° are regarded as low instability indexes, while values above 50° are regarded as high instability indexes [13]. We compared the frequencies of low indexes and high indexes separately between two study groups.
Statistics
We used SPSS for Windows version 10.1 (SPSS Inc., Chicago, Illinois) to analyse the data. Pearson's correlation analysis test was used to explore the influence of age on groups. The Mann–Whitney test was used to investigate the sex difference between groups. The Kruskal–Wallis test was used to compare the values of osteoarthritic knees and the knees of control subjects separately. Power analysis was evaluated by the one-sample t-test.
Results
There was no difference between groups when considering age and sex. There was no effect of age and sex on the FeAv, AA, AASA and PASA values (P > 0.05).
There was no significant difference between the control group and the patient group on the FeAv, AA, AASA, PASA and Mi (Table 2, P > 0.05).
Measured values in group P (patient group) and group C (control group)
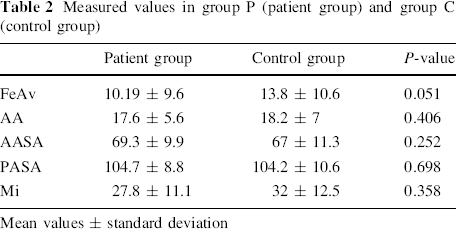
Mean values ± standard deviation
After grouping the osteoarthritic hips and control subjects according to Mi values, with values between 20 and 50 as the first group and lower than 20 or above 50 as the second group, the percentages of having Mi values lower than 20 or higher than 50 were not different between the patient group and the control group (P > 0.05).
There was interobserver concordance among the independent observers for AA, FeAv, AASA and PASA (P < 0.001). The ICC analysis results are summarised in Table 3.
Intraclass correlation coefficient (ICC) analysis results
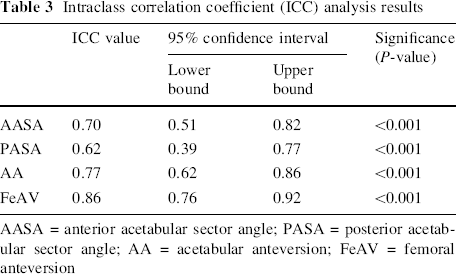
AASA = anterior acetabular sector angle; PASA = posterior acetabular sector angle; AA = acetabular anteversion; FeAV = femoral anteversion
The comparison of bilateral cases with unilateral cases could not be performed due to the low number of unilaterally affected patients.
The power of the study was 80% (α = 0.05, β = 0.20).
Discussion
Osteoarthritis is a common cause of disability in people over 65 years of age. However its aetiology and pathogenesis remain largely unknown. There is increasing interest in the contribution of biomechanical variables to the pathogenesis and management of osteoarthritis in addition to biologic factors. These include mainly the lower limb alignment and knee adduction moment forces increasing the load across the articular cartilage and/or changing the material properties [14–19].
There are several reports pointing out the aetio-pathogenetic relation between the osteoarthritis of the hip, knee and lower extremity torsion [3–8, 10]. In addition, after working for several years at a musculoskeletal radiology or orthopaedic outpatient clinic, it is not uncommon to observe hip and knee osteoarthritis simultaneously at the same extremity of the patient.
Reikerås et al. detected that increased femoral anteversion is not compensated by a decrease of acetabular anteversion in patients with primary hip osteoarthritis and concluded that this poor relation leads to poor adaptation of the femoral head to the acetabulum and later osteoarthritis development [4].
The McKibbin instability index is dependent on the theory that acetabular anteversion and femoral anteversion may be additive or may offset each other. Tönnis and Heinecke proposed that a high or low instability index is a predisposing factor for hip osteoarthritis [13, 20].
Anda et al. [9] found anterior acetabular coverage deficiency in adult patients with frontal plane dysplasia and concluded that vector force analysis of the dysplastic hips and CT studies in the patients with primary hip osteoarthritis indicate the importance of anterior acetabular coverage. Depending on these, we sought to find out whether there is a causal relation between hip coverage, anteversion or failure of the compensation of acetabular and femoral anteversions to each other and to knee osteoarthritis.
We found in the literature only one study pointing out the correlation of the femoral anteversion and knee osteoarthritis [10]. In another study, Goutallier et al. reported the loss of valgus angulation in patients with decreased femoral anteversion after tibial valgus osteotomy for medial compartment knee osteoarthritis and the increase of valgus angulation with increased femoral anteversion, both of which led to worse functional outcomes when compared to patients with stable coronal alignment [21].
Femoral anteversion develops during the second half of pregnancy and reaches 35° at birth. The standard deviation of femoral anteversion is very large. It decreases slowly over time and reaches a value of 15–20° at adulthood. Afterwards, it is not expected to change [4, 20, 22–24].
Acetabular anteversion increases by a few degrees during growth and reaches adult values of 15–20°. Likewise, femoral anteversion is not expected to change during a person's lifetime [4, 13, 20]. Eckhoff et al. [10] found a correlation between decreased femoral anteversion and osteoarthritis of the knee, with a greater decrease as arthritic changes increase. We found in our study a trend of decreasing femoral anteversion in the patient group; however, it did not reach statistical significance (P = 0.051).
One of the limitations of this study is the possible measurement mistakes, especially during the measurement of femoral anteversion and defining the anterior and posterior condylar tangents due to osteophytes. However, we do not think that this affected the results because there was almost perfect interobserver concordance [25].
In conclusion, this study did not show a correlation between the hip torsion, especially for the acetabular part, axial plane coverage of the hip and knee osteoarthritis.