
Abstract
Gold nanorod-based affinity sensors were developed utilizing concanavalin-A/dextran/glucose chemistry to detect glucose. The gold nanorods, synthesized using the seed-mediated method, were first coated with dextran sulfate. The dextran sulfate coating changed the local refractive index, which was observed as a red shift in the longitudinal plasmon band. After the addition of 8 μM concanavalin-A, gold nanorod aggregates were formed as shown by TEM analysis. The corresponding UV-Vis spectrum peak wavelength showed a red shift from 701 nm of dextran sulfate coated gold nanorods to 718 nm of concanavalin-A promoted gold nanorod aggregates. The gold nanorod aggregates were dissociated when 12 mM glucose was introduced, as illustrated by TEM images. The longitudinal plasmon resonance of the UV-Vis spectrum also showed a blue shift from 718 nm of dextran sulfate-coated gold nanorods associated by concanavalin-A to 714 nm of dissociated dextran sulfate-coated gold nanorods. The degree of the spectrum peak wavelength shift of the dextran sulfate-coated gold nanorods associated by concanavalin-A can be modulated using glucose ranging from 1 to 30 mM.
1. Introduction
Noble nanoparticles have diverse uses in a plethora of applications [1–4]. As such, it is no wonder that gold nanoparticles are utilized in a myriad of applications related to biotechnology and nanomedicine [5,6]. The unique interaction between light and gold nanoparticles makes them attractive materials for sensing applications. The results of these interactions, including surface plasmon resonance, absorption, scattering or total extinction, are dependent on the size, shape, structure, dielectric properties and surrounding medium of the metal [7,8]. These properties make gold nanorods (GNRs) ideal for many sensing applications. The anisotropic feature of GNRs gives them a transverse band and a longitudinal band from incident light. The longitudinal band is found to be sensitive to the aspect ratio of the GNR and refractive index of the surrounding medium [9]. In case of an ensemble of GNRs, the longitudinal plasmon resonance reveals a red shift based on the distance between the GNRs and the shape and size of the ensemble [10]. Spherical gold nanoparticles are very sensitive to local refractive index change. This change is noted in terms of absorbance. Thus, the presence of biomolecules, chemicals, cells, viruses or bacteria can be easily and effectively detected by observing the changing of UV-Vis spectra [11–15]. However, gold nanorods are sensitive not only to the refractive index change but also shape and size. When in an ensemble, gold nanorods show the plasmon coupling effect [9,10]. If the gold nanorods form a chain-like structure, a red shift in the longitudinal band is observed. The intensity of the effect is proportional to the number of nanorods in the ensemble.
Glucose sensing has been receiving a lot of attention for almost four decades now. The first glucose sensor ever developed was an affinity-based sensor, which carried out detection using optical methods [16,17]. Today, a wide range of new biosensors is capable of detecting glucose even down to a few nM concentrations [17]. This detection is carried out either with electrochemical methods or optical methods. One famous method uses Concanavalin-A (ConA) (a lectin) affinity towards mannose and glucose for detection. ConA is very stable chemically at body temperature. Gold nanoparticles have been successfully shown to detect glucose [18]. The ConA binds with gold nanoparticles which have been decorated with dextran leading to aggregate formation. Glucose, which has a higher affinity to ConA than dextran, breaks the aggregates of gold nanoparticles. This leads to a change in the local refractive index as well as absorbance. The change in absorbance is noted, which is then found to be proportional to the amount of glucose added.
Due to unique features of GNRs, it is reasoned that utilizing GNRs in place of gold nanoparticles would provide an alternative approach to glucose detection. As illustrated in Figure 1, we modified the surface of GNRs with dextran sulfate. The ConA is then introduced to the system which red shifts the longitudinal plasmon resonance due to the formation of GNR aggregates. Since glucose competitively binds ConA more than dextran sulfate does, the dissociation level of GNR aggregates can be tuned by the glucose concentration. Adding glucose to GNR aggregates can lead to a blue shift of the longitudinal plasmon band towards the GNR's original longitudinal plasmon resonance. Our results showed that dextran sulfate-coated GNR aggregates were formed by introducing 8 μM ConA, as illustrated by TEM images. In addition, the corresponding UV-Vis spectrum showed a red shift from 701 nm of dextran sulfate-coated GNRs to 718 nm of ConA-induced GNRs aggregates. According to TEM images, the ConA/GNR aggregates were reversibly disentangled in the presence of 12 mM glucose. Furthermore, the longitudinal plasmon resonance of UV-Vis spectrum revealed a blue shift from 718 nm of ConA trigged GNR aggregates to 714 nm of dissociated dextran sulfate-coated GNRs.

Schematic outlining the ConA-driven aggregation of dextran sulfate-coated GNRs and the dissociation of GNR aggregates in the presence of glucose
2. Materials and Methods
2.1 Synthesis of gold nanorods
GNRs were synthesized by using a modified version of the seed-mediated synthesis method reported by El-Sayed et al. [19]. Briefly, a seed solution was prepared by adding 120 μl of 0.01 M ice cold NaBH4 to a mixture of 1 ml of 0.5 mM HAuCl4 and 1 ml of 0.2 M CTAB. The solution turns from yellow to brownish yellow. The growth solution was prepared by adding 5 ml of 1 mM HAuCl4 to 5 ml of 0.2 M CTAB to which 250 μl of silver nitrate was then added. When 67 μl of 0.788 M ascorbic acid was added, the solution turned from yellow to colourless. 12 μl of the seed solution was then added to the growth solution and stirred for three hours. The solution was refrigerated overnight to remove excess CTAB and then washed with DI water three times. The GNRs thus prepared were centrifuged and resuspended in 1 mM NaCl solution. The plasmon resonance of synthesized gold nanorods was measured by UV-Vis spectroscopy.
2.2 Dextran sulfate coating
20 mg/ml of dextran sulfate was prepared in 1 mM of NaCl solution. 800 μl of this solution was added to 4 ml of GNR solution and agitated for three hours. The nanorods were then centrifuged and washed with DI water three times and re-suspended in 1 M NaCl solution. The charge and size were measured to ensure the coating process was complete.
2.3 Gold nanorod aggregation
To form gold nanorod aggregates, 500 μl dextran sulfate (DS) coated gold nanorods (DSGNRs) were added to an equal volume of 8 μM of ConA. UV-Vis spectrum was obtained followed by TEM analysis of the aggregates.
2.4 Glucose detection
The ConA-DSGNR aggregates were then mixed with 12 mM of glucose in 1:1 volume ratio and agitated by pipetting. The degree of glucose-triggered dissociation of DSGNR from aggregation caused by ConA was examined in terms of UV-VIS spectra and TEM images.
2.5 Characterization
To detect the formation of GNRs, DSGNRs, and ConA-DSGNRs, UV-Vis spectra were obtained by a microplate reader (take three plates, BioTek SynergyMx, Winooski, VT) with 5 μl of the sample volume. A Malvern Zetasizer Nano-ZS was used to measure the size and charge of the GNRs and their derivatives. The sample size used was 1.2 ml. The TEM images were recorded at 100 kV on a JEOL JEM-4000FX (Tokyo, Japan). The sample was prepared by dipping a Formvar copper grid (Ted Pella, Redding, CA) in the sample while it is in a sonication bath (VWR B5300A-DTH, Batavia, IL) on a low setting to prevent the samples from auto-aggregating.
3. Results and discussion
The UV-Vis spectrum and TEM image of the GNRs are shown in Figure 2A and Figure 3A, respectively. Since the presence of CTAB could affect the detection of glucose [20], negatively charged dextran sulfate was used to cover CTAB-stabilized GNRs using electrostatic force. DS effectively coated GNRs and thereby left no sites for glucose to directly interact with GNRs. In addition, DS bounded with ConA effectively. As shown in Figure 2A, a red shift in the spectrum is the result of the local refractive index change in the local environment. This was further confirmed by measuring the size of the GNRs. The charge was found to be negative due to the coated dextran sulfate. The size changed from 39±4 to 44±5 nm indicating the thin coating of DS on the surface of GNRs.
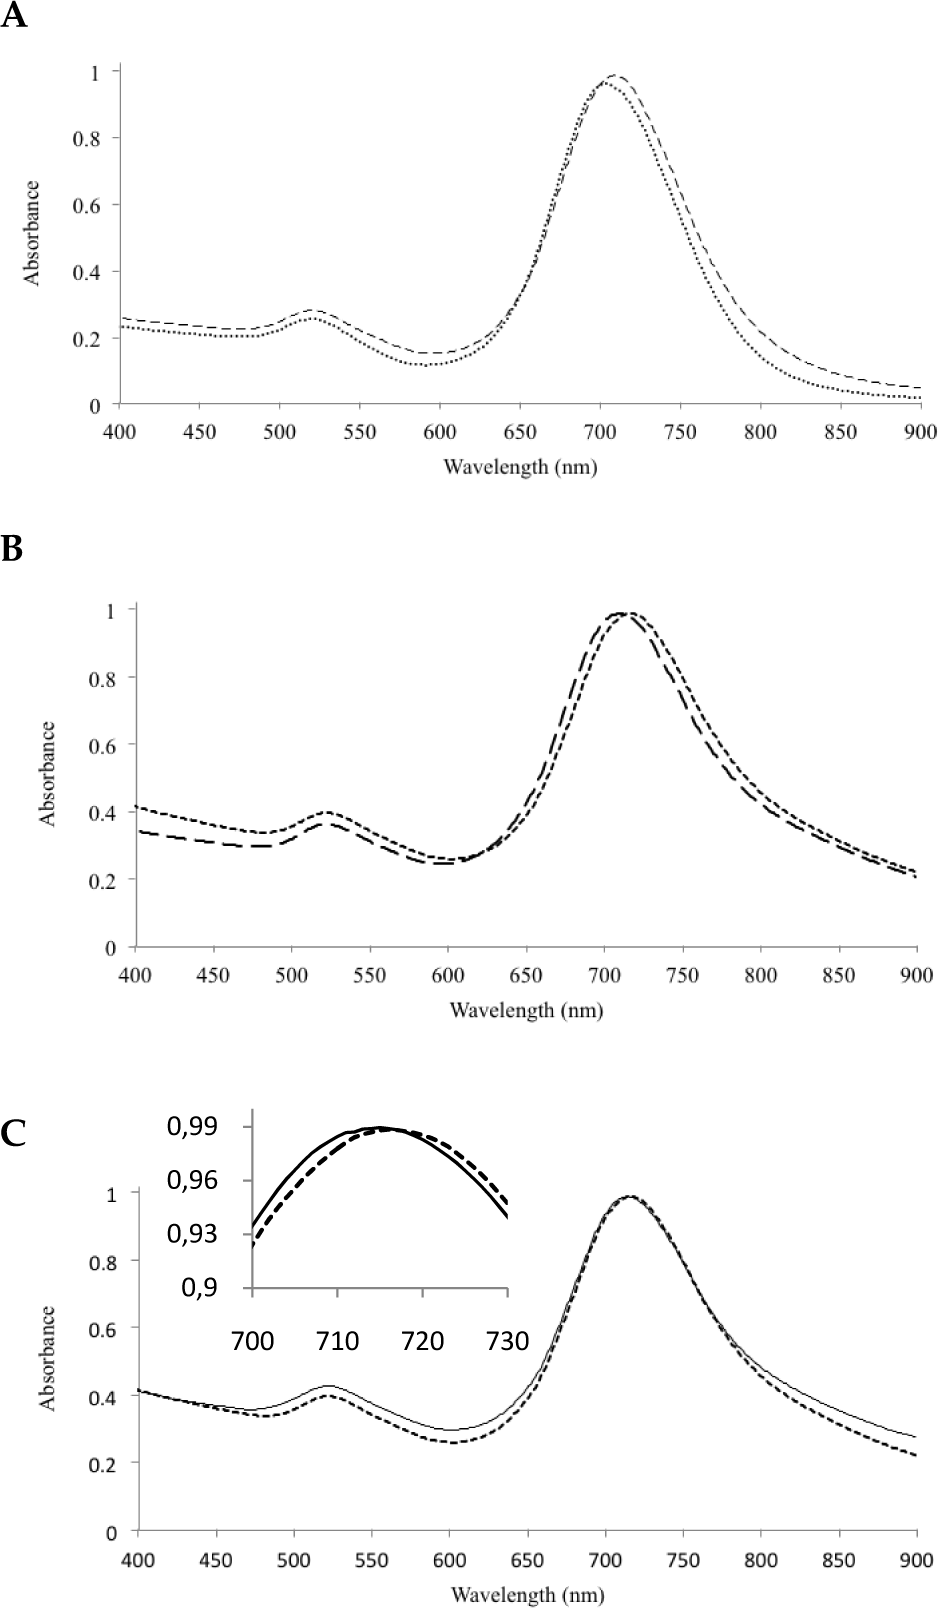
UV-Vis spectra of GNR and its derivates. (A) red shift of the UV-Vis spectrum of dextran sulfate coated gold nanorods (DSGNR, —) from gold nanorods (GNR, …) spectrum, (B) red shift of UV-Vis spectrum of ConA-DSGNR ensembles formed by the addition of 8 μM ConA to DSGNR (…) from the original UV-Vis spectrum of DSGNR (—), (C) blue shift of UV-Vis spectrum after the addition of 12 mM glucose (…) to 8 μM ConA-DSGNR ensembles (_____); the inset is a close-up view of UV-Vis spectra near the longitudinal plasmon resonance peaks.

TEM images of (A) GNR, (B) ConA-DSGNR ensembles at 8 μM ConA (note the two images were taken from different areas with different magnifications), and (C) effect of 12 mM glucose addition on ConA-DSGNR ensembles (images taken from different regions with its own magnification)
It has been reported that to effectively use the plasmon coupling effect the distance between two GNRs should be small [10]. This allows us to obtain the maximum red shift in the longitudinal band. It is also important to use small molecules as they can reduce entanglement and cross-linking [10,14,21]. Thus, for coating purposes, we used dextran sulfate with a molecular weight of ∼2.5 kDa. Coating was carried out in 1 mM NaCl solution. The UV-Vis spectrum is shown in Figure 2B. The observed shift is proportional to the ConA concentration. A small ConA concentration for this experiment was used (8 μM) for a lower concentration of glucose. The decisive factor in deciding the concentration was the amount of red shift obtained and the extent to which the glucose molecules interact with ConA due to accessibility.
One can observe from the UV-Vis spectrum that the shift in the longitudinal band is evidence of the ensemble formation proven by the TEM images. There is no blue shift in the transverse band and TEM imaging also shows the absence of a prominent side-by-side GNRs assembly. This ensures that if glucose dissembles, the resulting clusters will produce a notable change in the longitudinal band. It was also observed that the absorbance around the transverse band increases in accordance with the red shift in the longitudinal band. The sample (12 mM glucose) was prepared in 1 mM NaCl solution. Low concentrations of glucose were tested on the GNR clusters. The effect of 12 mM glucose on an 8 μM ConA-DSGNR ensemble is shown in Figure 2C and their TEM images are shown in 3B and 3C. After the addition of glucose, the UV-Vis spectrum blue shifted (from 718 to 714 nm peak, shown as the inset in Figure 2C) towards the original position of DSGNRs (peaking at 710 nm). In addition to the UV-VIS spectrum change, the dissociation of GNR clusters after adding glucose is clearly observed by the TEM image. The degree of the spectrum peak shift of the ConA-DSGNR clusters can be modulated by the concentration of glucose added. As shown in Figure 4, the sensitivity of glucose detection using the unique longitudinal plasmonic peak blue shift of ConA-induced DSGNR aggregates ranges from 1 to 30 mM.
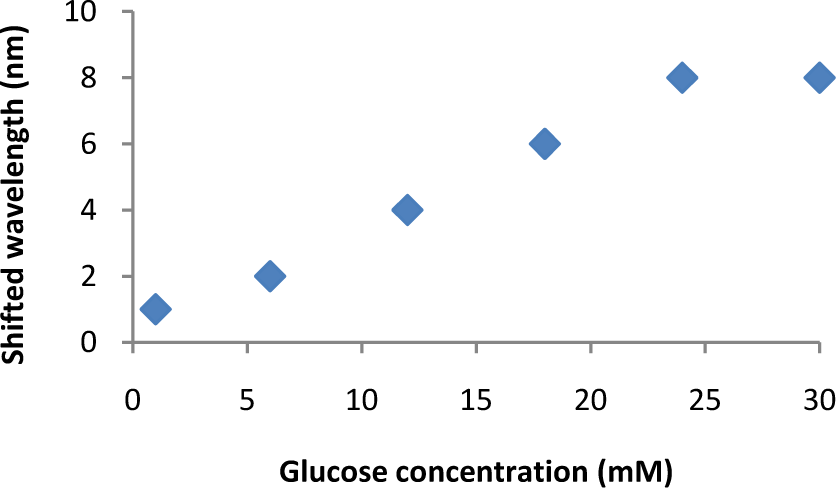
Longitudinal plasmonic peak shift as a function of glucose concentration. The dissociation of ConA-DSGNR clusters in the presence of glucose molecules is correlated with the blue shift of the longitudinal plasmonic peak of ConA-DSGNR clusters towards the longitudinal plasmonic peak of DSGNR
4. Conclusion
The study demonstrates the feasibility of utilizing ConA to facilitate the formation of DSGNR aggregation clusters. Such ensembles can be harnessed to detect the concentration of glucose that has the capability to dissociate ConA-DSGNR clusters with its competitive ConA binding affinity. Once ConA molecules are scavenged from the glucose linkages of DSGNRs, the change of longitudinal plasmon resonance from DSGNR aggregates to dissociate DSGNR, which can be used to determine the concentration of glucose.
Footnotes
5. Acknowledgments
The preparation of this article and the work conducted by the authors mentioned herein were supported financially by the Michigan Tech Fund.