
Abstract
Abstract Visual odometry provides planetary exploration rovers with accurate knowledge of their position and orientation, which needs effective feature tracking results, especially in barren sandy terrains. In this paper, a stereovision based odometry algorithm is proposed for a lunar rover, which is composed of corner extraction, feature tracking and motion estimation. First, a morphology based image enhancement method is studied to guarantee enough corners are extracted. Second, a Random Sample Consensus (RANSAC) algorithm is proposed to make a robust estimation of the fundamental matrix, which is the basic and critical part of feature matching and tracking. Then, the 6 degrees of freedom rover position and orientation is estimated by the RANSAC algorithm. Finally, experiments are performed in a simulated lunar surface environment using a prototype rover, which have confirmed the feasibility and effectiveness of the proposed method.
1. Introduction
Visual odometry is the process of determining the position and orientation of an autonomous vehicle by analysing the associated camera images. It has been used in a wide variety of robotic applications. In 1987, visual odometry was developed by L. Matthies [1] for indoor robot self-positioning. In recent years, the most successful applications of visual odometry are the Spirit and Opportunity MERs (MERs, Mars Exploration Rovers) [2] landed on Mars, in addition to the application in UGVs (UGV, Unmanned Ground Vehicle) [3, 4]. Compared with traditional local positioning sensors (e.g., wheel odometry, inertial navigation sensors), visual odometry has the following advantages:
Positioning accuracy only relies on visual inputs, so is independent of slip, slope, sinkage and other factors. In a soft outdoor environment, visual odometry has higher relative positioning accuracy and motion estimation results. Slip rate can be estimated by comparing wheel odometry information [5]. On one hand, it can obtain the soil parameters. On the other hand, it can provide the state feedbacks for navigation control [6].
The basic framework of visual odometry is feature extraction→feature matching and tracking→motion estimation. At present, the most commonly used features for matching and tracking are the Harris corner [2, 4, 6] and the SIFT operator [7]. The former has the advantage of being simple and stable, while the latter can adapt to larger differences in visual angles but wastes much computing time, which makes it inapplicable to planetary exploration rovers. Feature matching and tracking includes two parts: feature points matching from the left and right images and feature tracking from the previous and the current image pair. In general, a variety of constraint conditions are introduced to improve the accuracy of motion estimation in terms of reducing false matches. In the part of motion estimation, some algorithms, such as least-squares estimation, RANSAC [4, 7] and maximum likelihood estimation [2, 6] methods, are used to improve the solving accuracy.
Although visual odometry has been successfully applied on earth, for planetary exploration there are still some operational constraints to be solved, which are pointed out as follows.
Ensuring that the images used for visual odometry processing contain enough features is still the job of the human rover driver. The feature detector often failed to find sufficient unique features in the piles of sand. The feature-tracking algorithm with more robustness to large changes in feature location is required because the calculation frequency is low on planetary rover. It is necessary to improve the robustness of odometry for non-convergence problems.
In this paper, a visual odometry algorithm for a lunar rover is proposed with a general layout as shown in Figure 1. Section 2 presents the fast image enhancement algorithm to guarantee sufficient Harris corners are extracted. Section 3 describes the feature matching and tracking approach based on the RANSAC theory. Section 4 studies the motion estimation method after the feature tracking and 3D reconstruction. Experimental results are presented in Section 5, followed by conclusions in Section 6.

General layout of the proposed visual odometry algorithm
2. Feature Extraction and Enhancement
Visual odometry is a local positioning method dependent on feature tracking to estimate motion. The results of feature extraction will affect the stability and accuracy of motion estimation. From the relevant research information of the lunar terrain we can see that the lunar soil surface is close to silt sand. If there are no targets like rocks and ruts, which can provide enough features in images, feature points will be sparse and not strong enough. Due to this, it will be difficult to achieve feature tracking, or reduce the accuracy of motion estimation. Therefore, selecting an appropriate image pre-processing method to improve the quantity and quality of extracted features will be of great benefit to motion estimation.
2.1 Harris corner detection
Harris corners have the advantages of stability, simplicity, reasonable distribution and insensitivity to noise and illumination. The Harris operator can be described as follows:


where gx is the gradient of x direction and gy is the gradient of y direction. G($sT) is the Gaussian mask and ⊗ represents the convolution operator. E is the energy function for each pixel, Det is the determinant of the matrix and k is a constant, generally 0.04.
To ensure enough corners are detected and to prevent too many corners within a small region, improvement measures are applied in the paper. Non-maxima suppression (only local maxima in a 3times3 neighbourhood remain) is performed after E has been calculated for each pixel. Dmin is defined as the permitted minimum distance between two corners. The strongest corners are considered first and it is checked that the distance D between the newly considered corner and the corners considered earlier is larger than Dmin.
A local image enhancement algorithm, which is represented by a local histogram equalization algorithm, can improve each regional detail of an image, but requires multiple statistics of a histogram in a small window and causes an enormous calculation burden. In order to achieve the real time enhancement of an image, a morphological Top-Hat transform [8] is adopted to improve the adjacent field gradient of each pixel. This method has the advantage of being fast and easy to parallel implement.
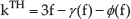
The Top-Hat transform based image enhancement method consists of a white Top-Hat transform (WTH) and a black Top-Hat (BTH) transform. The WTH transform of image f is defined as the difference between the original image f and the morphological open operation γ(f):

The result of the WTH transform is a signal peak, so it is used to detect peaks in an image.
The BTH transform of image f is defined as the difference between the morphological close operation ϕ(f) and the original image f:

The result of the BTH transform is a signal valley, so it is used to detect valleys in an image.
Because the WTH and BTH transforms can respectively detect peaks and valleys, the bright pixels will be enhanced if we add the results of the WTH transform to the original image and the dim pixels will be enhanced if we subtract the results of the BTH transform from the obtained results. Then the contrast of the whole image will be improved, which is expressed as follows:

To sum up, the process of feature extraction is organized as follows. Harris corners with sub-pixel accuracy are located by setting the minimum energy threshold Emin and the minimum distance threshold Dmin; if the extracted corner number is less than a required number n, perform the Top-Hat transform and re-extract the corners until the number of corners is larger than the required number n.
3. Feature Matching and Tracking
Feature matching and tracking is the main component of visual odometry, which directly affects the accuracy and time consumption of motion estimation. Therefore, series of measures are taken to improve the efficiency of the feature matching and tracking process, such as reducing the searching dimension, estimating the searching direction and rationally choosing the size of searching window.
3.1 Epipolar guided matching
For stereo matching, if the fundamental matrix F is accurately and autonomously estimated online, we can easily take advantage of the epipolar constraint and reduce the search space to one dimension. The RANSAC method is chosen to improve the calculation accuracy of the fundamental matrix and the robustness of mismatching. The basic idea of the RANSAC [9] method is to find out the minimal set of points that can obtain the highest proportion of correct matches through an iterative random minimal set of points. The method can obtain a stable estimate even if the erroneous data is greater than 50% of the total number. As a result, it produces a good result even in the presence of image noise and mismatching. The solving processes of F are realized as follows.
Extract Harris corners from the left image and the right image. Obtain the original matching corner pairs as a data set. Perform original matching on the corner extracted image pair. The original matching is based on the similarity measure function as shown in Eq. (6). A unique constraint is introduced to improve the reliability of the results.
Repeat m times from step Random sample a basic subset in the data set with p = 8. A fundamental matrix F is calculated based on the basic subset, using a least-squares algorithm. Calculate the pixel distance from each point to its corresponding epipolar. If the distance is less than a certain threshold, the corresponding matching pair will be considered as correct matching pair, or the matching pair will be considered as error matching pair. For every F calculated from Step 3), compare their correct matching pair numbers and preserve the fundamental matrix that has the highest number of correct matching pairs. Use all the correct match pairs to re-calculate the fundamental matrix as the final result.
 to
to  . If ε changes, use Eq. (7) to carry out an adjustment accordingly. Γ is the probability of at least one benign sampling subset being achieved and should be greater than 0.95, ε expresses the proportion of the error matching pairs accounting for the data set and p expresses the number of data points in basic subset.

3.2 The optimization of searching window
For feature matching and tracking, a reasonable searching window and searching direction can greatly reduce calculation and improve matching precision effectively. In this paper, according to the characteristics of a stereovision sensor, the feature matching and tracking is optimized based on the following aspects.
Choosing a reasonable area of interest. For ground points reconstructed from a stereo image pair, the reconstruction precision will gradually reduce with the distance increase. So the corners at the top of image that correspond to ground points in the distance should be cut out before feature matching, which can reduce the motion estimation error caused by reconstruction error. For feature matching between the left and right images, the searching direction of corresponding points is along a stable epipolar because the relative pose of the left camera and the right camera is fixed. In order to determine a proper searching window length, the image is divided into several parts. Based on the results of the stereo matching of the preframe, we can set a reference average disparity for each part to establish an updated searching window lookup table, which is helpful in saving searching time. For feature tracking between the previous and the current image pair, the searching direction and window is changed depending on the rover movement. Then for each part of the previous image pair, we compute the average searching direction and the average disparity first and then the Kalman Filter [10] is utilized to evaluate the searching direction and the average disparity of the current image pair. The efficiency of feature tracking can be enhanced.
4. Motion Estimation
According to the principles of stereo vision, after matching feature points between the left and right images of the stereo pair, we can obtain the three-dimensional position of the feature points in the rover coordinates according to the camera calibration results. The three-dimensional position of the same feature i at the previous and current stereo image respectively are Ppi = (xpi, ypi, zpi)T and Pci = (xci,yci,zci)T. The goal of motion estimation is to find out a rotation matrix R and translation vector T between Ppi and Pci, making the Equation (8) minimum, then we can obtain the changes in position and orientation of the rover.

where N is the number of feature points, which have been tracked. To ensure the accuracy and convergence of the motion estimation, the theory of RANSAC is introduced as follows.
In the data sets of successfully tracked corners, the basic subset of sampling p = 4. The rotation matrix R and translation vector T are calculated using the method of singular value decomposition from the basic subsets. Define the error threshold, detect the degree of support of all pairs of matching points to R and T and get the statistics of the inner points. Repeat Step 1) to step 3) m times to find R and T with most inner points, take all the inner points as a new set of matching points and use the singular value decomposition method to solve the final R and T.
The process of solving R and T using the method of singular value decomposition is as follows:
Calculate the centroid of Pp and Pc, indicated by P̄p and P̄c. Generate new three-dimensional point sets: P˜p = Pp – P̄p and P˜c = Pc – P̄c. Calculate T = P̄p – RP̄c.
5. Experimental Analysis
In this section, the proposed visual odometry algorithm is employed on a prototype of a lunar rover, as shown in Figure 2. The prototype has been equipped with a pair of stereo cameras and six wheel speed sensors.

Visual Odometry and the prototype of lunar rover
To ensure the visual odometry algorithm works well in a real lunar environment, a simulated lunar surface should be set up on the ground. According to reference [11], the size of lunar soil is similar to silt, particles are less than 1mm in diameter and most particles are between 30μm-1mm in diameter. The median diameter is 40˜130μm. Grey silver sand is used to construct a small-scale indoor test field to simulate the real lunar soil terrain. Figure 3 shows a pair of stereo images of the simulated lunar soil. From the original image, it can be seen that the pixel grey value is almost uniform and no obvious features can be extracted for feature matching and tracking. In such conditions, it is hard to extract enough corners with enough energy. Figure 4 shows the images after the Top-Hat transformation; the obvious contrast enhancement can be obtained. The experiment involving corner extraction shows that, under the condition of a fixed threshold of the energy function, the number of corners extracted from the enhancement image is about twice as large as the original one, which can effectively improve the quality of extracted corners.

The enhancement results of Top-Hat processing

Simulated lunar surface images taken by stereo camera
Figure 5 shows the results of corner tracking in the enhanced image. The short lines in the two images are used to connect tracking pairs, which indicate that enough corners can be extracted and tracked for motion estimation.

Corner tracking results
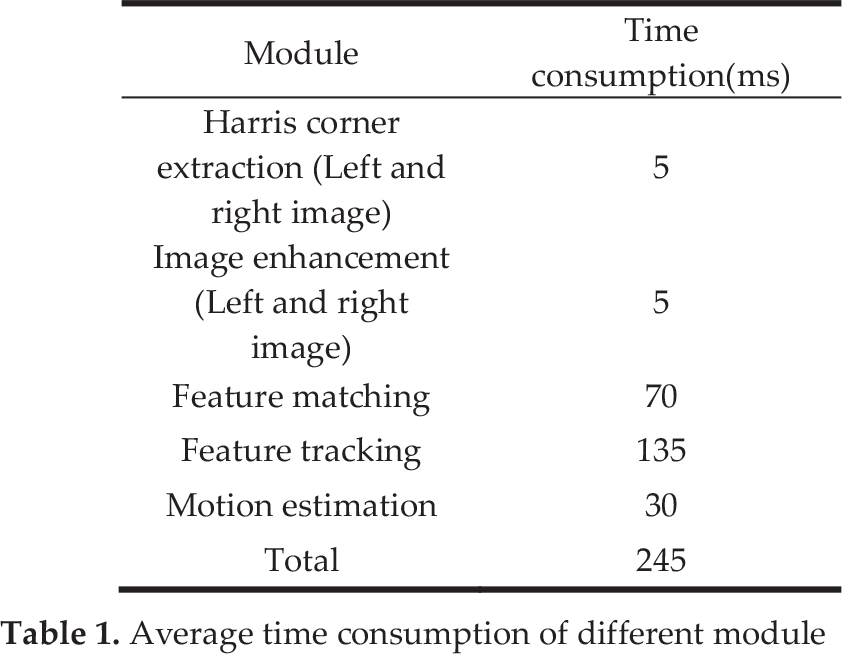
Different experiments were performed in order to test the stability and accuracy of the visual odometry algorithm in sandy terrains. The highest speed of the lunar rover is 200m/h and the average time consumption of each different module is shown in Table 1. Figure 6 shows the comparison diagram between the real trajectory and the calculated trajectory for straight-line driving. Figure 7 is the comparison diagram for arc-line driving. From the two comparison diagrams it can be seen that the calculated trajectories of the lunar rover are basically consistent with the real trajectories, which indicates that the proposed algorithm can achieve precise location results.
Average time consumption of different module

Straight-line driving results

Arc-line driving results
Table 2 shows the results of error analysis in the two kinds of conditions mentioned above, from which we can see the positioning error of the odometry is no more than 2% in 4m and the computation of pitch, roll and yaw is stable, with a small range of variation. It can be seen that the algorithm produced a stable result and met no non-convergence problems during the motion estimation.
Experiment data analysis

Figure 8 shows the changes of the rover's yaw angle, pitch angle and roll angle in the process of arc-line driving. Compared with the actual yaw angle, the cumulative measurement error is 1.28°. Influenced by the soft sand, the rover's pitch angle and roll angle changes within a small range and the overall range is no more than 3°. All of this shows that the algorithm can accurately and stably reflect the rover's position and poses changes in the six degrees of freedom.

Yaw, pitch and roll angle of rover body
When comparing the positioning output of visual odometry and the output of the wheel speed sensor, the slip rate of the rover can be evaluated. Figure 9 shows the curve of the wheel slip rate in the process of arc-line driving, from which it can be seen that the visual odometry achieves real-time estimation of slip rate, providing a good foundation for slip based driven control or trajectory tracking control.

Slip rate measurement
In addition, a square driving scenario is shown in Figure 10. The rover remotely drives a square track and then returns to the start point and the visual odometry gives the corresponding positioning results.

Square driving results
6. Conclusions
A visual odometry algorithm has been proposed to achieve stable location results for a lunar rover in sandy terrains lacking in distinctive features. The research can also be applied to outdoor unmanned vehicles working in barren or harsh environments such as the desert, snowy fields, etc. As a local positioning device, visual odometry produces cumulative errors with a continuous increase in miles of travelling. Therefore, the cumulative error correction method integrated with global positioning information should be studied in the future in order to achieve an accurate long distance location.
7. Acknowledgments
This work was financially supported by the national natural science funds of China (51107006, 61203171). The authors thank Prof. Rongben Wang of Jilin University for providing the experiment platform.