
Abstract
Background
There is no reliable marker available for early detection, diagnostic confirmation or disease prognosis of osteosarcoma. Cullin-1 (CUL1) is a newly reported tumor-related gene, and we aimed to unravel its role in osteosarcoma.
Methods
We used immunohistochemistry to analyze the correlation between CUL1 expression and clinicopathological variables and patient survival. To evaluate the function of CUL1, a group of 28 osteosarcoma patients were recruited for this study. The role of regulation of CUL1 in osteosarcoma was studied in vitro and in vivo. In addition, we further investigated the signaling pathway of CUL1 in osteosarcoma progression.
Results
We first discovered that CUL1 expression was up-regulated in human osteosarcoma tissues and inversely correlated with osteosarcoma differentiation. In addition, CUL1 promotes osteosarcoma cell proliferation in vitro and in vivo. We also found that CUL1 promotes osteosarcoma cell invasion and metastasis in vitro and in vivo. High levels of CUL1 promote osteosarcoma progression via up-regulation of MMP9 expression.
Conclusions
Our results demonstrate that increased CUL1 expression is significantly correlated with poor prognosis of patients with osteosarcoma. CUL1 might be an important marker and a therapeutic target for osteosarcoma.
Introduction
Osteosarcoma, the most common primary bone malignancy, accounts for ~20% of all bone tumors and ~5% of all pediatric tumors, predominantly affecting children and the adolescent population (1, 2). Osteosarcoma originates from primitive mesenchymal bone-forming cells and often occurs in long bones, such as proximal tibia and distal femur (3, 4). These tumors are typically rapid growers with high metastatic potential, especially to the lungs and bones (5). Although treatment with surgery and neoadjuvant chemotherapy appears to cure 60%-70% of cases (6), the 5-year survival rate for patients with recurrent and metastatic osteosarcoma is only 20% (7, 8). Understanding the biology of osteosarcomas still remains a complex challenge. An unknown etiology, high genetic instability of osteosarcoma cells, a wide histological heterogeneity, lack of biomarkers, high local aggressiveness and a rapid metastasizing potential create pivotal questions to be answered. Moreover, the molecular events that lead to the development of osteosarcoma are not yet fully understood.
The cullin family of proteins was first identified in 1996 as being required for cell cycle exit in Caenorhabditis elegans (9) and for the G1 to S phase transition in budding yeast (10). Members of the cullin family (cullin-1, cullin-2, cullin-3, cullin-4A, cullin-4B, cullin-5, cullin-7, PARC and APC2) provide the scaffold for Cullin-Ring Ligase (CRL) complexes responsible for a large portion of ubiquitin proteasome system (UPS)–mediated proteolysis. The family members are characterized by an evolutionarily conserved cullin-homology domain, and serve as molecular scaffolds to facilitate the assembly of multimeric CRLs, with SCF/CRL-1 as the founding member. Cullin-1 (CUL1) is the most extensively characterized member of the cullin family and a key component of SCF E3s, which have an indispensable role in both cell cycle progression and early embryogenesis (11).
Research investigating the mechanism of osteosarcoma development has primarily focused on chromosomal abnormalities, genetic alterations of tumor suppressor genes, activation of oncogenes and dysregulation of major signaling pathways (12). Therefore, the exact role of CUL1 in the tumorigenesis and progression of osteosarcoma has yet to be established. In the present study, the expression of CUL1 was analyzed in osteosarcoma tissue, and associations between the expression of CUL1 and several clinical characteristics were evaluated.
Materials and Methods
Cell lines and culture
Commercially produced osteosarcoma cells (MG63 and HOS) were purchased from the Cell Bank of the Chinese Academy of Sciences (Shanghai, China). Cells were cultured in Dulbecco's modified Eagle's medium (DMEM) medium with 10% fetal bovine serum (FBS) and 100 U/mL penicillin and 100 U/mL streptomycin. HEK-293T cell line was purchased from the American Type Culture Collection (ATCC) and cultured in DMEM (Gibco, USA) and 10% FBS. Cells were incubated with 5% CO2 at 37°C.
Patient information
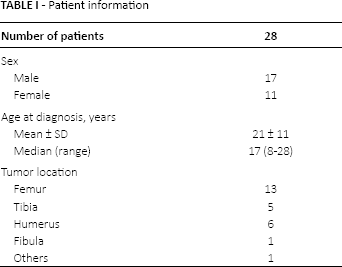
A group of 28 osteosarcoma patients was recruited for this study. The treatment was an operation combined with local radiotherapy. Osteosarcoma tissues and their adjacent nontumorous (NT) tissues were collected between 2011 and 2015 from the First Affiliated Hospital of Nanjing Medical University and the People's Hospital of Lishui District in Nanjing City. These tissue samples were immediately snap-frozen in liquid nitrogen. The clinical research ethics committee of Soochow University approved the research protocols, and written informed consents were obtained from the participants. The clinical information for the osteosarcoma patients is included in Table I. Patients with a previous history of malignant tumors were excluded from this study.
Patient information
Quantitative real-time polymerase chain reaction analysis
Total mRNA was extracted with Trizol reagent (Invitrogen, USA). The concentrations were determined using a NanoDrop ND-1000 (NanoDrop, USA). RNA was reverse transcribed to cDNA with a PrimeScript RT reagent kit (TaKaRa, Japan) using 500 ng total RNA as template. For the quantitative real-time polymerase chain reaction (RT-PCR) system, SYBR Premix Ex Taq (TaKaRa, Japan) was used. The results of quantitative PCR were defined from the threshold cycle (Ct), and relative expression levels were calculated by using the 2-ΔΔCt method (8). PCR was performed using an ABI 7900HT instrument (Applied Biosystems, USA). The primers used for PCR analysis to detect CUL1 expression were forward 5′-CAGCTCCACCATCAACATCAAC-3′, reverse 5′-AGTGCTGCTGGCATACACATT-3′. Glyceraldehyde-3-phosphate dehydrogenase (GAPDH) genes were used as internal control.
Western blot analysis and immunohistochemical staining
Cells or tissues were homogenized in Radio Immunoprecipitation Assay (RIPA) lysis buffer (50 mM Tris containing 150 mM NaCl, 0.1% sodium dodecyl sulfate [SDS], 1% Triton ×-100, 1% sodium deoxycholate, pH 7.2) with fresh protease and phosphatase inhibitor cocktail (Merck, USA) on ice for 15 minutes and centrifuged at 14,500g for 30 minutes. Protein concentration was determined by BCA Assay (Pierce, USA). Proteins (50 te) were separated by 10% sodium dodecyl sulfate–polyacrylamide gel electrophoresis and then transferred to nitrocellulose membranes (Bio-Rad Laboratories, USA). The membranes were blocked with 5% nonfat milk and incubated with antibodies. The membranes were subsequently incubated with a goat anti-mouse horseradish peroxidase secondary antibody (Sigma, USA). The protein complex was detected using enhanced chemiluminescence reagents (Pierce, France). Endogenous beta-actin was used as the internal control. CUL1 (Abgent, USA), MMP2, MMP9 and and tin (Cell Signaling Technology, USA) antibodies were prepared. Immunohistochemical staining was performed on 4-μetected using enhanced chemiluminescence reagents (Pierce, France). Endogenous beta-actin was used as the internal control. CUL1 (Abgent, USA), ce). Endogenous beta-actin was used as the internal control. CUL1 (Abgent, U according to the manufacturer's instructions (DAKO, Demark).
Cell proliferation assay and colony formation assay
Cell proliferation was quantified using the Cell Counting Kit-8 (CCK-8; Japan) according to the manufacturer's instructions. Cells numbering 1,000-2,000 were planted into 96-well plate, and OD450 was tested every 24 hours. For the colony formation assays, 500-1,000 cells per well were incubated in medium containing 10% FBS for 2 weeks. The colonies were fixed with methanol and stained with 0.1% crystal violet in 20% methanol for 20 minutes. The number of colonies containing more than 30 cells was counted using an inverted microscope.
Migration and invasion assays
For cell migration assay, 5 × 10⁴ cells were suspended in 200 mL serum-free DMEM medium and seeded into the upper chamber of each insert. Then, 800 mL of DMEM containing 10% FBS was added to a 24-well plate. After incubation at 37°C for 12 hours, the cells that migrated were fixed and stained for 30 minutes in a dye solution containing 0.2% crystal violet and 20% methanol. For the cell invasion assay, chambers were uniformly covered with 40-80 mL Matrigel (BD Biosciences, USA) diluted with DMEM to a certain percentage and incubated at 37°C for 2-4 hours. Then, 1 × 10⁵ cells were suspended in 200 mL DMEM and seeded in the upper chambers, and 800 mL DMEM containing 10% FBS was added to the lower chamber. After incubation at 37°C for 16-20 hours, the cells were fixed and stained.
Vector construction and oligonucleotide transfection
The open reading frame (ORF) of CUL1 was amplified by nested PCR and cloned into the pLVX-IRES-Neo vector (Clontech, USA). The primers and endonuclease sites used for the vector constructs are shown in the Supplementary Table (see Supplementary Table I – Primer sequences, avail able online at www.biological-markers.com). Virus particles were harvested 48 hours after cotransfecting pLVX-CUL1 with the packaging plasmid ps-PAX2 and the envelope plasmid pMD2G into HEK-293T cells using Lipofectamine 2000 reagent (Invitrogen, USA). MG63 and HOS cells were infected with recombinant lentivirus-transducing units plus 6 μg/mL polybrene (Sigma, USA). Small interfering RNA (siRNA) of CUL1 were synthesized (Ribobio, China). Oligonucleotide transfection was performed using Lipofectamine 2000 reagent (Invitrogen, USA) according to the manufacturer's instructions. The final concentration of siRNA in the transfection mixture was 50 nM.
Xenograft and intravenous tumor model
For the in vivo tumor formation assays, 2 × 10 6 MG63 cells infected with the Lenti-CUL1 or mock vector were suspended in 200 μL serum-free DMEM and subcutaneously injected into the flank of each nude mouse (female BALB/c-nu/nu, 4 per group). The tumor sizes were measured twice a week as soon as the tumors were measurable, and the volumes were calculated with the formula: (L × W 2 ) × 0.5, where L is the length and W is the width of each tumor. The mice were sacrificed after a period of 5-7 weeks, and the weight of subcutaneous tumors was recorded.
For the in vivo assays of metastasis, 2 × 10⁶ MG63 cells infected with Lenti-CUL1 or mock vector were suspended in 200 μL serum-free DMEM and subcutaneously injected into nude mice through the tail vein (female BALB/c-nu/nu mice, 6 per group). After 8 weeks, the mice were sacrificed, and their lungs were dissected, fixed with phosphate-buffered neutral formalin, and prepared for standard histological examination. The mice were manipulated and housed according to protocols approved by the Soochow University Medical Experimental Animal Care Commission.
Statistical analyses
The results are presented as the mean values ± SEM. The association between CUL1 staining and the clinicopathological parameters of the osteosarcoma patients were evaluated by chi-square test. The survival curves were plotted according to the Kaplan-Meier method, with the log-rank test applied for comparisons. Differences between groups were estimated using the chi-square test, Student's t-test, the Mann-Whitney-U test, and repeated-measures ANOVA. Relationships were explored by Spearman's correlation. A p value of <0.05 was considered statistically significant.
Results
Patient clinicopathological features
A number of 28 primary invasive osteosarcoma patients were recruited for this study. All of the patients were pathologically diagnosed. The median age of the patients was 17 years (range 8-28 years). The distribution of tumor location was as follows: femur 13, tibia 5, humerus 6, fibula 1, other 1. In this cohort, 2 patients were confirmed with lung metastasis, and 1 patient had positive margin status. These clinicopathological features are summarized in Table I.
Elevated expression of CUL1 in osteosarcoma tissues
Expression of CUL1 was examined by RT-PCR in osteosarcoma and adjacent NT tissues. High expression of CUL1 was detected in osteosarcoma tissues compared with NT tissues. The difference in CUL1 expression was statistically significant (p<0.001; Fig. 1A). The expression level of CUL1 was remarkably up-regulated in 16 of the 28 osteosarcoma tissues (57.1%), and only 7 cases (25.0%) were down-regulated, while 5 cases (17.9%) were unchanged (Fig. 1B).
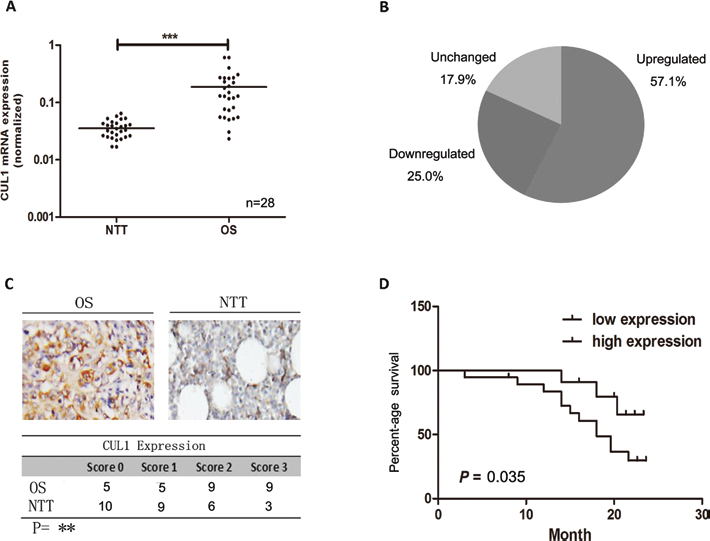
(A, B) Expression level of CUL1 was remarkably up-regulated in osteosarcoma tissue (OS) compared with nontumoral tissue (NTT); (C) CUL1 protein expression was up-regulated in osteosarcoma tissue; (D) CUL1 expression level was inversely correlated with overall survival (OS) (*p<0.05, **p<0.01, ***p<0.001).
To further demonstrate CUL1 protein expression levels in osteosarcoma, immunohistochemistry was performed consequently. The cases were scored from 0 to 3 according to the percentage of positive cells (score 1: 0-25%, score 2: 25%-50%, score 3: 51%-75%, score 4: 76%-100%). The samples scored 1-2 were determined as CUL1 low expression, while others scored 3-4 were determined as CUL1 high expression. CUL1 protein expression was up-regulated in osteosarcoma tissues (p<0.05, Fig. 1C). More importantly, enhanced immunoreactivity of CUL1 in osteosarcoma tissues was inversely correlated with overall survival (OS), which suggested a poor prognosis for the osteosarcoma patients (p<0.01, Fig. 1D).
CUL1 promoted osteosarcoma cell proliferation in vitro and in vivo
CUL1 overexpressed stable cell lines (MG63 and HOS) were constructed, and expression levels of CUL1 mRNA were dramatically up-regulated after infected with Lenti-CUL1. CUL1 mRNA levels were obviously decreased after being silenced by CUL1 specific siRNAs (Fig. 2A). A cell proliferation assay revealed that overexpression of CUL1 significantly promoted osteosarcoma cell growth. In contrast, silencing of CUL1 expression with siRNA significantly repressed the growth of osteosarcoma cells (Fig. 2B). Besides that, a colony formation assay confirmed that CUL1 overexpression increased the colony formation rates of MG63 and HOS cells (Fig. 2C). To further assess the function of CUL1 in vivo, tumor formation assays in a nude mouse model were performed. Compared with the control group, overexpression of CUL1 in MG63 promoted tumor growth with remarkable tumor volume and weight in nude mice (Fig. 2D).
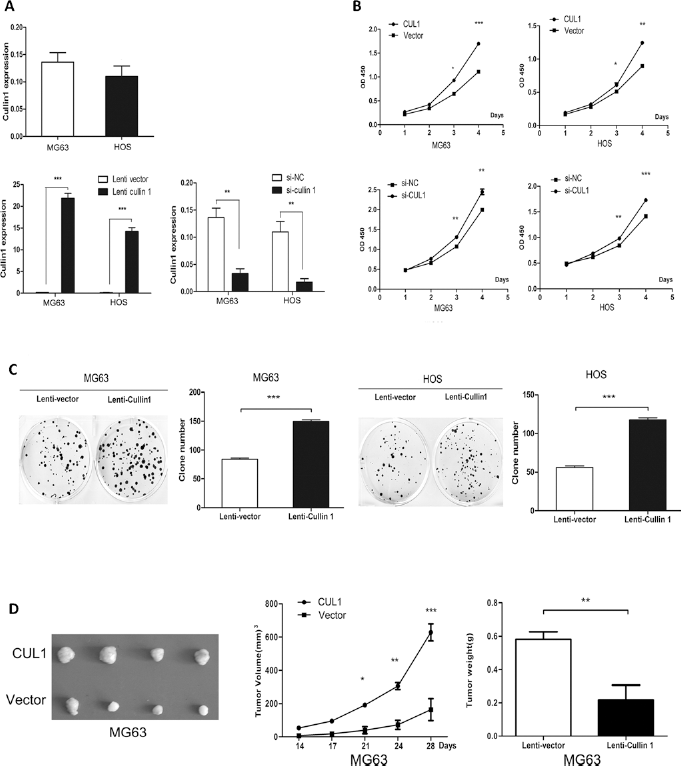
(A) CUL1 expression in CUL1-overexpressed and CUL1-depleted MG63 and HOS cell lines; (B) CUL1 overexpression significantly promoted MG63 and HOS cell growth; (C) CUL1 overexpression promoted colony formation rates of MG63 and HOS cells; (D) Overexpression of CUL1 in MG63 promoted tumor growth with remarkable tumor volume and weight in nude mice (*p<0.05, **p<0.01, ***p<0.001).
CUL1 promoted osteosarcoma cell invasion and metastasis in vitro and in vivo
Transwell assays demonstrated that the overexpression of CUL1 significantly enhanced both migration and invasion in osteosarcoma cells (Fig. 3A, B). In contrast, the silencing of endogenous CUL1 in osteosarcoma cells decreased cell migration and invasion (Fig. 3C, D).
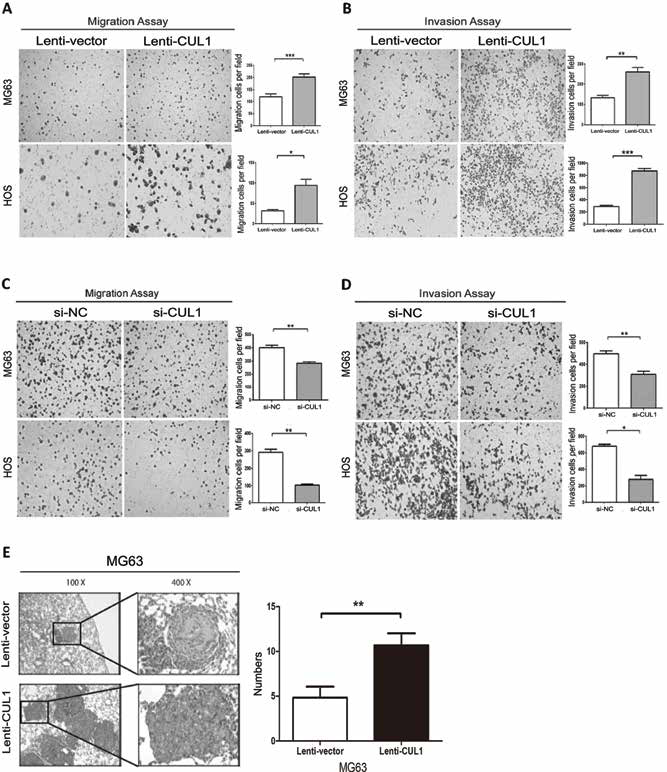
(A, B) Overexpression of CUL1 significantly enhanced both migration and invasion in MG63 and HOS cells determined by transwell assays without or with Matrigel; (C, D) Silencing of endogenous CUL1 decreased cell migration and invasion in MG63 and HOS cells; (E) CUL1 overexpression enhanced the metastatic ability of MG63 cells in vivo (*p<0.05, **p<0.01, ***p<0.001).
Further, the MG63 and control cells were injected into nude mice through the tail vein. Six weeks later, the lungs were prepared for standard histological examination. The results showed that the number of metastatic nodules was significantly increased in the mice with CUL1 cells (Fig. 3E).
High level of CUL1 promoted osteosarcoma progression via up-regulation of MMP9 expression
As shown in Figure 4A, elevated levels of MMP2 and MMP9 were detected in both MG63 and HOS cells that overexpressed CUL1. In contrast, decreased MMP2 and MMP9 levels were determined in CUL1-depleted osteosarcoma cells (Fig. 4B). To further clarify whether targeting of MMP9 might mediate the promotion of cell proliferation, invasion and metastasis, we performed a series of functional restoration assays using CUL1-overexpressed MG63 and HOS cells. First, cotransfection experiments using MMP9 siRNAs showed that CUL1 overexpression did not enhance the growth rate of osteosarcoma cells when MMP9 expression had been silenced by siRNA (Fig. 4C, D). Moreover, CUL1 overexpression in MG63 cells did not promote cell migration and invasion when MMP9 expression had been silenced by siRNA (Fig. 4E, F).
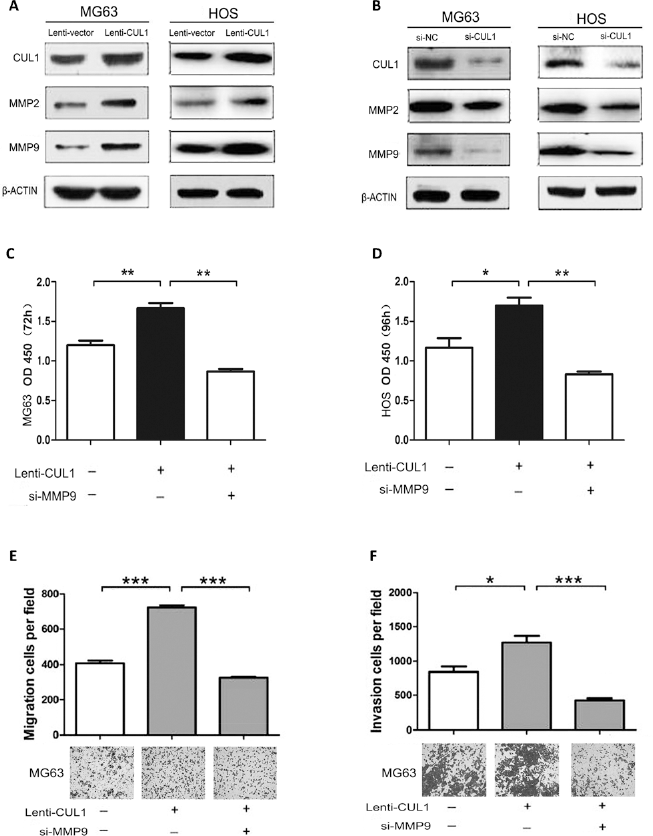
(A) MMP2 and MMP9 levels were elevated in CUL1 stable osteosarcoma cells; (B) MMP2 and MMP9 levels decreased in CUL1-depleted osteosarcoma cells; (C, D) CUL1 overexpression did not enhance the growth rate of osteosarcoma cells when MMP9 expression had been silenced by siRNA; (E, F) CUL1 overexpression did not promote cell migration and invasion when MMP9 expression had been silenced by siRNA in MG63 cells.
Discussion
Osteosarcoma is a rare tumor with a low incidence of about 3 per 1 million (13). Over the past few decades, no substantial improvement in survival rate has been achieved, although efforts were made by intensifying dosing, varying timing and using multicombinational chemotherapy (14). Hence, there is an increasing sense of urgency to identify new biological markers and develop novel, innovative and specific molecular-targeted therapeutic approaches to improve the outcome in osteosarcoma patients with poor prognosis. It was recently reported that the silencing of CUL4B gene expression can effectively inhibit osteosarcoma cell proliferation and induce apoptosis (15).
The ubiquitin–proteasome system plays an important role in maintaining the balance between normal growth and uncontrolled proliferation by regulating a large variety of cellular proteins (16), although among the 8 cullins, only CUL1 is a component of the SCF E3 ligases, which serves as a rigid scaffold in SCF complex assembly, and aberrant expression of CUL1 results in the dysfunction of SCF E3 ligases (17). CUL1 was also reported as a direct target of EWS-FLI1 regulating cell proliferation and apoptosis in Ewing sarcoma (18). Cullin-mediated substrate degradation involves a wide range of cellular processes such as proliferation, apoptosis and differentiation.
Do et al found that CUL1 expression and cyclin D1 expression are associated with malignant progression and aggressive behavior of thyroid papillary carcinoma (19, 20). Similarly, Liu et al found that CUL1 is up-regulated and associated with poor patients' survival in hepatocellular carcinoma (21), and Bai et al recently described the relationship between CUL1 expression and poor prognosis in gastric cancer (19). Wang et al reported that CUL1 regulates cell proliferation and metastasis in colorectal cancer (22). Fan et al demonstrated that CUL1 regulates proliferation, migration and invasion of glioma cells (23).
In our results, high expression of CUL1 in osteosarcoma tissues suggests that CUL1 might contribute to tumor genesis. To confirm this inference, we performed cell proliferation assays and revealed that overexpression of CUL1 significantly promoted osteosarcoma cell growth. Overexpression of CUL1 in MG63 promoted tumor growth with remarkable tumor volume and weight in nude mice. Moreover, we also found that overexpression of CUL1 significantly enhanced both migration and invasion of osteosarcoma. Finally, We found that high levels of CUL1 promoted osteosarcoma progression via up-regulation of MMP9 expression. This is the first time the relationship between CUL1 and MMP9 in osteosarcoma is described. More studies and cases will be needed to reveal the in-depth mechanism.
Conclusion
In summary, CUL1 exerts multiple biological effects in the osteosarcoma cell line. Through promoting proliferation and by countering cisplatin-induced apoptosis, CUL1 has been deeply implicated in the pathogenesis and development of osteosarcoma. Thus, CUL1 might be an important marker and a therapeutic target for osteosarcoma.
Footnotes
Financial support: No grants or funding have been received for this study.
Conflict of interest: None.