
Abstract
Osteosarcoma is the most common primary malignant bone tumor in the clinic. It is more common in children and adolescents. It has high malignancy, early metastasis rate, rapid disease progression, and high mortality. Although past years have witnessed the great improvement in the treatments of osteosarcoma, there remains a long way to go. MicroRNAs affect the malignant biological behaviors such as tumor proliferation and metastasis by regulating their target genes. In this study, we investigated the role and mechanism of miR-384 in osteosarcoma. Quantitative real-time polymerase chain reaction assay was performed to detect the expression of miR-384 and insulin-like growth factor binding protein 3 in osteosarcoma tissues and cell lines and established its correlation with osteosarcoma tumor progression and metastasis. To probe whether miR-384 played a tumor suppression role in osteosarcoma, we carried out gain-of-function and loss-of-function assays. Cell Counting Kit-8, cell colony formation, and transwell assays were carried out to determine the cells proliferation and invasion, respectively. Western blot was used to detect the changes of epithelial–mesenchymal transition marker proteins and insulin-like growth factor binding protein 3. MiR-384 was downregulated in osteosarcoma tissues and cell lines. MiR-384 was overexpressed in G292 cells transfected with miR-384 mimics and knocked down in Saos-2 cells with small hairpin RNA targeting miR-384. Ectopic expression of miR-384 inhibited osteosarcoma cell proliferation, colony formation, and invasion. E-cadherin was brought to a decrease whereas N-cadherin and Snail to an increase under the silent expression of miR-384, while overexpression of miR-384 led to an opposite result. MiR-384 could regulate insulin-like growth factor binding protein 3 expression in osteosarcoma. Quantitative polymerase chain reaction and Western blotting results validated that miR-384 knockdown downgrades both messenger RNA and protein levels of insulin-like growth factor binding protein 3 in G292 cells, while miR-384 upregulation exerted an opposite effect in Saos-2 cells. Insulin-like growth factor binding protein 3 was upregulated in osteosarcoma tissues and osteosarcoma cell lines compared with normal ones. Through the bioinformatics database found that the upstream transcriptional regulator of insulin-like growth factor binding protein 3 is MECP2. So miR-384 can directly inhibit MECP2 and then promote the expression of insulin-like growth factor binding protein 3. These results suggested that miR-384 might be a potential therapeutic targets and biomarker in osteosarcoma.
Introduction
Osteosarcoma (OS) is one of the most common tumors in orthopedics. Due to the poor therapeutic effect of malignant bone tumors, before the 1970s, the main treatment methods were amputation and joint dislocation, and the 5-year survival rate was only 20%. 1 Osteosarcoma has the characteristics of strong invasiveness, easy recurrence, and poor therapeutic effect, which lead to an increase in the difficulty of treatment. 2 In recent years, studies have found that microRNAs (miRNAs) were closely related to the occurrence, metastasis, and invasion of OS and had been paid attention to the scholars at home and abroad. 3
MicroRNA is an endogenous, noncoding, small-molecule RNA that regulates gene expression at the post-transcriptional level by specific binding to the target gene messenger RNA (mRNA), which results in RNA degradation and translational repression. 4 Studies have shown that miRNAs are involved in the regulation of tumor initiation, progression, and metastasis. 5 MicroRNAs are abnormally expressed in a variety of tumors and play a role in tumor suppression or cancer promotion during tumor development and progression. 4 MiR-384 is a widely studied miRNA, which is almost expressed in all malignant tumor tissues in humans and was originally found to be abnormally expressed in lung tumors. 6 Interestingly, it has been reported to inhibit HOBX7 mRNA stability in human prostate cancer cells. 7 However, its role in many other cancers, such as OS, remains in the dark.
Insulin-like growth factor binding protein 3 (IGFBP3) is located at 7p12-14, and its encoded protein product is IGFBP3. 8 Insulin-like growth factor binding protein 3 is the highest serum content of the 6 binding proteins of the IGFBPs family. As a multifunctional protein, IGFBP3 can inhibit cell growth and induce apoptosis. 9 It is a transporter of IGF-1, which inhibits cell proliferation by prolonging the half-life of IGF-1 and limiting its binding to IGF-1R to regulate the biological activity of IGF-1. 10 In addition, IGFBP3 can participate in multiple cell signaling pathways to regulate tumor development, metastasis, and recurrence in the absence of IGF-1.
The present study aimed to explore the role of miR-384 in OS. The upregulation of miR-384 and IGFBP3 in OS tissues and cell lines was identified by quantitative polymerase chain reaction (qPCR). Gain-of-function and loss-of-function assays including Cell Counting Kit-8 (CCK-8), clonal formation analysis, transwell assay, and Western blotting (WB) were carried out to validate the oncogenic role of miR-384 in OS. Together, the present study unveiled that miR-384 accelerated cell proliferation and invasion in OS by regulating IGFBP3.
Materials and Methods
Tissue Collection
The study included 92 patients with OS admitted to Angang General Hospital from June 2016 to May 2018, of which 47 had tumor metastasis and 45 had no metastasis, as summarized in Table 1. All patients with OS were diagnosed by pathology and were not treated.
Clinicopathological Features of the Patients With Osteosarcoma Cancer.

Cell Lines and Cell Culture
Human OS cell lines, including MG63, Saos-2, G292, and U20S (ATCC, MA), were grown in Dulbecco’s modified Eagle’s minimal essential medium (DMEM-high glucose, New York State, USA; Gibco) supplemented with 10% fetal bovine serum (FBS, New York State, USA; Gibco) and 1% penicillin-streptomycin solution, in a humidified atmosphere of 5% CO2.
Quantitative Real-Time Polymerase Chain Reaction
A total of 1 mL of Trizol reagent was added to the cells to extract total RNA. RNA was reverse transcribed into complementary DNA using PrimeScript RT Kit (TaKaRa, Dalian, China), according to the manufacturer’s instructions. Real-time qPCR assays were carried out using a CFX96-Real-Time System. The PCR procedure was as follows: 40 cycles at 95°C for 5 seconds, denaturation at 95°C for 10 seconds, annealing at 60°C for 20 seconds, and extension at 72°C for 15 seconds. The primers were as follows: IGFBP3: 5′-TGGCCACTGCTGCTTCCTCTTCTT-3′/5′-GGGGCCAGCTTCGTCATACTCCT-3′; MECP2: 5′–AGTGCACTGCTTTGCCCTCTTCTA-3′/5′-CCAGCCGCCTTCGTCATAGCTAG-3′; small hairpin RNA (shRNA) miRNA-383: 5′-TCTGGGCAACAAAGTGAG-3′/5′-CTCAACTGGTGTCGTGGA-3′; and miRNA-383 mimics: TGTGCGCAGCAGAGCCTG-3′/5′-GCTGACCTCGTGTCGTGCTG.
Three duplicate wells were used for each sample. The relative mRNA expression levels were calculated using the 2−ΔΔCt method and GAPDH as a reference standard.
Cell Transfection
The study was performed in 3 different 6-well plates for G292 and Saos-2 cells. Each plate was devoted to 3 study groups (in triplicate): miRNA-383 shRNA (shmiR-384), negative control (shNC), miR-384 mimics (miR-384 mimics), and negative mimics (NC mimics). Cells were plated in 6-well plates at 2 × 10⁵ cells/well and cultured overnight to 50% to 60% confluence. The cells were subsequently transfected with shNC, shmiR-384, miR-384 mimics, and NC mimics using Lipofectamine 2000, according to the manufacturer’s instructions (Invitrogen, Carlsbad, California). The effect was examined using PCR analysis after transfection for 48 hours. Cells were harvested after 48 hours of transfection for the subsequent experiment.
Cell Proliferation Assay and Cell Colony Assay
Logarithmic growth phase cells were seeded into a 12-well plate at a cell density of 5 × 10⁴ cells/mL. After successful transfection for 48 hours, the cells were incubated for 1 to 5 days, followed by the addition of 20 μL of CCK-8 reagent per well. A Synergy H4 Hybrid microplate reader (Bio Tek, Winooski, Vermont) was used to detect readings at 450 nm.
After cells were successfully transfected, they were plated at 200 cells/well in a 6-well plate and cultured for 15 days. The cells were fixed in 10% paraformaldehyde for 10 minutes and stained with a 0.1% crystal violet solution for 15 minutes. Finally, the number of clones was observed under a microscope.
Immunohistochemistry Analysis
The tissue samples harvested from clinical patients after operation were fixed with formalin, then embedded with paraffin, and finally analyzed by immunohistochemistry. The 4-μm-thick slide was dewaxed, hydrated, and the antigen was recovered, then washed with phosphate-buffered saline (PBS), and incubated with primary antibody overnight at 4°C. The slides were then washed in PBS and co-incubation with antibody II containing horseradish peroxide (Santa, Santa Cruz, USA) for 1 hour at room temperature.
Transwell Invasion Assay
After transfection, the lower transwell chamber was filled with 600 μL of DMEM with 10% FBS, and 300 μL of the serum-free cell mixture was added to the upper transwell chamber. The cells were incubated for 48 hours at 37°C under 5% CO2 and then fixed in 75% ethanol and counted after crystal violet staining. We used a Varioskan Flash Microplate Reader (Thermo Scientific, Waltham, Massachusetts) to collect the data at a wavelength of 450 nm after 48 hours of culture.
Western Blotting
Cells were washed 3 times with cold PBS. Then, the cells were lysed on ice for 30 minutes and centrifuged at 3500 rpm for 3 hours at 4°C; the supernatant was used as the total protein extract. The protein concentration was measured using a bicinchoninic acid kit (Sigma, santa clara, USA). The sample was then mixed with loading buffer, boiled at 100°C for 5 minutes, and run on a prepared sodium dodecyl sulfate gel for separation. After separation, the proteins were transferred to a polyvinylidene fluoride membrane, which was incubated with primary antibody at 4°C overnight. The antibody-skimmed milk solution was washed away for 1 hour the next day, and labeled secondary antibody was then incubated for 1 hour. The secondary antibody was then washed away, and detection was performed with electrochemiluminescence reagents. Finally, the blots were quantified by densitometry using a computed image analysis program (Amercontrol Biosciences).
RNA Transcriptome Sequencing
RNA samples were treated with DNase I to degrade any possible DNA contamination. Then, oligomeric (dT) beads were used to enrich the mRNA. Mixed with fragment buffer, the RNA fragments were transformed into short fragments. The first strand of the DNA was then synthesized using random hexamer primers. The second chain was synthesized by adding buffer, dNTP, RNase H, and DNA polymerase I. Double-stranded DNA was purified by magnetic beads. End repair and addition of 30-terminal mononucleotide α (adenine) were performed.
Dual-Luciferase Assay
Dual-luciferase reporter assay was performed to evaluate the binding efficiency between miR-384 and the 3′-untranslated region (3′UTR) of MECP2. Briefly, G292 or Saos-2 cells (1 × 10⁵ cells/well) were seeded in 24-well plates. After the cells reached 70% confluence, pMIR-MECP2-3′UTR wild-type plasmid (MECP2 WT 3′UTR) or mutant reporter plasmid (MECP2 MUT 3′UTR) and pRL-SV40 renilla plasmid (Promega, Fitchburg, Wisconsin) were miR-384 into cells using Lipofectamine 2000 (Invitrogen), according to the protocols described above. The luciferase activity was subsequently measured using the dual-luciferase reporter assay kit (Promega), according to the manufacturer’s protocols.
Statistical Analysis
The data were analyzed using GraphPad Prism 8 software. The data from 2 groups were statistically compared using an unpaired Student t test. One-way analysis of variance with Bonferroni correction was used for multiple comparisons. The in vitro experiments were repeated at least 3 times, and the data are presented as the mean ± standard deviation from at least 3 independent experiments. P values <.05 were considered significant for all analyses.
Results
MiR-384 Downregulates OS and Affects Patient Prognosis
To observe the role of miR-384 in OS, we examined the expression of miR-384 in different tissues of OS, such as normal and tumor tissues. We found that miR-384 expression was abnormally reduced in OS tumor tissues (Figure 1A), suggesting that miR-384 abnormalities are closely related to the progression of OS. Therefore, we further verified that qRT-PCR detected the tumor tissues of patients with OS with different clinical stages and found that the expression of miR-384 in tumor tissues was further reduced with the increase in clinical stage (Figure 1B). In addition, we also examined tumor tissue in patients with metastatic and nonmetastatic OS and found that low expression of miR-384 was associated with tumor metastasis in patients (Figure 1C). These results suggest that miR-384 was closely related to the occurrence and development of OS. The cell assay was also similarly characterized by miR-384 low expression in different OS cell lines, which was highest in Saos-2 cells compared to normal osteoblasts and lowest in G292 (Figure 1D).

The expression level of miR-384 was reduced in osteosarcoma cancer tissues and cells. A, The expression level of miR-384 was significantly lower in the tumor tissue than in normal tissue as detected by real-time polymerase chain reaction. B, The expression level of miR-384 was significantly lower in the I to II tumor tissue than in the III to IV tumor tissue. C, The expression level of miR-384 was significantly lower in the metastasis tumor tissue than in the nonmetastasis tumor tissue. D, MiR-384 messenger RNA expression levels in MG63, Saos-2, G292, and U20S osteosarcoma cells. The highest expression level of miR-384 was found in Saos-2, and lowest was found in G292. The data are expressed as the mean ± standard error of the mean. *P < .05, **P < .01, ***P < .001.
MiR-384 Inhibited the Proliferation of OS
To probe whether miR-384 played as tumor suppressor in OS, we carried out gain-of-function and loss-of-function assays. MiR-384 was overexpressed in G292 cells transfected with miR-384 mimics and knocked down in Saos-2 cells with shRNA targeting miR-384, with NC mimics and shNC as a negative control (Figure 2A). We detected the viability of the cells with CCK-8 and found that miR-384 further inhibited the proliferation of OS cells (Figure 2B). The clone formation experiment showed the same result (Figure 2C). This indicates that miR-384 is a tumor suppressor gene, and its deletion or overexpression has a great influence on the proliferation of OS.
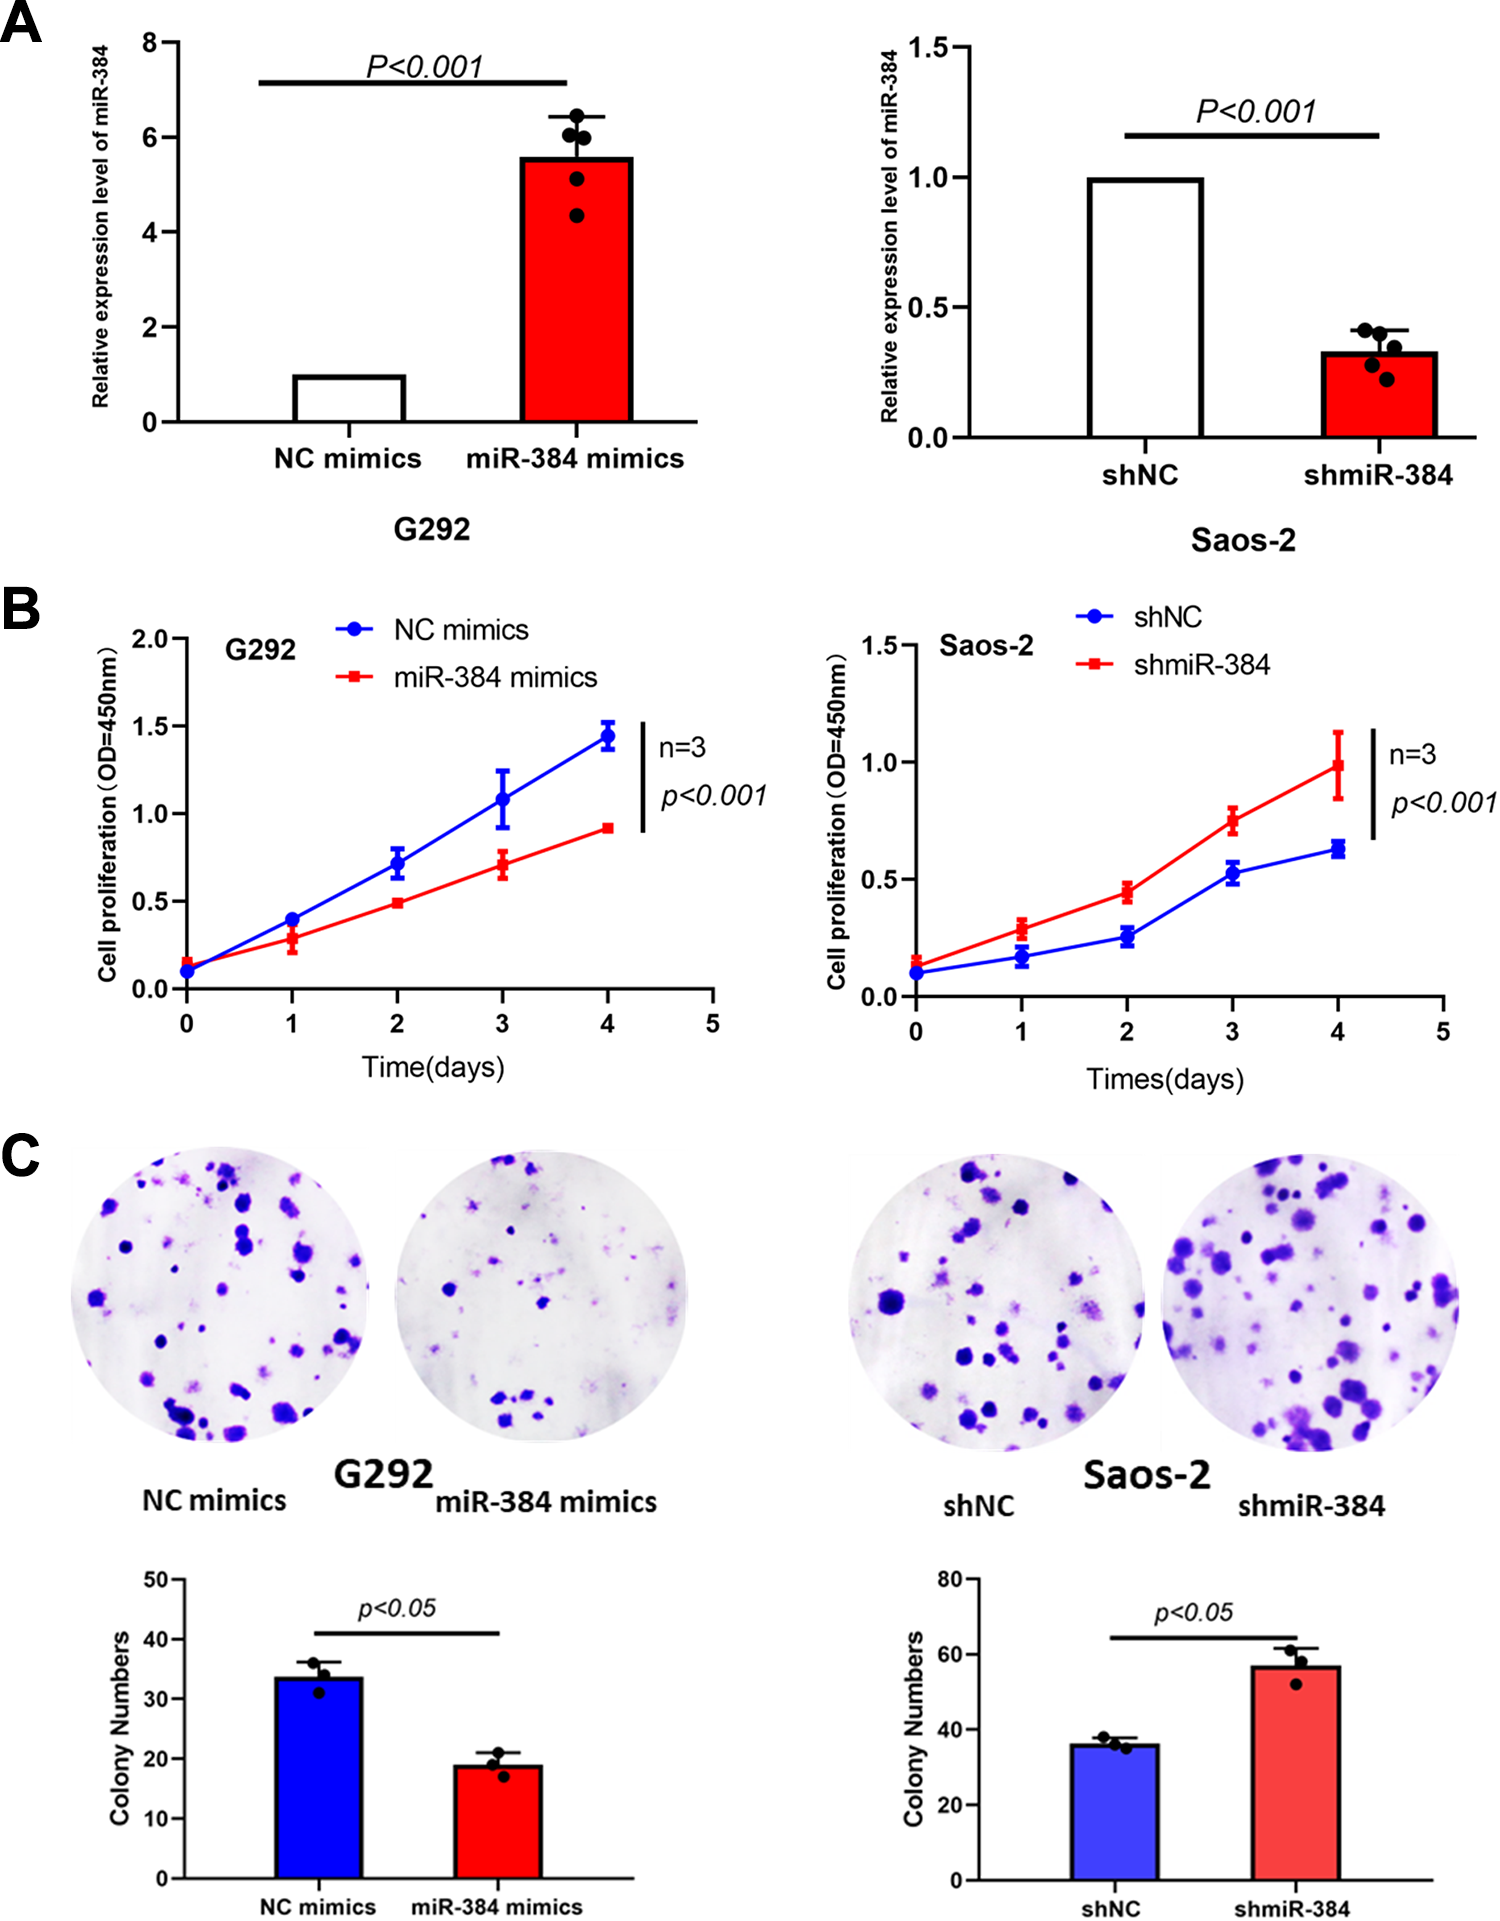
Inhibition of the proliferation of osteosarcoma. A, SCC-9 cells were transfected with shmiR-384, miR-384 mimics, shNC, and NC mimics. The expression of miR-384 in Saos-2 and G292 cells was confirmed by qRT-PCR. B, C, Cell proliferation was determined by the CCK-8 and colony formation assays (10 × 40 μm). The results indicated that upregulation of miR-384 inhibited significantly, while downregulation of HMGB1 promoted cell proliferation. The data are expressed as the mean ± standard error of the mean. *P < .05, **P < .01, ***P < .001. CCK-8 indicates Cell Counting Kit-8; NC, negative; qRT-PCR, quantitative real-time polymerase chain reaction.
MiR-384 Attenuates the Invasion of OS by Inhibiting EMT
In addition to affecting the proliferation of OS cells, miR-384 has the same effect on its invasion. Through in vitro invasion experiments, we found that miR-384 can effectively inhibit the invasion of OS cells. When miR-384 was overexpressed, the invasive ability of OS cells was significantly reduced, whereas when it was silenced in OS cells, it shows the opposite phenomenon (Figure 3A). MiR-384 inhibits the proliferation and invasion of OS cells. To obtain more evidence, we examined the protein level of EMT markers and found that E-cadherin was brought to a decrease whereas N-cadherin and Snail to an increase under the silent expression of miR-384, while upregulation of miR-384 led to an opposite result (Figure 3B). Results above indicated that miR-384 declined cell proliferation and migration in OS.
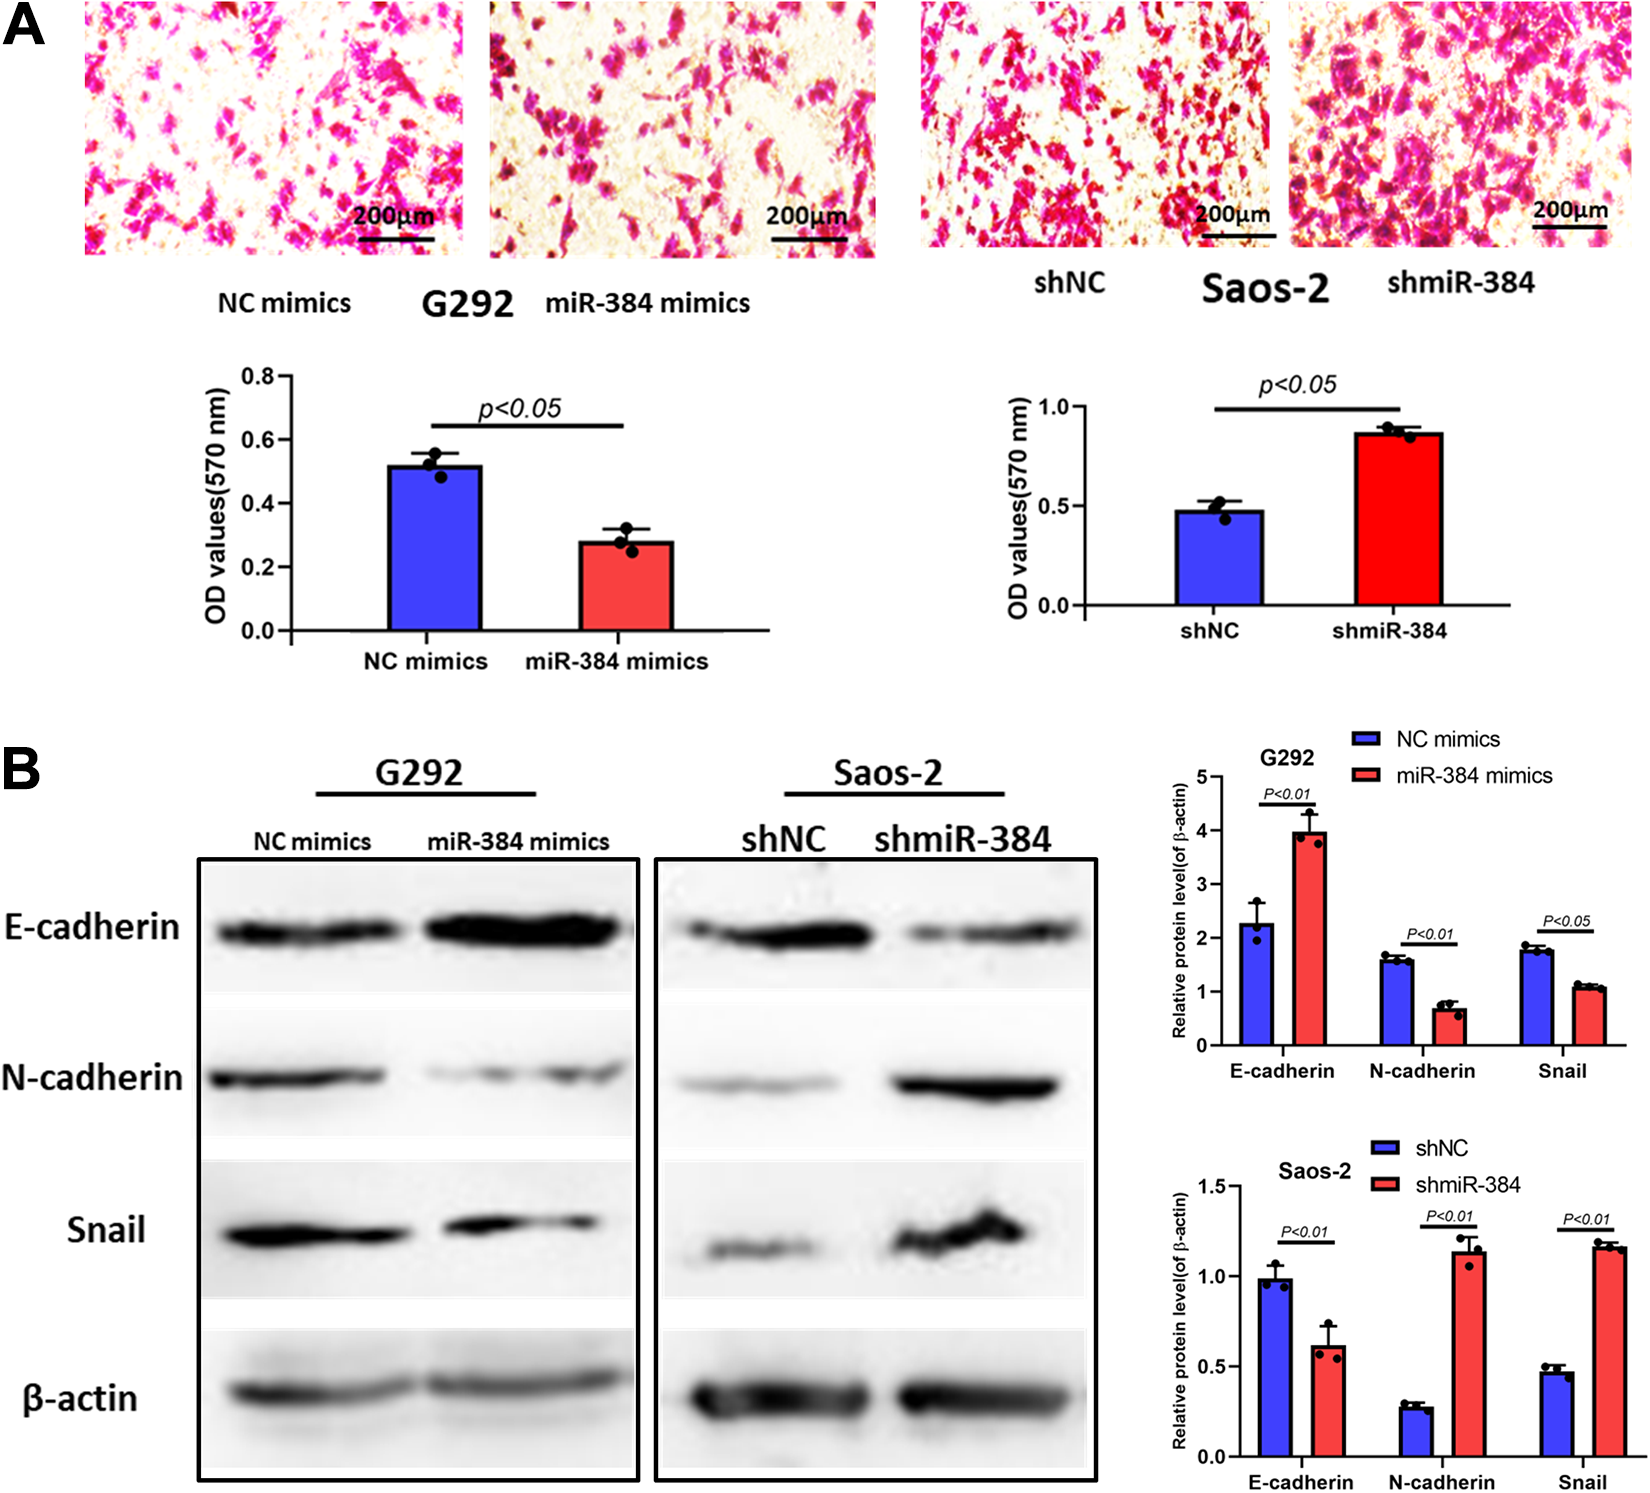
MiR-384 attenuates the invasion of osteosarcoma by inhibiting epithelial–mesenchymal transition (EMT). A, Inhibition and promotion of osteosarcoma cell invasion ability after overexpression and silencing of miR-384. B, The expression levels of EMT marker proteins were examined by Western blot after shmiR-384 and miR-384 mimics transfection. The data are expressed as the mean ± standard error of the mean. *P < .05, **P < .01, ***P < .001.
MiR-384 Plays a Role in Tumor Suppression by Regulating IGFBP3 in Osteosarcoma
Later, we tried to explore the mechanism through which miR-384 regulated OS. Insulin-like growth factor binding protein 3 is a newly discovered molecule that plays a role of tumor suppression in a variety of tumors. We wonder if it has some concern with the expression of miR-384.
We used bioinformatics analysis to find the direct target of miR-384. RNA-seq technology was used to detect the difference in expression of genes at the RNA level before and after transfection of G292 cells. It was found that the upregulation multiples of IGFBP3, ING5, and CDKN2C were the highest double adjustment, and they were all related to tumor proliferation pathway by KEGG pathway enrichment analysis (Figure 4A). To further investigate the underlying molecular mechanism of miR-384 modulated growth and metastasis suppression in OS, we applied bioinformatics tools “TRRUST” (http://www.grnpedia.org/) to discover the transcription factors of IGFBP3. The prediction analysis results indicated that MECP2 may be a potential transcription factors of IGFBP3 (Figure 4B). Therefore, the 3′UTR and MUT 3′UTR of MECP2 gene were cloned and inserted into a luciferase reporter vector separately, and the luciferase activity of the reporter plasmid containing WT MECP2 3′UTR was significantly suppressed while there were no obvious inhibition effects on that of the mutant MECP2 30′UTR in both G292 and Saos-2 cells (Figure 4C). We used PCR (Figure 4D and E) and WB (Figure 4F and G) to simultaneously detect the expression of MECP2 and IGFBP3 in OS cells after overexpression and knockdown of miR-384, respectively. It was found that there was a positive correlation between the expression of IGFBP3 and miR-384, and IGFBP3 decreased with the silence of miR-384, but MECP2 turned out to be the opposite.
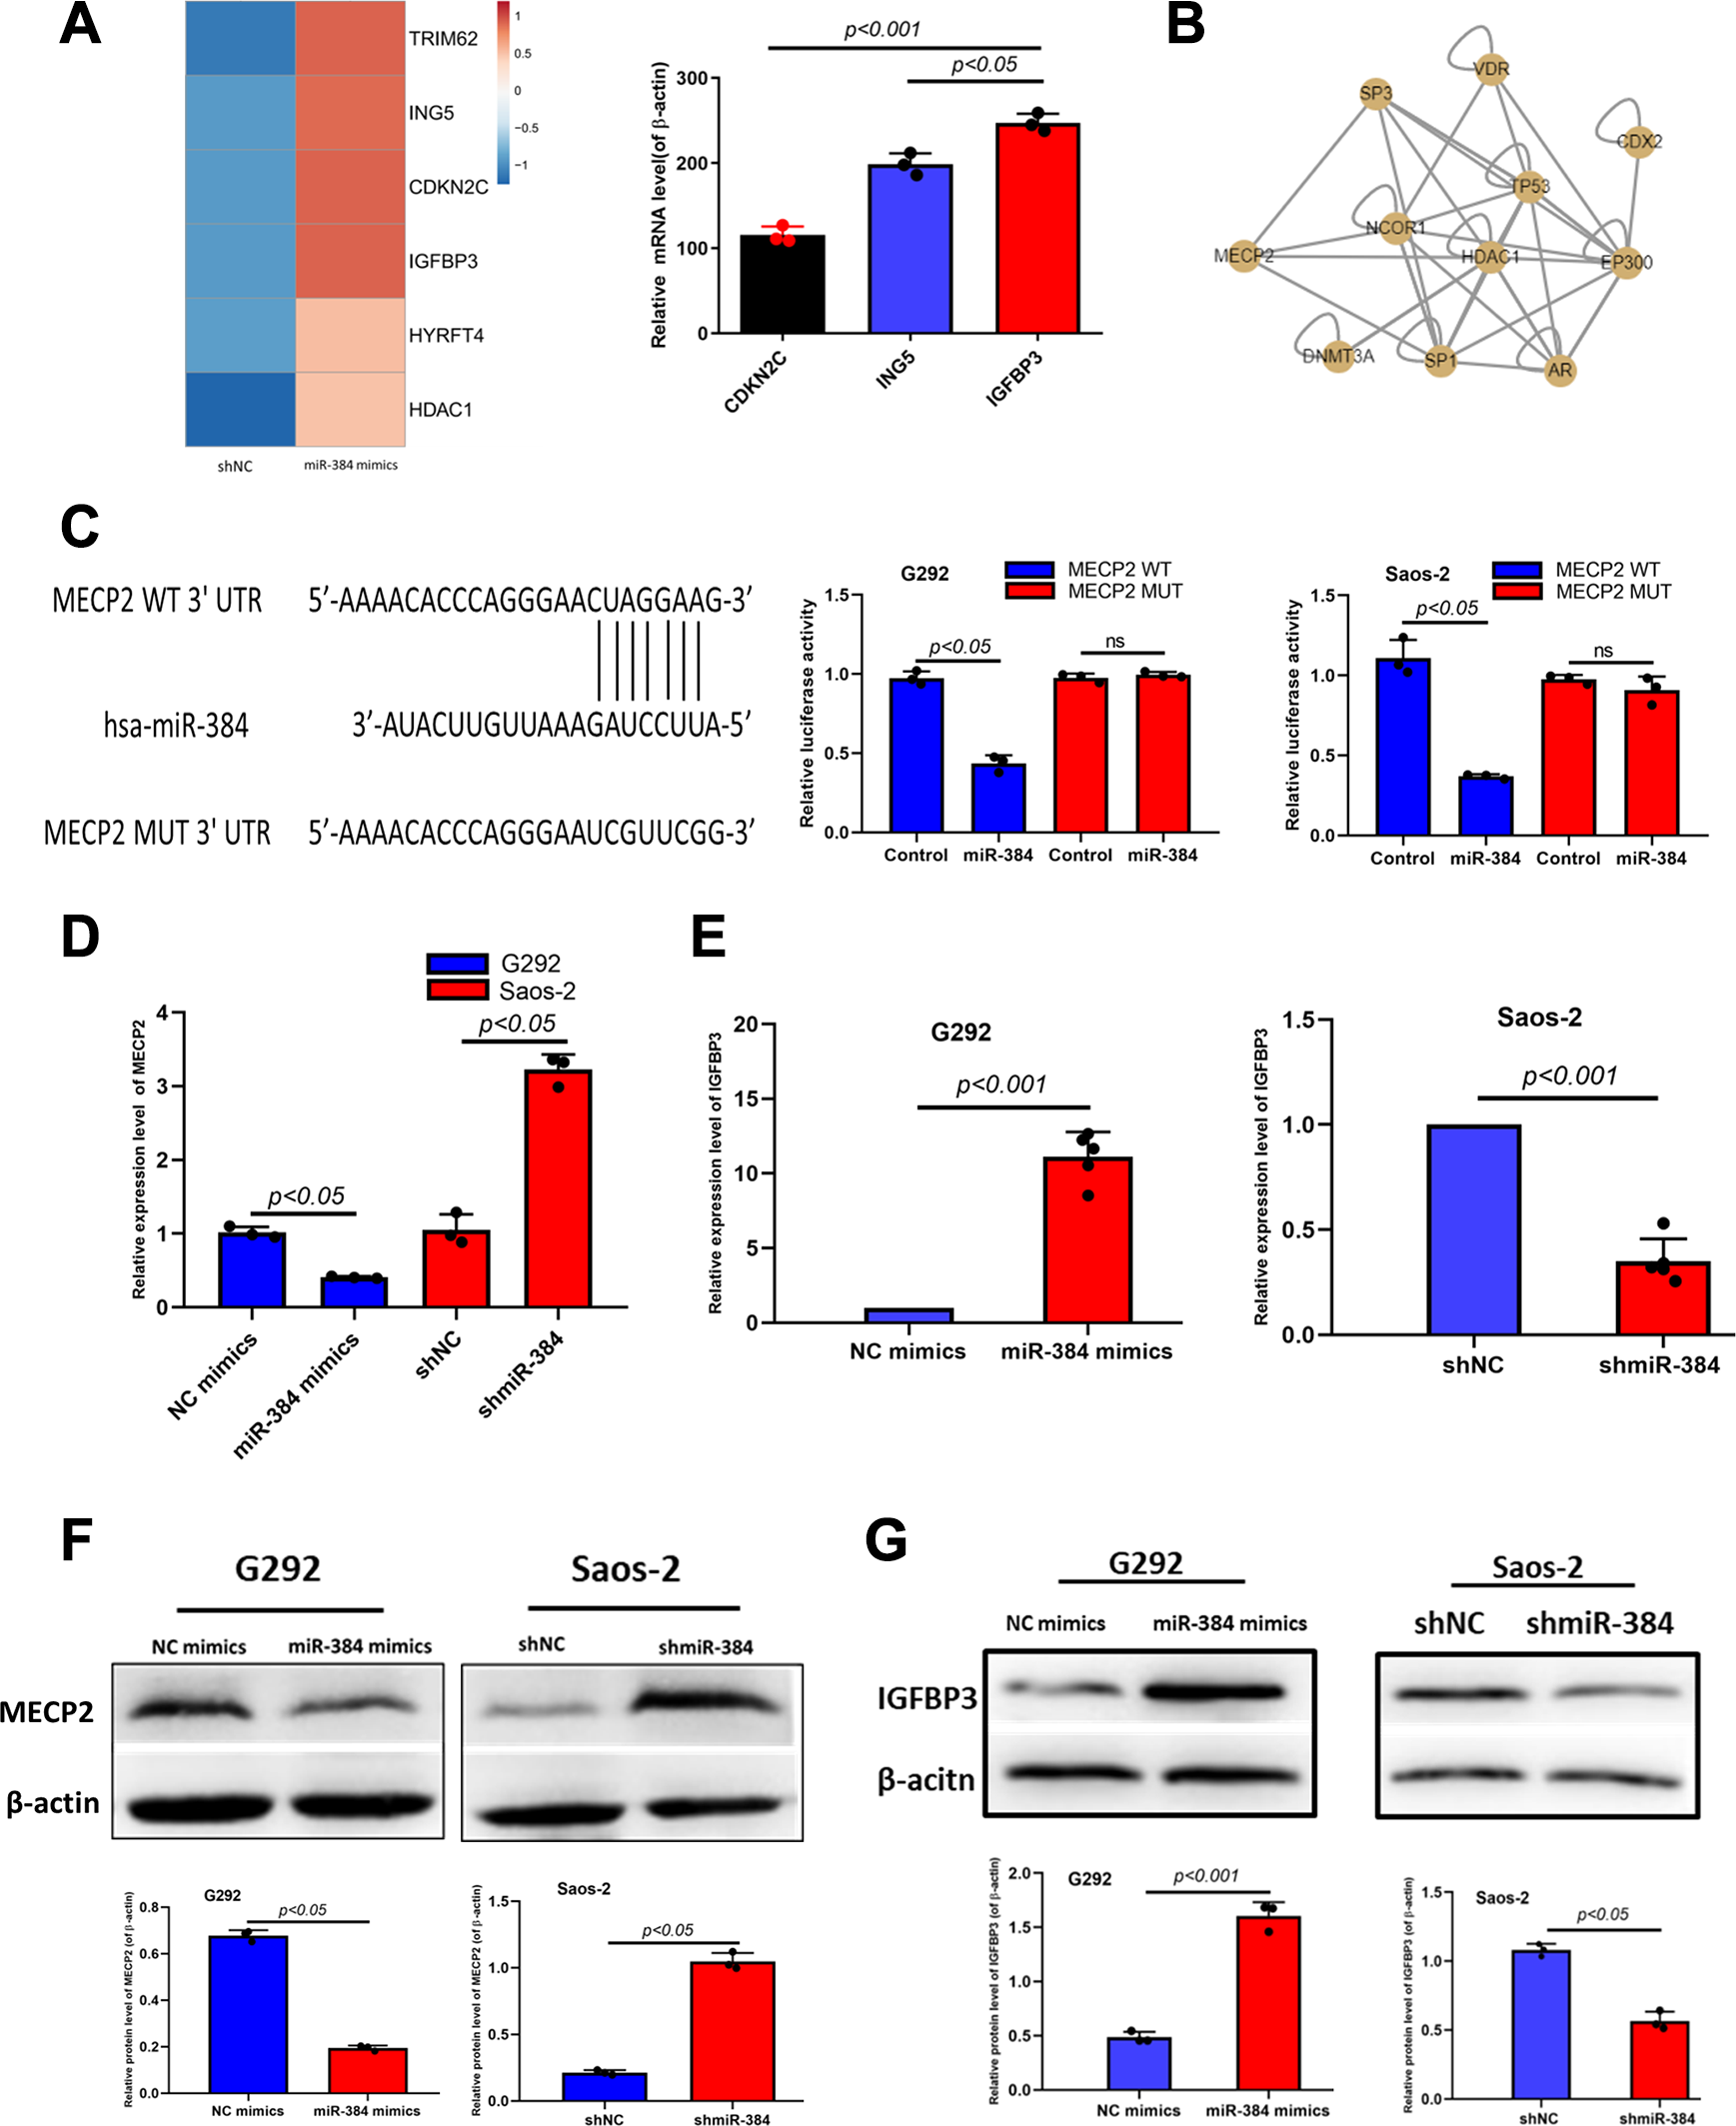
MiR-384 regulates the expression of IGFBP3. A, RNA-seq detected the expression of different genes in miR-384 mimics was transfected into G292 cells. B, TRRUST predicts upstream transcriptional regulators of IGFBP3. C, miR-384 binding site in MECP2 3′UTR predicted by bioinformatics tool “Targetscan.” Dual-luciferase reporter assay showed that miR-384 reduced luciferase activity of G292 and Saos-2 cells transfected with MECP2 30′UTR WT plasmids. D and E, The expression levels of IGFBP3 and MECP2 were examined by qPCR after shmiR-384 and miR-384 mimics transfection. F and G, The expression levels of IGFBP3 and MECP2 protein were examined by Western blot after shmiR-384 and miR-384 mimics transfection. The data are expressed as the mean ± standard error of the mean. *P < .05, **P < .01, ***P < .001. IGFBP3, insulin-like growth factor binding protein; qPCR, quantitative polymerase chain reaction; 3; UTR, untranslated region.
Expression of IGFBP3 in OS Is Consistent With MiR-384
We used PCR and immunohistochemistry to simultaneously detect the expression of IGFBP3 in OS tissues and cells, respectively. It was found that there was a positive correlation between the expression of IGFBP3 and miR-384, both in vivo and in vitro (Figure 5A-C). In the same way, we verified that IGFBP3 was expressed in different OS tissues and found that it showed a similar effect to miR-384 (Figure 5D and E).

IGFBP3 expression in osteosarcoma is consistent with miR-384. A, IGFBP3 mRNA expression levels in MG63, Saos-2, G292, and U20 S osteosarcoma cells. B, The expression level of IGFBP3 was significantly lower in the tumor tissue than in normal tissue as detected by real-time PCR. C, The expression level of IGFBP3 was significantly lower in the tumor tissue than in normal tissue as detected by IHC. D, The expression level of IGFBP3 was significantly lower in the I to II tumor tissue than in the III to IV tumor tissue. E, The expression level of IGFBP3 was significantly lower in the metastasis tumor tissue than in the nonmetastasis tumor tissue. The data are expressed as the mean ± standard error of the mean. *P < 0.05, **P < .01, ***P < .001. IGFBP3 indicates insulin-like growth factor binding protein 3; IHC, immunohistochemical; PCR, polymerase chain reaction.
Discussion
Osteosarcoma has become a heavy burden in all countries of the world, with an estimated annual incidence of 4 million worldwide. 1 Several studies have shown that miRNA plays a key role in the development of OS, indicating a promising strategy for this disease. 2 In this study, we found that miR-384 was significantly less expressed in OS tissues and cell lines. 11 Overexpression of miR-384 significantly inhibited proliferation, invasion, and migration of OS cells, 12 but inhibition of miR-384 had the opposite effect. 13 Our data suggest that miR-384 may play a tumor suppressor role in OS by regulating IGFBP3.
According to previous studies, miR-384 was found to be abnormally expressed in several tumors. MiR-384 can inhibit tumor cell proliferation and invasion in tumor tissues such as gastric cancer, colon cancer, and liver cancer. 14,15 Zhang et al 16 revealed that miR-384 is a tumor suppressor in OS by targeting SETD8. 5 Wang et al 6 showed that knocking down miR-384 promotes growth and metastasis of OS MG63 cells by targeting SLBP. In addition, miR-384 is involved in the phenotypic properties of cancer cells, such as cell proliferation, apoptosis, and cell cycle, and plays a vital role in the expression of gene products. 17 In lung cancer–related studies, miR-384 promotes the tumor suppressor gene IGFBP1. 18,19 These results highlight the potential role of miR-384 in tumorigenesis or progression. Then, we want to know whether miR-384 plays a similar role in OS. Our in vitro experiments confirm our hypothesis.
To explore the potential mechanism of miR-384 inhibiting the proliferation and metastasis of OS is very important for cancer-specific identification of miRNA and its target genes. Functionally, we validated through gain-of-function and loss-of-function assays that miR-384 decreased cell proliferation and invasion in OS. In vitro experiments showed that overexpression of miR-384 inhibited the proliferation, clonality, and invasion of OS cells. At the same time, miR-384 can affect the EMT marker proteins in OS, which can promote the expression of E-cadherin and inhibit the expression of N-cadherin and Snail.
We performed bioinformatic analysis and found that IGFBP3 was a target of miR-384. An IGFBP3 can inhibit intestinal metastasis of gastric cancer and improve the prognosis of patients with gastric cancer. 20 Through the bioinformatics database, we found that the upstream transcriptional regulator of IGFBP3 is MECP2. At the same time, we found that miR-384 can directly inhibit MECP2 and then promote the expression of IGFBP3. Our study found that the expression of IGFBP3 in OS was significantly related to miR-384, and IGFBP3 showed the same trend as the expression of miR-384 changes. The IGFBP3 is not only at the cellular level but also shows the same expression trend in OS tumor tissues. Its expression in tumor tissues is lower than that in normal tissues, and its expression in metastatic tumor tissues is lower than that in nonmetastatic tumor tissues.
These evidences indicate that miR-384 acts as a tumor suppressor gene in OS. It can jointly inhibit the malignant biological behavior of OS by influencing IGFBP3. This indicates that miR-384 has a certain relationship with IGFBP3 at both the cellular and tissue levels, and the specific regulatory mechanism between the 2 will be the focus of our next study.
Footnotes
Authors’ Note
The method and purpose of the experiment were to inform the patient and family members, and signed the informed consent form, and the study was approved by the Angang General Hospital ethics committee.
Declaration of Conflicting Interests
The author(s) declared no potential conflicts of interest with respect to the research, authorship, and/or publication of this article.
Funding
The author(s) received no financial support for the research, authorship, and/or publication of this article.