
Abstract
Purpose
The objective of the in vitro study was to assess the effect accelerated artificial aging, bleaching agents and coffee staining on the color, gloss, roughness and microhardness of a nanocomposite.
Materials and Methods
120 (7 × 2 mm) were prepared and randomly divided into 2 groups (n = 60) depending on the aging. Each group was further subdivided into 6 subgroups (n = 10) according to the bleaching and staining as follows: 10% carbamide peroxide (10% CP), 10% CP + staining, 35% hydrogen peroxide (35% HP), 35% HP + staining, without bleaching treatment (WB) and WB + staining. Scanning electron microscopy was performed for qualitative analysis of the resin surface. Data were submitted to 3-way analysis of variance (ANOVA) and Tukey's test for multiple comparisons. As for ∆E, multiple comparisons were performed by using Tukey's and Dunnett's tests (α = 0.05).
Results
The bleaching reduced significantly the microhardness of the nanocomposite in without aging groups. All physical properties were found to be negatively changed after the aging process, with bleaching treatment with 10% CP increasing significantly the roughness and loss of gloss compared to the 35% HP. Staining reduced microhardness of both with and without aging nanocomposite as well as the color of the former (E>25), a significantly different result compared to controls.
Conclusions
The bleaching reduced the microhardness of the nanocomposite, whereas the aging process changed all the properties studied. The bleaching favored extrinsic staining of the with aging nanocomposite.
Introduction
The use of esthetic restorative materials such as composite resins has increased as a result of technological developments in their composition. New properties allow restorations to be made with characteristics increasingly similar to those of the natural tooth (1, 2). The esthetical of restorative materials is related to their optical properties (3), although longevity is a limiting factor.
The staining of restorative materials is one of the main alterations compromising their esthetics (4, 5), thus being one of the most relevant causes for replacement of restorations (6). It is known that the color of composite resins can be altered due to intrinsic factors resulting from physical-chemical reactions unleashed within the material. This is dependent on matrix composition, type and size of the load particles, photo-initiator, and degree of conversion (7). In addition, extrinsic factors also affect the color through absorption and adsorption of dyes as a result of external surface contamination from food (4, 5).
With regard to the surface characteristics of the composite resin, one can highlight gloss and roughness, which are properties directly related to the composition of resin-based materials – mainly the type of load particle and the amount of organic matrix (8). The nanoparticulate resins can bring advantages because they possess low roughness and consequently more gloss (9, 10). In addition, small load particles allow a large amount of them to be inserted into the composite, thus providing better mechanical properties (11). This gives better esthetic results to this material and more longevity to the restorative treatment (9).
Composite resins can have changes in their properties as a result of the action of chemical agents, such as bleaching gels (12). Some studies show that these agents can interfere with the physical-chemical properties of composite resins. Due to an increase in roughness and changes in color and microhardness, these can be translated into alterations in the surface morphology (12, 13). Others disagree with the cause of such alterations (14–15–16). In any case, whether these changes are more evident in aged composites is a reasonable question, since the penetration of bleaching gel can be more favored by alterations in the composites over time. Given that possible changes in the surface of the composite can allow extrinsic pigments to be accumulated, thus compromising the longevity of the restoration, studies on the inevitable contact between bleaching agents and restorative materials need to be conducted.
The objective of this in vitro study was thus to assess the effect of accelerated artificial aging, bleaching treatment, and staining agents on the color, gloss, roughness and microhardness of a nanocomposite resin.
Materials and Methods
Specimen preparation
One hundred and twenty cylindrical samples containing nanocomposite resin (Filtek Z350 XT®; 3M/ESPE), measuring 7.0 mm in diameter and 2.0 mm in thickness, were prepared. The composite resin was inserted into the silicone matrix (Elite HD + normal setting©; Zermack) in 1 increment. Next, the increment was covered with polyester strip and a glass slide under a 500-g weight during 30 seconds. The specimens were light-cured with a light emitting diode (LED) (Valo; Ultradent Products) at irradiance of 817 mW/cm2 for 20 seconds, previously calculated by measuring the power of light source (mW) with a powermeter (Ophir Laser Measurement).
All the specimens were stored for 24 hours at 37°C and 100% relative humidity before being submitted to the polishing process by using a polishing machine (APL-4; Arotec). The top surface of each specimen was polished for 1 minute with grit silicon carbide sandpaper discs (CARBIMET Paper Discs; Buehler) and felt (TOP, RAM E SUPRA; Arotec) in association with diamond pastes, which were also used to finish the polishing process. At the interval between each polishing process, the specimens were cleaned for 5 minutes with deionized water in an ultrasonic bath (ultra clearer USC-1450A/ Frequency 25 kHz; UNIQUE) for removal of debris.
The specimens were randomly divided into 2 groups (n = 60) according to the aging procedure. Each group was subdivided into 6 subgroups (n = 10) according to the bleaching treatment and staining agent (Fig. 1 and Tab. I).
Composition, manufacturer, lot and ph value of the materials used in the study
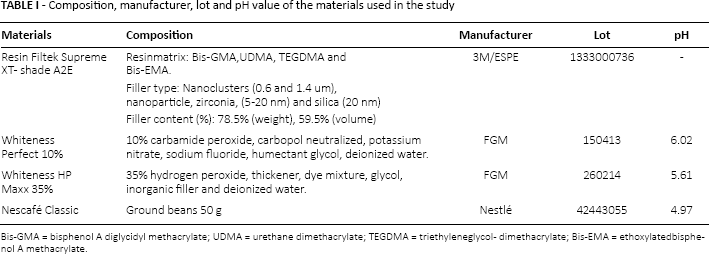
Bis-GMA = bisphenol A diglycidyl methacrylate; UDMA = urethane dimethacrylate; TEGDMA = triethyleneglycol- dimethacrylate; Bis-EMA = ethoxylatedbisphenol A methacrylate.
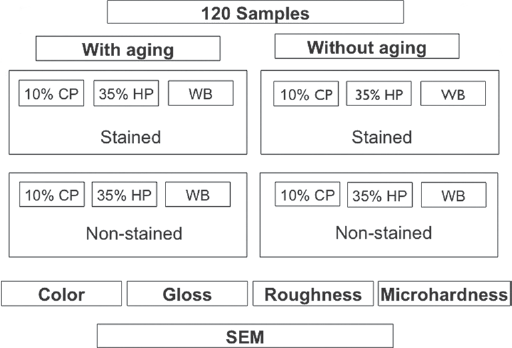
Experimental design and presentation of the study groups and performed analyses.
Aging procedure
The accelerated artificial aging (AAA) was performed in an EQ-UV natural weathering device (Equilam) operating at total energy of 389.2 kJ/m2 for exposure of the specimens to controlled ultraviolet (UV) light radiation, which was emitted from a xenon light source at irradiance of 0.71 W/cm2 and wavelength of 310 nm. The cycles consisted of 4-hour exposure to UV-B light and 4-hour condensation for a 300-hour period at constant temperature of 50°C (17).
Bleaching procedure
The bleaching treatments were performed according to the manufacturer's instructions and the following protocols:
After each application, the gel was removed from the surface of the samples using plastic cotton swabs (Cotonetes; Johnson & Johnson). Next, the samples were abundantly washed with running water for 1 minute, dried with absorbing paper, and stored at 100% relative humidity and temperature of 37°C ± 2.
To evaluate the influence of pH on the bleaching gels on the surface of the specimens, they were measured in duplicate by using a digital pH-meter (Procyon) for approximately 3 g of each gel (Tab. I).
Artificial staining
The specimens submitted to extrinsic staining had their surfaces (bottom and lateral) covered with sticky wax (Asfer Industria Química) so that only the top surface was exposed to the staining solution. The specimens were stained with coffee solution on a daily basis by dissolving 3.6 g of coffee (Café Nescafé Classic) into 300 mL of boiled distilled water. After 10 minutes of manipulation, the samples were stored in this solution for 7 days and kept in oven at 37°C ± 2, simulating the temperature of the oral cavity. At each replacement, the samples were abundantly washed with running water for 5 minutes and then dried with absorbing paper before color analysis. Coffee pH was measured using the same method as the bleaching gel, with approximately 30 mL of solution (Tab. I).
The samples receiving no treatment and those submitted to the bleaching and/or aging process were stored at 100% relative humidity and temperature of 37°C ± 2 throughout the whole experiment.
Color measurement
At the end of all treatments the specimens were placed on a Teflon device (sample holder) inside a light cabin (GTI mini matcher MM1e; GTI Graphic Technology) to standardize the ambient light during the measurement process. The specimens were submitted to color reading using a spectrophotometer (Konica Minolta CM-700d; Konica Minolta Investment). The values obtained were quantified by using the CIE Lab system as 3 coordinates: L* (luminosity, from 0 = black to 100 = white), a* (from axis -a = green to axis +a = red), and b* (from axis -b = blue to axis +b = yellow). These coordinates define the color of an object within a 3-D color space through the On Color QC Lite software (Konica Minolta, Japan). Calculation of E was obtained with the following formula: ΔE = [(L1 - L0)2 + (a1 - a0)2 + (b1 - b0)2]1/2. The values of the nonaged, and nonbleached groups were considered as baseline (L0, a0 and b0) for comparison with the other groups.
Surface gloss measurement
A ZGM 1120 glossmeter (Zehntner Testing Instruments) was used, projecting a light beam onto the specimen surface at a 60° angle (ISO-Standards, ISSO 2813), which allows the mean gloss to be evaluated. Four measurements were made, corresponding to each quadrant of the specimen. The mean reading was recorded as a unit of gloss.
Surface roughness measurement
The surface roughness was evaluated by using a rugosimeter (SV-3100S4; Mitutoyo), which was properly calibrated for reading in accordance with the ANSI requirements and equipped with a diamond tip (0.5-µm radius). The readings were performed as follows: the first one at 180o, the second one at 135°, and the third one at 90°. The mean value of the 3 readings was considered as the final mean roughness value (Ra).
Microhardness analysis
The Knoop microhardness (KHN) of the specimen was determined by using a microhardness tester (HMV-2000; Shimadzu) with a diamond indentator applied under a 50-g load for 15 seconds, with the first indentation being centrally made and the other 4 ones at a distance of 200 µm from the center.
Surface topography
The specimens were coated with gold alloy and photomicrographs of representative areas were taken at magnification of 1000x by means of a scanning electron microscope (SEM) (SM 5600 LV; JEOL).
Statistical analysis
After exploratory data analysis, the variable E was submitted to analysis of variance (ANOVA) on a factorial basis, with multiple comparisons being performed with Tukey's test and additional treatment with Dunnett's tests. Three-way ANOVA and Tukey's test were used for the other variables (i.e., gloss, roughness, and microhardness). Significance level was set at 5% in all analyses.
Results
Color (ΔE)
In Table II, all the aged specimens had higher mean values of ΔE, regardless of bleaching treatment and staining, differing statistically from the nonaged ones (p≤0.05). When different bleaching treatments were compared regarding aging and staining, the groups treated with 10% CP and 35% HP had higher mean values, thus differing statistically from the nonbleached group but not between each other (p≤0.05). In the aged specimens with no staining, groups treated with 10% CP and 35% HP had lower mean values, differing statistically from the nonbleached group but not between each other (p≤0.05). When staining was evaluated in the aged specimens, all the stained groups were found to have higher mean values of ΔE compared to the nonstained groups under the same conditions of aging and treatment (p≤0.05). In the nonaged specimens with staining, groups treated with 10% CP and 35% HP differed statistically between each other compared to control (p≤0.05), although this result was observed neither in the nonaged group nor in the nonstained group as both did not differ from each other (p≥0.05). When staining was evaluated in the nonaged groups, the stained specimens had higher mean values of ΔE compared to the nonstained groups under the same conditions of aging and treatment (p≤0.05).
Mean (standard deviation) of ∆E as a function of the treatment, pigmentation and aging
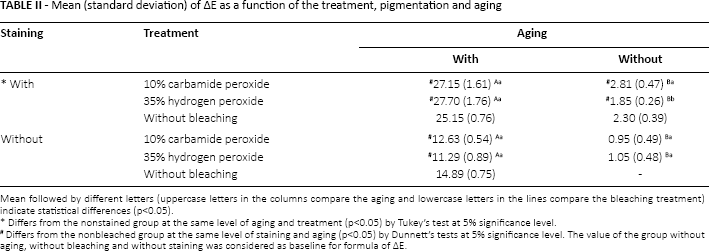
Mean followed by different letters (uppercase letters in the columns compare the aging and lowercase letters in the lines compare the bleaching treatment) indicate statistical differences (p<0.05).
Differs from the nonstained group at the same level of aging and treatment (p<0.05) by Tukey's test at 5% significance level.
Differs from the nonbleached group at the same level of staining and aging (p<0.05) by Dunnett's tests at 5% significance level. The value of the group without aging, without bleaching and without staining was considered as baseline for formula of ∆E.
Gloss (GU)
In Figure 2, one can observe significant differences in the comparison between all treatments with and without aging (p≤0.05). The aged groups showed the lowest values of gloss, regardless of bleaching treatment and staining, compared to the nonaged groups. In the comparison of treatments for aged groups only, stained and nonstained, the groups treated with 10% CP had lower values of gloss, differing statistically from the groups treated with 35% HP and those with no bleaching (p≤0.05), with the latter presenting no differences between each other (p≥0.05). However, when staining was evaluated in the aged groups, all stained specimens differed from the nonstained ones under the same conditions of aging and treatment, presenting higher values of gloss (p≤0.05). By comparing the different bleaching treatments in the nonaged groups, stained and nonstained, no statistically significant difference was found (p≥0.05).
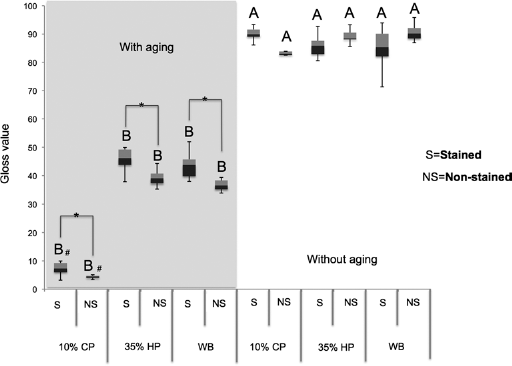
Box-plot graph showing gloss values. Values followed by different letters differ among them. # Differs from other bleaching treatments at the same level of staining and aging (p<0.05). Bar of connection with one-half asterisk indicates statistical difference from nonstained group at the same conditions of aging and bleaching (p<0.05). Tukey's tests at 5% significance level. CP = 10% carbamide peroxide; HP = 35% hydrogen peroxide; WB = without bleaching.
Roughness (Ra)
In Figure 3, one can observed that there were statistical differences between the different treatments with and without aging (p≥0.05). The aged groups had higher values of roughness, regardless of bleaching treatment and staining, compared to the nonaged groups. In the comparison between treatments for aged specimens, stained and nonstained, groups treated with 10% CP had higher values of roughness compared to those treated with 35% HP, with both being statistically different between each other and from nonbleached groups. However, when pigmentation was evaluated in these groups, all stained specimens differed from the nonstained ones under the same conditions of aging and treatment (p≤0.05). As for the nonaged groups, no statistically significant differences were found between the different bleaching treatments, regardless of staining (p≥0.05).
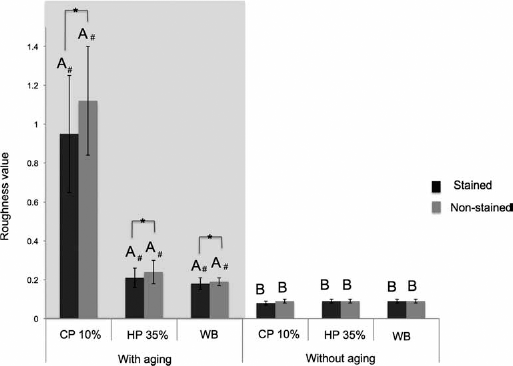
Bar graph showing rugosity values. Values followed by different letters differ among them. # Differs from other bleaching treatments at the same level of staining and aging (p<0.05). Bar of connection with one-half asterisk indicates statistical difference from nonstained group at the same conditions of aging and bleaching (p<0.05). Tukey's tests at 5% significance level. CP = 10% carbamide peroxide; HP = 35% hydrogen peroxide; WB = without bleaching.
Knoop microhardness (KHN)
In Figure 4, significant differences were found between all treatments for both aged and nonaged specimens (p≤0.05). Aged groups had lower values of microhardness compared to the nonaged groups, regardless of bleaching treatment and staining.
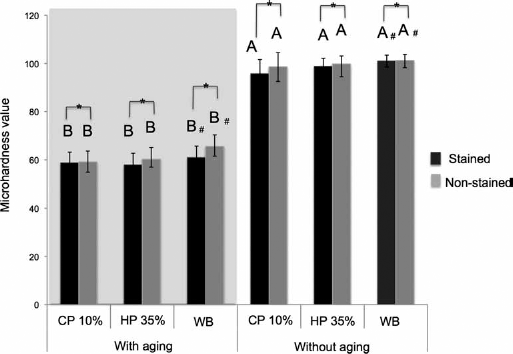
Bar graph showing microhardness values. Values followed by different letters differ among them. # Differs from other bleaching treatments at the same level of staining and aging (p<.05). Bar of connection with one-half asterisk indicates statistical difference from nonstained group at the same conditions of aging and bleaching (p<.05). Tukey's tests at 5% significance level. CP = 10% carbamide peroxide; HP = 35% hydrogen peroxide; WB = without bleaching.
When different treatments were assessed in the aged groups, those treated with 10% CP and 35% HP had lower values of microhardness compared to the nonbleached group, regardless of the staining. This finding, however, was not observed in the nonaged groups.
As for the staining factor, the evaluation of aged groups showed that all stained groups differed from the nonstained ones as the former had lower values of microhardness, regardless of the bleaching treatment, under the same conditions of aging and treatment. In the nonaged groups, all the stained groups also differed from the nonstained ones as the former had lower values of microhardness, regardless of the bleaching treatment used.
Scanning electron microscope (SEM)
Photomicrographs of the surfaces of the composite resins with 300 hours under AAA showed morphological alterations compared to the nonaged groups (Figs. 5 and 6).
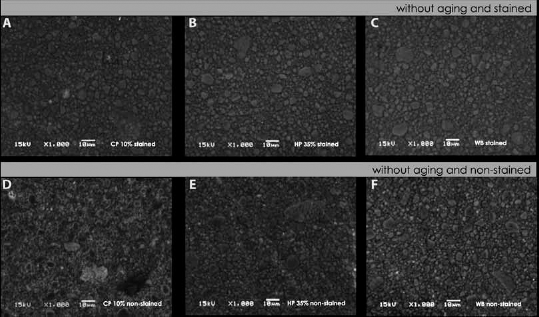
SEM observation of composite resin surfaces without aging and treatments:
(
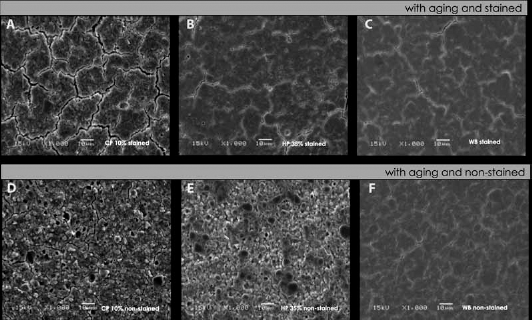
SEM observation of composite resin surfaces with aging and treatments:
(
In the nonaged and nonstained groups, only those treated with 10% CP had a slight loss of organic matrix (Fig. 5D), differing from the groups treated with 35% HP and without treatment (Fig. 5e, F). The nonaged groups and the stained ones had no significant difference between each other (Fig. 5A, B and C).
Aged groups without staining treated with 35% HP and 10% CP had a clear loss of organic matrix as load particles were exposed and there was presence of cracks (Fig. 6E, F) compared to the aged groups without bleaching treatment (Fig. 6F). When these groups (Fig. 6E, D) are compared to each other, one can observe that the treatment with 10% CP resulted in a more degraded surface of the organic matrix and enhanced exposure of load particles, which was characterized by the presence of pores and numerous cracks (Fig. 6D).
The surface of aged and stained samples treated with 35% HP and 10% CP also exhibited presence of cracks (Fig. 6A, B) compared to the aged group without staining (Fig. 6C). The comparison between stained groups treated with 35% HP and 10% CP showed again that the latter treatment resulted in a greater amount of cracks, which let the surface totally with a cracked appearance (Fig. 6A).
Discussion
The action of bleaching at different concentrations, aging and staining on the physical properties of a nanocomposite evaluated in the present study has showed that 10% CP and 35% HP decreased the microhardness of the composite resin compared to controls (without bleaching samples). This probably occurred because hydrogen peroxide is capable of generating free radicals, which can lead to degradation of the polymer chain of the resin and rupture of the load particles/matrix bond. This alteration can favor the loss of particles and water absorption, thus reducing both surface integrity and microhardness of the composite resin (18, 19).
After AAA by means of exposure to UV light and condensation, the samples were found to have lower values of microhardness in all groups compared to the nonaged resins. In the present study, AAA was aimed to check changes occurring over time in the restorative material and the influence of bleaching gels in these composites. The results show evidence that aging caused plastification of the polymer. This process occurs when water penetrates into the matrix structure or load particules/matrix interface, which promotes relaxation or softening of the bonds and consequent decrease of microhardness (20).
It was observed that in the bleaching treatment with 10% CP and 35% HP, the aged and bleached resins had even lower values of microhardness compared to the nonbleached ones. This finding shows that under various physical-chemical conditions, bleaching can promote greater degradation and favor a deeper penetration of the bleaching agent through the microfractures in the restorations (12, 21) and therefore reduce the microhardness of the material.
In the present study, the influence of staining solutions on composites was also evaluated after bleaching and/or AAA. Coffee was chosen as staining solution because it was demonstrated that this substance has a high capacity of staining the composite resin (22). The results showed that coffee staining reduced the microhardness in all groups with both aged and nonaged samples, regardless of the bleaching treatment. This alteration can be attributed to the composition of resin matrix and its susceptibility to the softening caused by low-pH beverages, which promotes erosion and dissolution of the surface components of the resin, in addition to facilitating leaching of the components and their structure (23). As coffee had a pH of 4.97 and resin matrix has hydrophobic characteristics, the reduction of the surface microhardness could be explained.
With regard to the surface roughness and gloss, no statistically significant difference was found in the different bleaching treatments. This result is attributed to the characteristics of the polymer formed. Nanocomposite resins have agglomerates or “nanoclusters”, which allows a greater amount of load particles to be inserted into the polymer on a uniformly distributed basis. This minimizes the formation of areas with greater amount of organic matrix. The influence of bleaching on composite resins is decreased by the fact that resin matrix is more susceptible to both water absorption and chemical products (24) Therefore, the action of hydrogen peroxide was not able to affect significantly the surface of these composite resins. Moreover, the formation of clusters allows resins to be eroded and not necessarily removed during the polishing process, thus favoring better polishing (25) and excellent gloss.
After AAA, it was possible to observe a decrease in gloss values and increase in roughness values compared to the nonaged samples. Paravina and colleagues (26) reported that chemical degradation and increase in surface roughness are changes seen following AAA, making the surface texture of the composite irregular, which directly affects the gloss. Therefore, the greater the surface roughness, the higher the degree of diffuse reflection, thus affecting negatively the gloss (27). The type of bleaching treatment influenced negatively both roughness and gloss of the aged resins. The group treated with 10% CP had a higher value of roughness and a more significant reduction in gloss compared to the groups treated with 35% HP. This result can be attributed to the composition of the bleaching agent used, since 10% CP has carbopol in its formulation, which is a thickener characterized by high ionic potential. This thickener can react with the components of the polymer matrix, such as the monomer bisphenol A-glycidyl methacrylate (Bis-GMA), and intensify the surface degradation. This monomer is highly susceptible to chemical softening because of its high levels of solubility, which might explain the result found here (28).
The at-home bleaching technique and type of polymer matrix formed can have influenced the changes in the composite resin. Malkondu and colleagues (29) stated that degradation of the composite by bleaching agent depends on the penetration depth of the hydrogen peroxide into the restorative material. However, composites with reticulated chains formed from high-molecular-weight monomers (UDMA and Bis-EMA) make penetration of the bleaching agent difficult, thus being necessary a longer time for its diffusion into the material. This may have contributed to the reduction in gloss and increase in roughness found in aged resins treated with 10% CP, since at-home treatment allows longer exposure of gel to the resin as well as a daily application regimen.
Evaluation of the staining in aged samples has shown lower values of roughness, regardless of the bleaching treatment used. This result probably occurred because coffee particles filled the irregularities formed by AAA, making the surface a little smoother, thus improving light reflection and also resulting in higher values of gloss. This was corroborated by the results found by Reis and colleagues (30) and Azer and colleagues (31), who reported that in rough surfaces resulting from degradation there is an increase in the surface area for adsorption of pigments, thus leading to more staining. On the other hand, no significant changes were found in the aged samples regarding roughness and gloss. This happens due to the fact that the pigment cannot adhere to a smooth surface to allow its absorption into the resin matrix, thus causing the staining.
For evaluation of the color change (∆E), it is accepted that color variation in composite resins is imperceptible to human eyes for ∆E∆<1 clinically acceptable for 1<∆E<3.3, and clinically unacceptable for ∆E≥3.3. In the latter case, replacement of the material is recommended (32). In the present study, the bleaching gels tested (10% CP and 35% HP) were not able to modify the color of the nonaged resins (∆E<2).
After being submitted to AAA, the specimens were found to have significant changes in color (∆E = 14), being clinically unacceptable. The presence of light can unleash physical-chemical reactions in the composite resin, such as oxidation of monomers, which did not react, and amines. According to Janda and colleagues (4), who used photo-initiator systems, there are tertiary aromatic (or aliphatic) amines which act like accelerators. All amines are known to form by-products during the polymerization reaction, which tend to produce a yellow-brown-reddish color under the influence of light or heat. The monomers TEGDMA and Bis-GMA, which are present in the composite resin studied, are more likely to absorb water (20, 33). Consequently, the presence of water leads to alterations in dispersion and absorption of light, which in turn interferes with light reflection and resin translucency (34). Taken all together, these factors can explain the color variation in the composite resin used.
When the aged specimens were bleached, it was found that there was a reduction in the values of ∆E. This finding showed that surface degradation promoted a color change in the composite resin (∆E>12). The mechanism involved in the color change following exposure to bleaching agents is related to oxidation of pigments existing in the surface, oxidation of amines accounting for color stability over time, or breakdown of the resin matrix through leaching of monomers (35, 36). All these can explain the color change.
The nonaged resins with staning showed ∆E<3, regardless of the bleaching agent used. This change in color is clinically acceptable. The nanocomposite resin is composed by very small load particles, which allows a greater amount of load particles to be inserted and better distribution within the resin matrix. This fact allows no greater staining as the proportion of areas filled with only resin matrix is decreased (26), preventing a absorption of pigments, as described earlier. The surface smoothness of the composite resin decreases the retention of pigments. On the other hand, aged specimens with staining showed the greatest variations in color, with ∆E>25. This variation is highly perceptible and clinically inacceptable. The degradation promoted by AAA and bleaching agents favored the increase in roughness due to the loss of organic matrix, mainly load particles, thus exposing larger areas of organic matrix and making the resin more susceptible to absorption of water and pigments (37).
Changes in the surface of the composite resin were observed by using SEM. The nonaged specimens with staining treated with different bleaching exhibited smooth, uniform surface and absence of pore, fissures or cracks (Fig. 5). Janus and colleagues (38) reported that nanocomposite resins have a surface completely filled with rounded load particles, grouped and organized in a polymer matrix. Therefore, these characteristics decrease the susceptibility to the effects of both bleaching and staining agents (Fig. 5B, C, E, F). Only the group treated with 10% CP (Fig. 5D) had a slight loss of organic matrix as it was possible to observe a greater exposure of load particles.
Matrix degradation is characterized by the exposure of load particles as a result of the rupture of chemical bonds within the polymer. Therefore, these changes promote alterations in the composite resin by the increase in the number of pores, loss of particles or removal of clusters. In the aged groups bleached with 10% CP and 35% HP, it was possible to observe such characteristics (Fig. 6D, E). After the staining, the surface of the resin was found to be smoother despite the countless cracks. This probably occurred because the surface may have been filled with pigments from coffee (Fig. 6A, B).
The presence of cracks following AAA is reported in the literature (39) (Fig. 6C, F), and an increase in this occurrence was found following bleaching treatments (Fig. 6D, E). Wattanapayungkul and colleagues (18) observed that the surface of a methacrylate-based composite resin exhibited numerous cracks and pits after a 2-week treatment with 10% CP, with a significant increase in roughness. The authors attribute this finding to water penetration and hydroscopic expansion of the composite resin. Moreover, they report that the high oxidant capacity of the hydrogen peroxide due to formation of free radicals affect the interface matrix-particles as well as the polymer chains of the matrix, resulting in a greater propagation of cracks. In the present study, the groups treated with 10% CP showed greater propagation and expansion of these cracks after staining, thus letting the surface with a cracked appearance (Fig. 6A).
The long-term maintenance of the esthetical characteristics is desirable in direct restorative procedures. In this manner, the aging of the material in association with the action of bleaching and staining agents can compromise the treatment for esthetical rehabilitation with nanocomposites.
Conclusions
The results have shown that 10% carbamide peroxide caused the highest changes in the physical properties of the nanocomposites compared to 35% hydrogen peroxide. AAA promoted greater degradation of the composite by the bleaching agent, thus contributing to more extensive extrinsic staining.
Footnotes
Financial support: The authors would like to thank the Coordination for the Improvement of Higher Education Personnel (CAPES) for the scholarship grants.
Conflict of interest: The authors of this manuscript certify that they have no proprietary, financial, or other personal interest of any nature or kind in any product, service, and/or company that is presented in this article.