
Abstract
Within the 230138 bp of the rat cytomegalovirus (RCMV) genome, the G+C content changes abruptly at position 142644, constituting a G+C content frontier. To the left of this point, overall G+C content is 69.2%, and to the right it is only 47.6%. A region of extremely low G+C content (33.8%) is found in the 5 kb immediately to the right of the frontier, in which there are no predicted coding sequences. To the right of position 147501, the G+C content rises and predicted coding sequences reappear. However, these genes are much shorter (average 848 bp, 50% G+C) than those in the left two-thirds of the genome (average 1462 bp, 70% G+C). Whole genome alignment of several viruses indicates that the initial ultra-low G+C region appeared in the common ancestor of the genera Cytomegalovirus and Muromegalovirus, and that the lowering of G+C in the right third has been a subsequent process in the lineage leading to RCMV. The left two-thirds of RCMV has stop codon occurrences at 67.5% of their expected level, based on a modified Markov chain model of stop codon distribution, and the corresponding figure for the right third is 78%. Therefore, despite heavy mutation pressure, selective constraint has operated in the right third of the RCMV genome to maintain a degree of gene length unusual for such low G+C sequences.
Introduction
The rat cytomegalovirus (RCMV) is a member of the genus Muromegalovirus within the sub-family Betaherpesvirinae, the beta herpesviruses. In the present article, RCMV refers always to the Maastricht strain. The so-called RCMV England strain may represent a different species (Beisser et al. 1998; Voigt et al. 2005). The mouse cytomegalovirus (MCMV) is a member of the same genus, with primate cytomegaloviruses members of the sister genus Cytomegalovirus. The clinical profile of human cytomegalovirus (HCMV) has increased steadily in recent years with the recognition that it is: 1) involved in congenital abnormalities (Sever and White, 1968; Kenneson and Cannon, 2007), 2) an opportunistic infection producing fatal outcomes in both transplant patients (Schulman, 1987) and in cases of AIDS (Eversole, 1992), and most recently, 3) involved in the phenomenon of immunosenescence (Trzonkowski et al. 2003; Koch et al. 2007). The evolution of cytomegaloviruses (CMVs) and their adaptation to prolonged existence in their hosts is therefore a clinically important area of study.
Herpesviruses are highly variable in their overall G+C content, ranging from 32% to 75% (Roizman et al. 1992), for reasons that are poorly understood (McGeoch et al. 1986). The variation in G+C content for a selection of herpesviruses is shown in Table 1. In addition to wide variation in overall G+C content, there are often large internal variations. For instance, within the 230138 bp of the RCMV genome, the G+C content is considerably lower in the right third. It has been observed that the right third of the genome begins with a region of extremely low G+C content (Brocchieri et al. 2005) and that this ultra-low G+C area contains no predicted coding sequences (Vink et al. 2000).
A selection of herpesviruses varying from 49% to 74% G+C content. There is no obvious sub-family or genus pattern in the data. For further information see McGeoch et al. (2008).
There has been some controversy in the literature concerning the effects of mutation pressure on the length of genes (Duret et al. 1995; Oliver and Marin, 1996; Marin and Oliver, 2003; Xia et al. 2003). This paper investigates in detail for the first time the nature of the changes in G+C content within the RCMV genome, comparing them to those in other CMVs. A modified 1st order Markov chain model is shown to provide a good approximation to the distribution of stop codons in a large set of completely sequenced viral genomes. The differences between the model and the distribution of stops in RCMV, with consequent implications for RCMV evolution, are discussed.
Methods
Sequences and Software
A set of 2161 fully sequenced viral genomes was downloaded from NCBI (http://www.ncbi.nlm.nih.gov/Taxonomy/Browser/wwwtax.cgi?id=10239). Herpesvirus genome sequences were downloaded individually and are listed in Table 1. Only the Maastricht strain of RCMV is fully sequenced. Therefore the England strain, which is in any case of uncertain relationship (Beisser et al. 1998; Voigt et al. 2005), was neglected. Genomes were visualised in Artemis (Rutherford et al. 2000), and inter-genome comparisons were performed in ACT (Abbott et al. 2005; Carver et al. 2005). Both Artemis and ACT were run as Java Web Start versions (http://www.sanger.ac.uk/Software/Artemis/, http://www.sanger.ac.uk/Software/ACT/respectively). Full genome alignments were carried out using MAFFT (Katoh et al. 2002; Katoh et al. 2005), downloaded from http://align.bmr.kyushu-u.ac.jp/mafft/software/ and run in global alignment mode on Linux. All other processes were carried out using Perl scripts, available on request from the author. In general, these employed the Bio: SeqIO module from Bioperl (http://www.bioperl.org) to process FASTA-formatted sequences, with the Bio:Tools:SeqWords module (http://doc.bioperl.org/releases/bioperl-current/bioperl-live/Bio/Tools/SeqWords.html) used for the production of stop codon occurrence tables.
Viral coding sequences were also downloaded from NCBI using the Taxonomy Browser. There were 4482 coding sequences from the herpesviruses, and 46807 coding sequences from the 2161 fully sequenced viral genomes. The 167 coding sequences from RCMV were extracted from the GenBank file using Artemis.
Models of Stop Codon Occurrence
There are three stop codons, TAG, TGA and TAA with their corresponding complements CTA, TCA and TTA. It can be seen immediately that there are only 4 G or C residues within these 12 bases, and it may be suspected that low G+C sequences would have a higher proportion of stop codons. Three null hypothesis models of stop codon density are considered here:
a zero-order Markov chain, where the likelihood of each stop codon is simply dependent on the base frequency
For any codon, X1 X2 X3 in a sequence of length N, its expectation value is (Barrai et al. 1994):

a first-order Markov chain, using dinucleotide frequency instead of raw base frequency (Barrai et al. 1994):
a modified first-order Markov chain, based on both overlapping dinucleotide frequencies and base frequencies (Brendel et al. 1986):

For each model, the predicted number of stop codons was determined for each genome analysed. The number of actual stop codons on both strands was then counted. A correlation co-efficient was calculated between the set of predicted and observed stop codon numbers. The ratio of total observed to expected stop codons was also calculated.
Results
Precise Location of the G+C Frontier
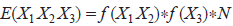
Within the 230138 bp of the RCMV genome, the G+C content changes abruptly at position 142644, a short distance after the N-terminus of gene r106. To the left of this point, overall G+C content is 69.2%, and to the right it is only 47.6%. The change is striking enough to be localised to a specific base position. The succeeding 27-mer after position 142644 (ATTAAAAT-GAAAAAAAAAAAAAGAAAT) has 7.4% G+C and the succeeding 38-mer (ATTAAAAT-GAAAAAAAAAAAAAGAAATCTATAAAATAA) has 7.9% G+C. The abruptness of this transition justifies the use of the description G+C frontier (Fig. 1).
The G+C frontier in the rat cytomegalovirus, visualised at base resolution in Artemis. The extreme N-terminus of gene r106 (reverse orientation) can be seen in blue on the left. The initial 7.9% G+C 38-mer that marks the G+C frontier is shaded in yellow. Notional translations can be disregarded.
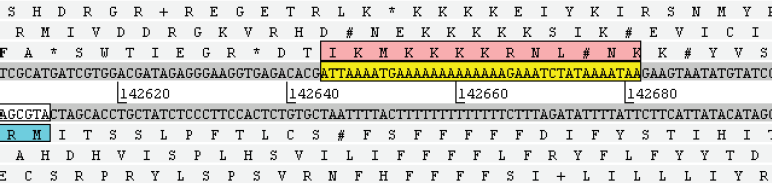
The 5 kb immediately to the right of the frontier has extremely low G+C content (33.8%) and contains no predicted coding sequences. To the right of position 147501, the G+C content rises and predicted coding sequences reappear, the first of which is r107. The density of stop codons is also greater both within the 5 kb ultra-low G+C region and continuing to the right end of the genome (Fig. 2).
The G+C frontier region, visualised at gene resolution in Artemis. The plot line gives G+C content in a sliding window of 500 bp. The upper boundary line on the G+C content plot is set at 80% G+C and the middle line at the whole genome average of 61% G+C. The lower boundary of the G+C plot is at 29% G+C. Stop codons are indicated as black vertical bars and open reading frames (ORFs) are colored blue. The gene-free ultra-low G+C region between genes r106 and r107 is shaded in yellow. Note the increased density of stop codons within this region.
When the G+C content ranges of 2161 completely sequenced viral genomes are examined in sliding windows of 25 kb, RCMV has the highest range of the entire set. The sequence from positions 1001 to 26000 has 72.3% G+C and from 197201 to 222200 has 41.1% G+C, giving a range of 31.2%. The virus with the next highest internal range in sliding windows of 25 kb is tupaiid herpesvirus at 18.8%, and it is notable that the top 18 positions are all occupied by herpesviruses (data not shown).
Variation in Statistical Properties on Either Side of the Frontier
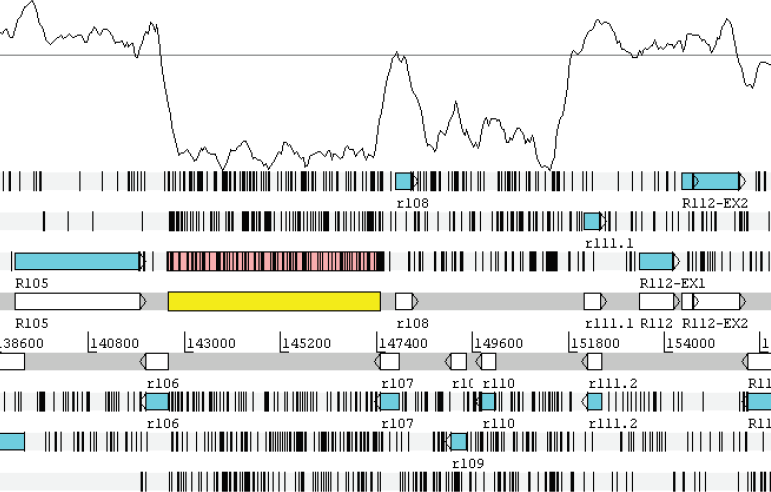
Many statistical properties of the genome are also different in the low G+C right third. The Informational Entropy (Konopka, 1984) is high and relatively flat. Additionally, codon bias-based open reading frame (ORF) prediction methods such as the Mutational Response Index (Gatherer and McEwan, 1997) cannot predict genes (Fig. 3).
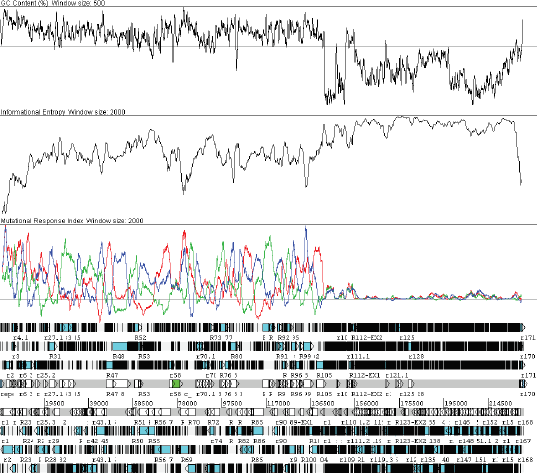
The G+C frontier region, visualised at genome resolution in Artemis. The plots are G+C content, Informational Entropy and Mutational Response Index (sliding window of 500 bp for the first and 2 kb for the others). Note how the Mutational Response Index identifies ORFs in the left two-thirds (each reading frame in a different color), but cannot distinguish any in the right third.
Similarly, other codon bias-based indices such as Scaled Chi-Square (Shields and Sharp, 1987), GC Frame Plot (Ishikawa and Hotta, 1999), Positional Asymmetry (Shulman et al. 1981), Intrinsic Codon Deviation Index (Freire-Picos et al. 1994), and Effective Codon Number (Wright, 1990) give relatively featureless plots (data not shown but similar to that of Mutational Response Index in Fig. 3). However, many of these indices are correlated with G+C content, and their changes may simply be a reflection of G+C content around the 50% mark (Guigo and Fickett, 1995).
Dating the Origin of the Frontier
Given the striking differences between the two parts of the RCMV genome, it is tempting to hypothesize that they have different phylogenetic origins, and that the modern RCMV genome may be a fusion of two viruses, or of a virus with a stretch of cellular DNA. This possibility, however, can be confidently excluded. Firstly, Karlin Signature Difference (Karlin, 1998) performed in Artemis does not suggest that the right third of the RCMV genome is an exogenous sequence. Secondly, whole genome comparison of RCMV and MCMV in ACT reveals extensive areas of homology between the low G+C area of RCMV and the corresponding part of MCMV (Fig. 4), confirming previous observations at the level of individual genes (Vink et al. 2000).
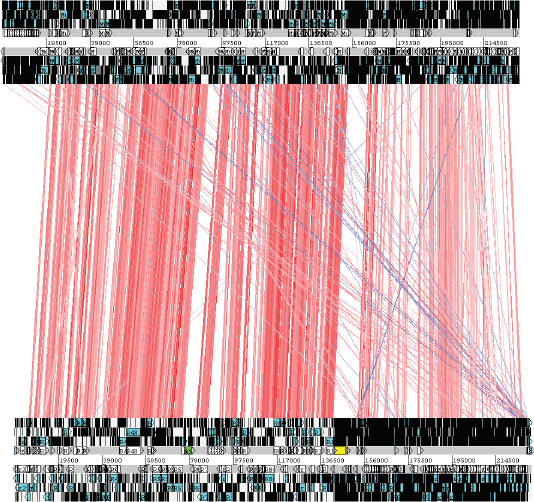
ACT comparison of rat cytomegalovirus (bottom) and mouse cytomegalovirus (top) genomes. Stop codon are vertical black lines. Regions of sequence similarity are indicated by red lines from one genome to the other. It is clear that the two genomes are homologous even to the right of the G+C frontier. The ultra-low G+C region to the immediate right of the frontier is shaded in yellow.
Furthermore, other CMVs also display some of the same phenomena, albeit less strikingly. A whole genome alignment of MCMV and RCMV shows that both have a low G+C region immediately to the right of the position corresponding to the G+C frontier in RCMV (Fig. 5). The frontier effect is not so visible in MCMV, since the G+C content is nearly equal on either side of the ultra-low G+C region. RCMV by contrast has higher G+C to the left and lower G+C to the right.
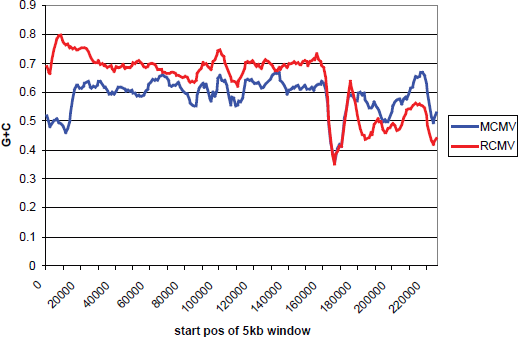
Mouse and rat cytomegalovirus genomes (MCMV and RCMV respectively) aligned with MAFFT and their G+C contents plotted using a 5 kb sliding window. The addition of spaces in the alignment moves the G+C frontier to approximately position 170000.
When this kind of analysis is extended to the whole of the CMVs, the difference of RCMV is clearly visible (Fig. 6). However, it is also apparent that all the CMVs have the ultra-low G+C region. This feature therefore appears to have been in existence since at least an ancestral Muromegalovirus/Cytomegalovirus species. The next nearest outgroup, the genus Roseolovirus, shows neither an ultra-low G+C region, nor any similar pattern of G+C difference (not shown).
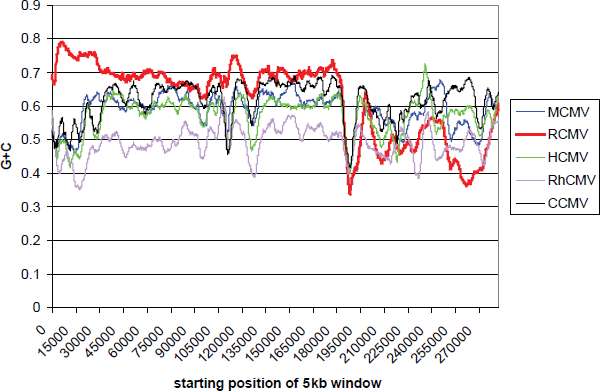
Human (HCMV), chimpanzee (CCMV) and rhesus monkey (RhCMV) cytomegalovirus genomes were aligned with the corresponding rat (RCMV) and mouse (MCMV) cytomegalovirus genomes using MAFFT and their G+C contents plotted using a 5 kb sliding window. The addition of spaces in the alignment moves the G+C frontier to approximately position 190000. Note the presence of the ultra-low G+C region in all genomes.
Effect of Low G+C Content on ORF Length
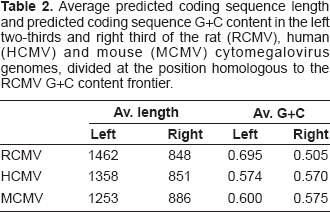
The Artemis views (Figs. 2 and 3) strongly suggest that the average ORF length, and therefore also gene length, are shorter in the right third of the RCMV genome, and quantification of gene length in RCMV versus other CMVs confirms that this is the case for all (Table 2). However, RCMV is the most extreme in range both in terms of average gene length and average gene G+C.
Average predicted coding sequence length and predicted coding sequence G+C content in the left two-thirds and right third of the rat (RCMV), human (HCMV) and mouse (MCMV) cytomegalovirus genomes, divided at the position homologous to the RCMV G+C content frontier.
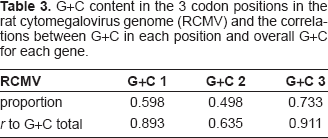
When the G+C content of individual genes in RCMV is compared, one sees a striking difference on either side of the G+C frontier, demonstrating that the G+C content within ORFs of the right third reflects the overall low value (Fig. 7). In RCMV genes as a whole, G+C variation in each of the three codon position follows the expected pattern, with the most synonymous codon position 3 having a correlation of r = 0.911 with the overall G+C content of the gene (Table 3).
G+C content in the 3 codon positions in the rat cytomegalovirus genome (RCMV) and the correlations between G+C in each position and overall G+C for each gene.
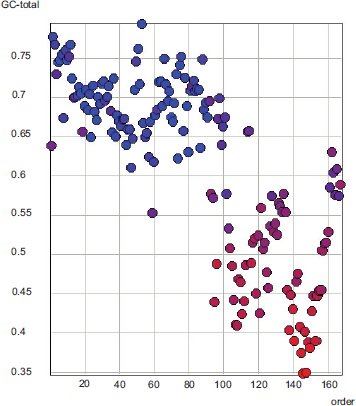
The G+C content of each gene in the rat cytomegalovirus genome, genes simply ordered from left to right. The coloring of the genes is by their G+C content in the third codon position, red for low G+C and blue for high G+C.
A Markov Model of Stop Codon Distribution
The Artemis views (Figs. 2 and 3) display the increased stop codon density within the right third of the RCMV genome. Determining the significance of this observation requires a null hypothesis against which to test observed stop codon occurrence. Three models are used as described in the Methods: a zero-order Markov chain, first-order Markov chain, and a modified first-order Markov chain. The predicted level of stop codons for the zero-order chain is plotted in Figure 8. It can be seen that in a sequence of approximately 50% G+C, one stop codon would occur on either strand in approximately 8% of residue positions. This relationship is almost linear for most of its range (approximately from 0.16 G+G to 0.71 G+C).
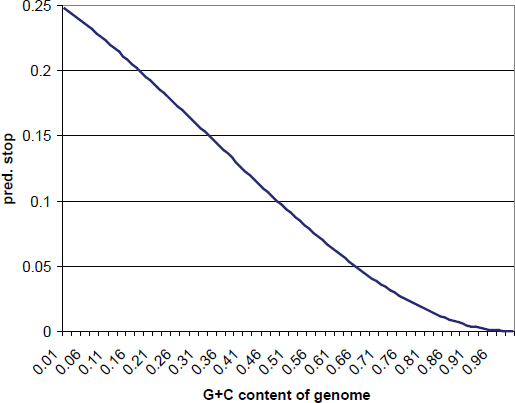
The predicted occurrence of stop codons in a zero-order Markov chain model. This is equivalent to the occurrence of stop codons in a random sequence.
Using a set of 2161 fully sequenced viral genomes, the performance of the 3 models can be assessed (Table 4).
The correlation coefficient of observed stop codon frequency to expected stop codon frequency and the observed to expected ratio for 3 different, and progressively more sophisticated, null models of codon distribution. Data from 2161 fully sequenced viral genomes.
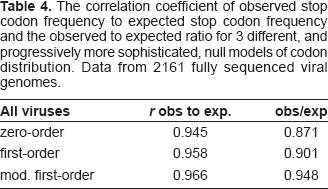
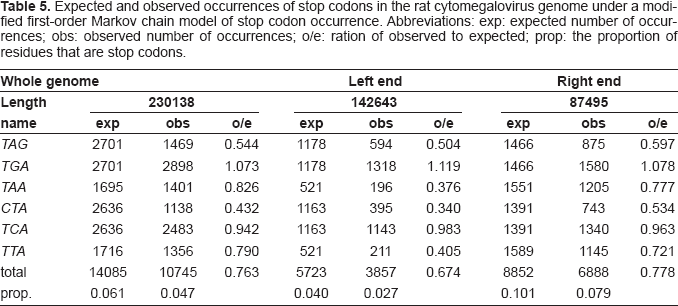
The most accurate null distribution model is the modified first-order Markov chain, giving a correlation of observed to expected stops of r = 0.966. Stop codons in the 2161 viral genomes occur at 94.8% of their expected frequency according to this model. However, under this model the left two-thirds of RCMV has stops at only 67.5% of their expected level, and the corresponding figure for the right third is 77.7% (Table 5).
Expected and observed occurrences of stop codons in the rat cytomegalovirus genome under a modified first-order Markov chain model of stop codon occurrence. Abbreviations: exp: expected number of occurrences; obs: observed number of occurrences; o/e: ration of observed to expected; prop: the proportion of residues that are stop codons.
Correlation between G+C Content of Individual Genes and Their Length
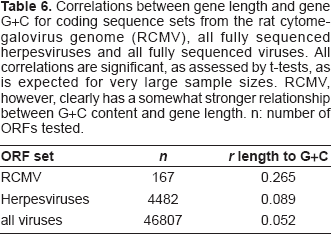
Figure 7 and Table 2 demonstrate that the genes in the low G+C right third of the RCMV genome also tend to be shorter. This can be tested on the level of individual genes, simply by correlating their length with their G+C content. Three data sets were used: the RCMV coding sequences, the coding sequences from 2161 completely sequenced viral genomes and the coding sequences from all completely sequenced herpesvirus genomes. Table 6 shows that the correlations are generally quite weak, but that RCMV is noticeably stronger than the others; t-tests on the correlation coefficients were significant for all samples, although this is common when large sample size correlations are tested. It is therefore possible to say that although G+C content is not a major influence on gene length in viruses generally, or in herpesviruses in particular, it has more importance in RCMV.
Correlations between gene length and gene G+C for coding sequence sets from the rat cytomegalovirus genome (RCMV), all fully sequenced herpesviruses and all fully sequenced viruses. All correlations are significant, as assessed by t-tests, as is expected for very large sample sizes. RCMV, however, clearly has a somewhat stronger relationship between G+C content and gene length. n: number of ORFs tested.
Discussion
Although the ultra-low G+C area in RCMV (Fig. 2) has been previously observed, usually merely in passing (Brocchieri et al. 2005), and the absence of genes in this area has been established in RCMV (Vink et al. 2000) and in other CMVs (Rawlinson et al. 1996; Davison et al. 2003; Dolan et al. 2004), the full extent of G+C variation in RCMV has so far not been explored. The distinguishing feature of RCMV in this respect is that after the gene-less ultra-low G+C region, considerably low G+C extends to the remainder of the right end of the genome (Figs. 5 and 6). Furthermore in RCMV the boundary between the high G+C left two-thirds of the genome and the low G+C right third is abrupt enough to constitute a G+C frontier (Figs. 1, 2 and 3). Together these features suggest an initial appearance of the ultra-low G+C region, prior to the radiation of the viruses of the families Cytomegalovirus and Muromegalovirus. Then, over the lineage leading to RCMV, mutational pressure further pushed the G+C content in a downward direction in positions to the right of the ultra-low G+C area. It also seems that the mutational trend was to higher G+C in the left two-thirds of the genome (Fig. 6). Perhaps constraint to maintain overall G+C within an acceptable range led to a compensatory elevation of G+C in the left two-thirds. The fact that the range of overall G+C only varies from 57%–62% across MCMV, HCMV, RCMV and CCMV (Table 1) is consistent with such a global constraint. However, it is recognised that this logic could be reversed. If some mutational pressure was initially forcing G+C upwards in the left two-thirds, it is possible that the lower G+C in the right third is the result of compensation to maintain overall G+C levels. The reason for the precise location of the G+C frontier is also obscure. It does not correspond to any known functional DNA structure within the genome such as an origin of replication. The compartmentalization of the RCMV genome into high and low G+C regions is reminiscent of the isochore phenomenon in mammalian genomes (Bernardi and Bernardi, 1986). Complete sequencing of the so-called RCMV England strain, which is likely to constitute a distinct member of the genus Muromegalovirus (Beisser et al. 1998; Voigt et al. 2005) would be of considerable value in analysing changes in G+C content in the recent evolution of this genus.
The genes in RCMV are generally responsive to genome G+C content, both in terms of their own overall G+C content (Fig. 7) and their codon position-specific values (Table 3). The expected limits placed on this response by constraint on amino acid sequences (Collins and Jukes, 1993; Lobry, 1997) is apparent in the lower correlation of overall G+C to that in the second codon position (Table 3). The increase in mutational pressure towards stop codons, produced by pressure to lower G+C as demonstrated theoretically in Figure 8 and apparent in the observed stop codon densities in Figures 2, 3 and 4, is also manifested in the shorter gene length in the right third of the genome (Table 2). Just as mutational pressure on gene G+C content is constrained by amino acid sequence, one might also imagine that mutational pressure to shorten gene length might also be constrained by a necessity to maintain protein length. The existence of such a constraint in RCMV is strongly implied by the observation that stop codons are suppressed in its right third (Table 5). Using the best model for stop codon distribution, one that gives a correlation of 0.966 between observed and expected stop codon frequency in 2161 viral genomes (Table 4), it can be shown that stop codons occur at only 67% and 78% of expected levels respectively in the left and right portions of the RCMV genome (Table 5). For the 2161 viral genome set, the corresponding figure is 95%. This indicates that selection is working to preserve gene length in RCMV and that this is operating along the entire genome. The apparently greater constraint on gene length in the left two-thirds may be a consequence of the presence of the beta herpesvirus core gene set in this region (Dolan et al. 2004). Alternatively, it may simply be that constraint is losing its battle against mutation pressure in the right third of the genome.
A tendency to short gene length in low G+C genomes has been previously proposed (Oliver and Marin, 1996; Marin and Oliver, 2003). In five vertebrate and four prokaryote species, there is a correlation between the G+C content of exons/genes and their length (Oliver and Marin, 1996), and this correlation has been extended to 68 completely sequenced prokaryotic genomes (Xia et al. 2003). Furthermore, genes from Buchnera, one of the lowest G+C content prokaryote species (30%) are significantly shorter than their orthologues in E.coli (Charles et al. 1999). On the other hand, it has also been found that low G+C isochores in vertebrates tend to contain longer genes, although their total number of genes is proportionately smaller than high G+C isochores (Duret et al. 1995). Other studies have found further confounding factors (Li, 1999; Xia et al. 2003). In RCMV, the correlation, although significant, is weak (Table 6). However, this is not necessarily an argument against the general principle that low G+C creates a pressure to shorten gene length, merely against G+C content being the principal determining factor, a situation that is unlikely to apply in functioning genomes.
Therefore, despite heavy mutation pressure on G+C content exerting effects on gene length, selective constraint has operated in the right third of the RCMV genome to maintain gene lengths unusual for such low G+C sequences. This indicates a genome evolving under an intense conflict between different evolutionary forces. The reasons why these forces have been stronger in RCMV than in the related MCMV remain a matter for speculation.
Disclosure
The author reports no conflicts of interest.