
Abstract
Positive feedback loops have been identified in many biological signal transduction systems. Their importance in a system's bistability has been well established by identifying multiple steady states of a network under different parameters. In this paper, we identify the contribution of positive feedback loops to network robustness by a systematic comparison between network structures and responses to perturbations at a pre-steady state. Our study is based on a T helper (Th) cell differentiation model in which positive feedback loops give rise to a subnet robustness against both positive and negative perturbations from outside the subnet. Although it is unclear whether this pre-steady state exists in vivo, the results from in silico modeling are in agreement with the reported in vivo observations. Being highly heterogeneous and rarely at a steady state, the disease cells, such as cancer cells, may gain potential resistances to certain drugs in a similar way. From the reverse engineering point of view, our results confirm that, while data from perturbation experiments are very effective in identifying causal relationships among the network components, caution should be taken, as in some circumstances, a direct interaction could be invisible due to positive feedback loops.
Introduction
Many cellular components interact with each other with high specificity to form signal transduction pathways and networks. These networks further control cell functions and physiological states, such as proliferation, differentiation and apoptosis, in response to intra- or extra-cellular perturbations or developmental signals. It is thus an important task to study the relationships between the network structures and the dynamics of the network components. A detailed understanding of these relationships will help to elucidate the mechanisms of cell response pathways and identify critical genes as potential therapeutic targets.
It was suggested decades ago that the existence of certain network features, such as feedback oscillation/ inhibition and feed-forward activation, would determine system dynamics.1,2 In recent years, mostly due to the technological breakthrough in genome sequencing and large-scale biological network construction, increasing attention has been paid by researchers to the systematic study of the relationship between network structures and dynamics. For example, Ingram et al 3 showed a lack of characteristic behavior for the bi-fan motif using a series of deterministic models. Similarly, Soyer et al 4 reported that diverse and biologically relevant responses could be created by networks consisting of three- and four-protein components. Kuo et al 5 studied the network topology and the evolution of dynamics in an artificial genetic regulatory network model. Using an in silico perturbation approach, Goryachev et al 6 identified an auxiliary positive feedback loop together with dimerization of the transcription factor, which is important to the switch-like behavior of the network. In these works, mathematical modeling and in silico simulation proved to be very useful in revealing the hidden structure-function relationship in the network.
Despite the above results, a very basic question remains open regarding the relationship between a network's structure/topology and its dynamics. Given a network with nodes and the directed edges between the nodes, it is feasible to search the potential pathway(s) from one node to another and to identify the reachability between them. This structural reachability is determined by the network topology. On the other hand, if a change in a node in the network (for a cell system, this change could be a gene knock-out or knock-down, or over-expression of a protein) results in a change in another node, these two nodes are dynamically reachable. A previous study showed that structural reachability does not guarantee dynamic reachability. 7 While positive feedback loops had been inferred to play an important role in the discrepancies of these reachabilities, this could also be due to other structural characteristics; for instance, if two nodes are separated by a long pathway, signaling could be diminished along the pathway and could fall below a detectable level before it reaches the target. Or there could be multiple pathways between two nodes and they transduce opposite signals which could cancel each other out.
In this study we further explore a well established T helper cell differentiation regulatory network as a test case to extend our previous work by systematically investigating the relationship between structural and dynamic reachability. We apply an in silico perturbation approach to examine the relationship between two categories of structural features (pathway- and node-specific features, respectively) and dynamic reachability. We first confirm that structurally reachable node pairs are not always dynamically reachable, even if the two nodes are separated by only one edge. We then compare the relative importance of pathway lengths, pathway numbers, and the numbers of positive and negative alternative pathways in network robustness. Finally, we show that dynamic unreachability between nodes separated by one edge is due to multiple feedback loops.
Methods
The Model
We adopted a previously published model 8 for this study. The network structure of this model includes 23 cellular components (Fig. 1A) and interactions between them that are important in T helper (Th) cell differentiation. Two methods have been previously used to model this network, namely discrete and continuous dynamic modeling, with the latter approach involving a novel and general method of generating a dynamic system. Both approaches identified three steady states (or attractors) of the network, which correspond to the precursor Th0 cell and the effector Th1 and Th2 cells, respectively, which are determined based on specific cytokine activities. This model was claimed to be the first dynamic model of Th cell differentiation. 8
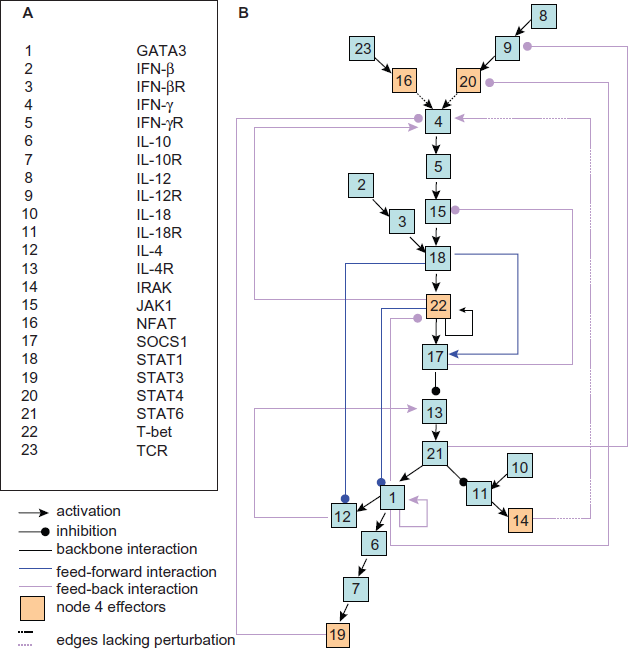
The network structure of the model of Th cell differentiation. Modified from (Mendoza and Xenarios, 6 ) A)Cellular components involved in the model; B) Network strucutre. For more explanation of the interaction classification, see the text.
For the purposes of our analysis, the interactions are arbitrarily classified into three categories, namely backbone interactions, feed-forward interactions and feedback interactions (Fig. 1B, nodes are numbered for simplicity). The backbone interactions constitute the backbone of a network, which is represented as an acyclic and branched tree. In the backbone, all interactions point in one direction (downward in this case), and all nodes can be placed at a specific layer (or depth) without ambiguity. A feed-forward interaction has the same direction as the backbone, but it spans at least two layers in the backbone. A feedback interaction has the reverse direction to the backbone, and spans one or more layers backwards. Classification of the interactions will help identify structural features related to dynamic perturbations (for details see below).
Network Structure Characterization
Two categories of structural features are studied, namely pathway-specific features and node-specific features. For pathway-specific features, all the potential pathways between any two nodes are searched. For each pathway, the length is counted and the potential effect is calculated based on the number of negative edges. It is then trivial to find the shortest pathway, the total number of pathways and the number of positive alternative pathways (PAP) and negative alternative pathways (NAP). The average pathway length between each node pair is also calculated. Structural reachability is designated to a pair of nodes if at least one pathway can be found between them. For node specific features, the node connectivity (input, output and total connections) and feedback loop are counted, and the average shortest pathways (for incoming pathways and outgoing pathways, respectively) are calculated.
Dynamic Simulation
We studied the network dynamics using two types of in silico perturbations. In simple perturbation, one component is perturbed with the initial activity reduced or increased by half, which mimics the knockdown or over-expression experiments. In conditional perturbation, particular feedback or feed-forward interaction(s) are blocked, and a perturbation is applied. The purpose of simple perturbation experiments is to find the dynamic relationships between the nodes in the context of the network, and to find the relationship between the structural and dynamic reachabilities. The purpose of conditional perturbation experiments is to find particular structural properties, such as feedback loops and/or feed-forward interactions, which are important for explaining the potential discrepancies between the structural and dynamic reachabilities.
Three steady states of the Th network were identified in the previous work, representing Th0, Th1 and Th2 cell types, respectively, all found during T helper cell differentiation (Mendoza and Xenarios, 8 and references therein). In each steady state, at least some nodes will bear the value 0, making the network partially active. Because in this study we are attempting to reveal the relationship between the network structure and the dynamics, the full network structure should be taken into account. We thus define the initial states of the network with each node having the half of the maximum activity, to make sure every element of the network will contribute to the observed dynamics. Note the maximum activity is 1 under the mathematics of the model.
GNU Octave software (http://www.octave.org) is used to investigate the network dynamics. Details of this software can be found in the Octave manual available on the web site. When a perturbation scheme (the initial activity of the nodes and the structure of the network) is defined, Octave scripts are created based on the formulation as described by Mendoza and Xenarios. 8 The equations assign an ODE (Ordinary Differential Equation) to each node. The ODE is composed of two items, an activation item and a decay item. The activation item incorporates both positive and negative regulations and is a sigmoid function. We followed the previous formulation in assigning the parameter values, i.e. the weights α = β = 1, decay constant γ = 1, and the gain h = 10. For all simulations, the time period is from 0 to 20 arbitrary units, which is divided into 600 steps for solving the differential equations. Time series from the simulation are recorded, and the total activities of a node are summed up along the simulation time. The simulations are performed pair-wise, with one being a control and one being perturbed. The ratio of change of the nodes is calculated using the formula:
Ratio of change = (TAP-TAC)/TAC
Where:
TAP = total activity from the perturbation simulation
TAC = total activity from the control simulation.
The perturbation (i.e. the dynamic reachability) is determined by a cutoff of the ratio. In real biological samples with high noise, detection of the ratio will be largely dependent on the sensitivity and accuracy of the instruments. In the simulation experiments, we did not introduce noise, and therefore a very low value, 0.001 (or 0.1%), was chosen as the cutoff, i.e. if the ratio is larger than 0.001 or less than -0.001, there is a positive or negative perturbation, respectively.
Results
Discrepancies between Structural and Dynamic Reachability
Figure 2 shows the structural versus dynamic reachability between the nodes for the Th cell differentiation network, with the first column being the starting nodes (heads/perturbers) and the first row the ending nodes (tails/perturbees). Most of the nodes have pathways to 16 other nodes, while nodes 2 and 23 can reach 17 other nodes structurally. Nodes 2, 8 and 10 cannot be reached structurally by any nodes, as they do not have any upstream regulators. Nodes 3 and 16 can be reached by one node. All other nodes in the Th network can be reached by all nodes. In total we identified 376 structurally reachable node pairs, excluding self-reaching. In knock-down simulation, a total of 165 perturbations are observed (Fig. 2, red right-hand upper section of the node-pair square), while in overexpression simulation, 155 perturbation are observed (red right-hand bottom section). The discrepancies between structural and dynamic reachability is thus obvious, leaving 211/221 node pairs reachable structurally but without discernable perturbation effects in knock-down/over-expression simulation. In the following sections, we investigate the structural features that are potentially important in determining the observed discrepancies. To do so, we split the structurally reachable node pairs into two groups: perturbation (dynamically reachable), and non-perturbation (dynamically un-reachable) groups, and study the distribution of pathway-specific and node-specific structural features in these groups.
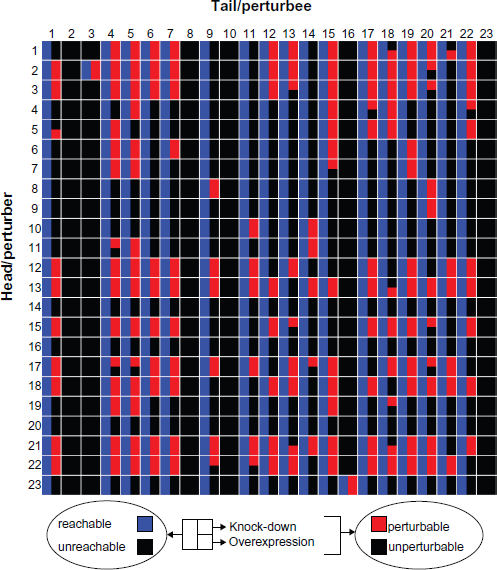
Structural versus dynamic reachability. The heads or perturbers are listed in the first column; the tails or perturbees are listed in the first row. For each head/tail or perturber/perturbee pair, the square is split into three sections. The left-hand half represents structural reachability, with blue color representing reachable and black color representing unreachable. The upper right-hand section represents the perturbation when knock-down experiments are applied, with red color representing perturbable and black color representing unperturbable. The bottom right-hand section represents the perturbation when over-expression experiments are applied.
The Pathway Lengths, But Not the Pathway Numbers, are Important for Perturbation
Figure 3A shows the distribution of the shortest pathway lengths for the two groups. For the perturbation group, most of the shortest pathways have a length between 1 and 4 (87%) with the peak at 2 and 3, while for the non-perturbation group, most of the shortest pathways have a length between 5 and 9 (73%) with the peak at 6 and 7. (For all node pairs, the shortest pathway length distribution peaks at 3 and 4.) It is thus obvious that the shortest pathway length is important in determining the dynamic perturbation. Figure 3B shows the distribution of the average pathway lengths. Again, the distribution for all node pairs and the non-perturbation group peaks at the same average length (8), but for the perturbation group, the peak is located at a smaller length (6). Additionally, more node pairs have small average lengths (1-4) in the perturbation group than in the non-perturbation group. Figure 3C shows the distribution of the total number of the pathways between the node pairs. It is intuitive to think that if multiple paths exist between two nodes, then they are likely to be dynamically reachable. However, no obvious trends are observed for them, although the perturbation group has more node pairs with either very small (1-2) or very high (19) number of total pathways. Similar distributions are observed in the over-expression simulation (Figs. 3D, 3E and 3F). We thus conclude that pathway lengths, especially the shortest pathway lengths, are important in determining the outcome of dynamic perturbation.
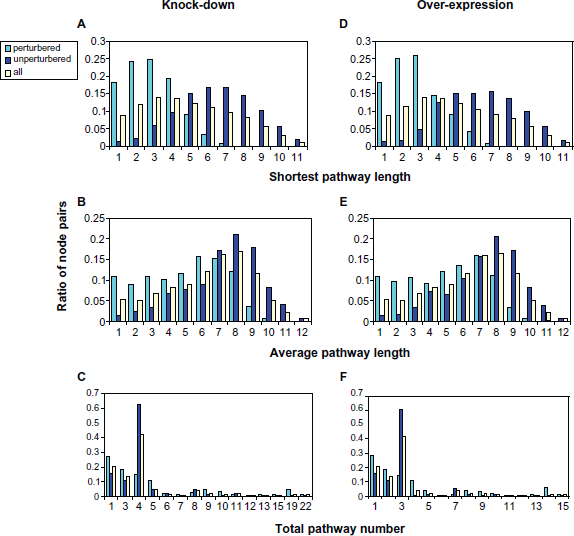
Distribution of node-pair specific features. A and D: shortest pathway length; B and E: average pathway length; C and F: total pathway number. A, B and C: results from simulated knock-down experiments; D, E and F: results from simulated over-expression results.
Non-Perturbation is Only Partly Explained by PAP and NAP
It is likely that the effect of long pathways on dynamic perturbation could be because of the decreased signal level caused by decay during signal transduction. However, one other possible cause for non-perturbation is the existence of both positive and negative pathways between a pair of nodes, and they may abate each other's effect and result in the observed non-perturbation. To test this hypothesis, we calculated the effects of all pathways, and counted the number of positive-alternative-pathways (PAP) and negative-alternative-pathways (NAP) for each node pair. Figure 4 shows the existence of PAP and NAP for each node pair (grouped into three categories, see the legend for details) and the dynamic perturbations for both knock-down and over-expression simulations. Figures 5A and 5C show the distribution for all cases. Most node pairs have only PAP or NAP, many of them do not guarantee a perturbation. For those having both PAP and NAP, most show a perturbation, either positive or negative and only a small proportion (≤10%) have no perturbation. It thus can be concluded that non-perturbation between reachable nodes is mostly due to other structural features than the conflict between PAP and NAP. We also analyzed the dominance of PAP or NAP in determining the perturbation effects of node pairs where both PAP and NAP exists (Figs. 5B and 5D). When the number of NAP is greater than the number of PAP, the perturbation is mostly negative in both the knock-down and over-expression groups; while when the PAP number is greater than the NAP number, the perturbation is mostly positive in the knock-down group. This result demonstrates that the existence of positive or negative alternative pathways is at least partially responsible for the dynamic behavior of the entire network.
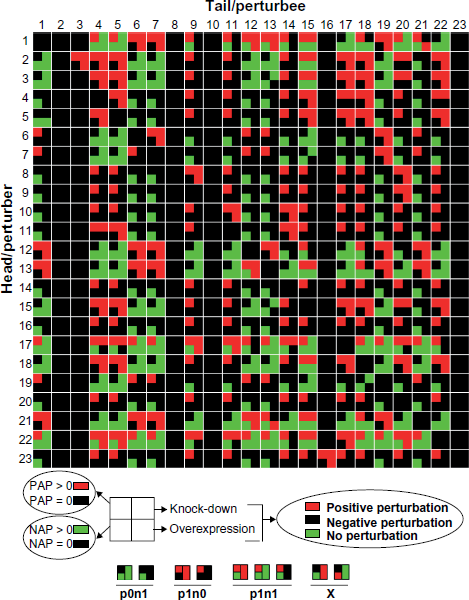
PAP and NAP for the node pairs. The square for each node pair is split into four parts; upper left-hand for PAP, bottom left-hand for NAP, upper right-hand for the results of simulated knock-down experiments, and bottom right-hand for the results of simulated over-expression experiments. PAP/NAP groups: p0n1: #PAP = 0, #NAP ≥ 0; p1n0: #PAP ≥ 0, #NAP = 0; plnl: PAP ≥ 0, NAP ≥ 0. X: there is no node pair with positive/negative pathway(s) and negative/positive perturbations.
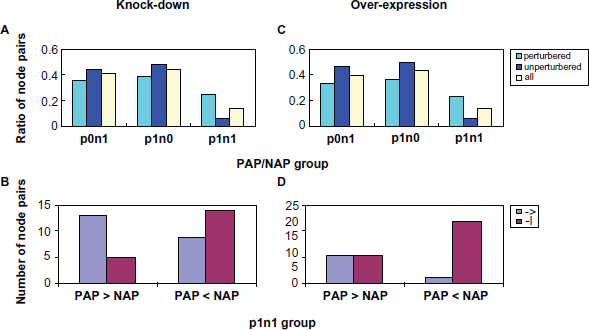
Balancing between PAP and NAP did not account for most non-perturbation. A and C: distribution of node pairs in different groups based on PAP and NAP; B and D: Dominance of PAP or NAP in type plnl of perturbation group. A and B: results from simulated knock-down experiments; C and D: results from simulated over-expression experiments.
Node-Specific Features and Dynamic Perturbation
We analyzed the input and output connections of the nodes separately. For input connections, the number of nodes that can reach a particular node is compared to the number of nodes that can perturb it. For output connections, the number of nodes that a given node can reach is compared to the number of nodes it can perturb. As shown in Figures 6A and 6D, reachability is not affected by either input (left) or output (right) connections. As few as one connection could be enough for the node to be reached by or to reach many other nodes; however, a high number of connections will probably ensure the node's ability to perturb or to be perturbed. The second node-specific feature is the average length of the shortest pathways, which is used as a measurement of node closeness. The average length for input and output shortest pathways is calculated separately. As shown in Figures 6B and 6E, node closeness does not affect the ability of a node to be reached or to reach other nodes, but probably affects its ability to be perturbed or to perturb, with more perturbation related to greater closeness. The last node-specific feature we analyzed is the number of feedback loops. Most nodes have feedback pathways to themselves (Fig. 2), except for nodes 2, 3, 8, 10, 16 and 23 since they either lack input or have input only from those nodes lacking input. The number of loops varies from 4 to 22 (Figs. 6C and 6F). There is no clear relationship between the number of loops and dynamic perturbation, although increasing the loop number tends to relate to higher perturbing ability. Nevertheless, in the following section, certain feedback loops will be shown to determine the robustness of certain nodes to perturbation by other nodes one step upstream of them.
Feedback and Feed-Forward Interactions Determine the Non-Perturbation in Short Pathways
As analyzed above, the shortest pathways are important in determining the dynamic perturbation (Figs. 3 and 6). However, several non-perturbation node pairs have their shortest pathway length as low as one step (Fig. 3A and 3D), implying the existence of other topological features responsible for these extreme cases. These one-step, non-perturbation node pairs are all towards node 4 (14->4, 16->4 and 20->4), indicating that this node is highly robust against the perturbation to these upstream nodes. Node 4 has the greatest input number (5) in this network, 3 of them are feedback interactions (from nodes 14, 19 and 22); the other 2 are backbone interactions (from nodes 16 and 20, Fig. 1B). We hypothesize that it is these feedback loops that stabilize node 4. To test this, we conducted a systemic conditional perturbation simulation, in which the 10 feedback interactions (including 2 auto-interactions) are blocked one at a time, and the perturbation effects of nodes 14, 16 and 20 on node 4 are simulated. As three feed-forward interactions all exist in the route of the feedback loop via node 19, we also tested their effects in a similar manner.
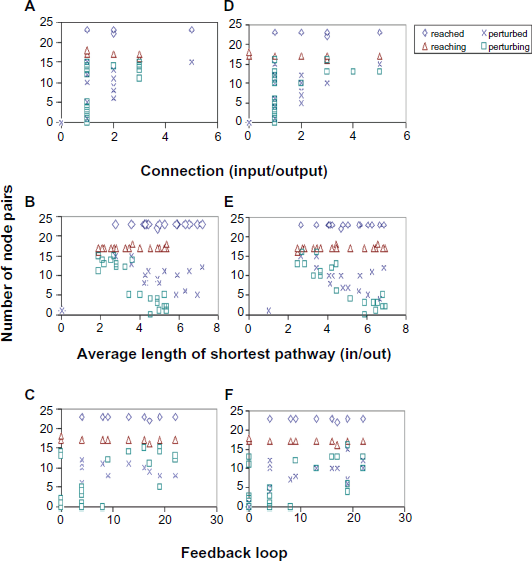
Relationship between node specific features and dynamic perturbation. A and D: Node connection, input and output; B and E: Average length of shortest pathways; input and output; C and F: Node feedback loop. A, B and C: results of simulated knock-out experiments; D, E and F: results of simulated over-expression experiments.
As shown in Table 1, blockage of two feedback interactions towards node 4, namely 22-4 and 19-4, and the 22-22 self-interaction, sensitize node 4 to nodes 14, 16 and 20, which does not occur in the intact network. Quantitatively, blockage of 22-4 feedback has a larger sensitizing effect than blockage of 19-4 (8.327 versus 4.921 in arbitrary units), and the effect of the 22-22 blockage (6.256) is between these two values (Table 1). Furthermore, blockage of a feed-forward interaction, 22-1, also enables node 4 to be sensitive to its upstream nodes (Table 1). Similar results are also observed in over-expression simulation. These effects were not observed for other feedback or feed-forward interactions. It thus seems that these four interactions are critical for dynamic non-perturbation of node 4. To further test this notion, we conducted another round of conditional perturbation simulation, in which feedback/feed-forward interactions are added to the network backbone one at a time (Table 1). For knock-down simulation, addition of any of the feedback/feed-forward interactions does not result in loss of sensitivity of node 4; however, addition of the feedback interaction 22-4 reduces its sensitivity by 96.7% (from 0.0351 to 0.0012, a marginal perturbation), and the next most effective feedback interaction is 19-4, which reduced the sensitivity by 69.1% (from 0.0351 to 0.0109). Meanwhile, although deprivation of 22-22 and 22-1 do render node 4 the sensitivity, addition of them to the network backbone does not change the sensitivity at all. Similar results are observed in over-expression simulation, except that the addition of 22-4 feedback to the backbone deprives node 4 sensitivity. It is thus concluded that the feedback interactions 22-4 and 19-4 are responsible for the non-perturbation of node 4 by nodes 16 and 20. Interestingly, the upstream of node 16 and 20, namely nodes 8, 9 and 23, all use node 4 to reach other nodes, but they do not have any perturbation effects on other nodes in the full network, indicating that stabilization in node 4 renders the sub-network robust against certain perturbations.
Single blockage or addition of feedback and feed-forward interaction from the full network or to the backbone.
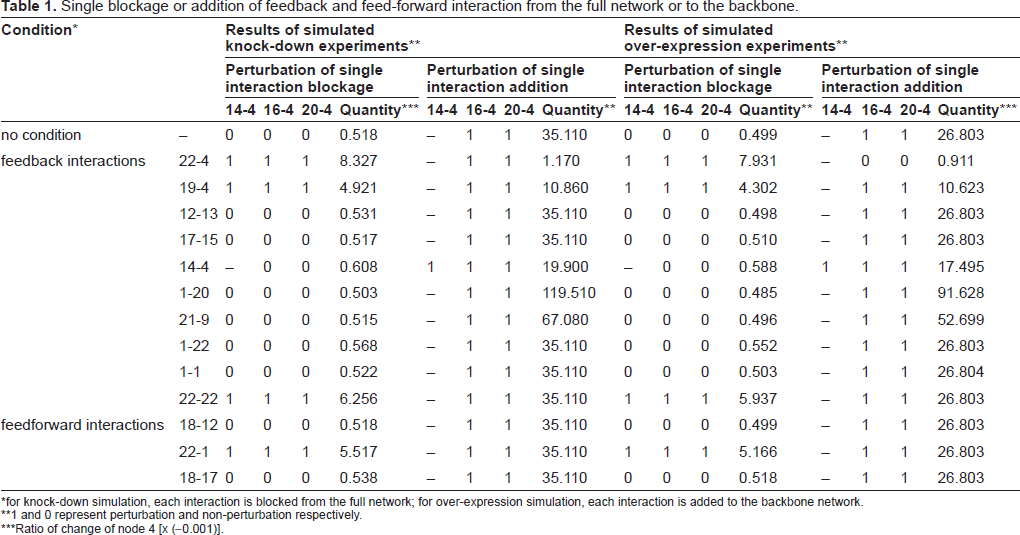
for knock-down simulation, each interaction is blocked from the full network; for over-expression simulation, each interaction is added to the backbone network.
1 and 0 represent perturbation and non-perturbation respectively.
Ratio of change of node 4 [x (-0.001)].
Discussion
In this study we used a Th cell differentiation model to analyze the relationship between network structure and dynamic robustness. We used half of the maximum activity (0.5) as the initial state for all nodes. This homogeneity of the initial state is to ensure that any potential changes in the nodes in response to a perturbation will be observed. For example, if the initial activation is set to 0 or 1, no further inhibition or activation could be observed. Although it was argued that certain cell types are associated with a specific cytokine profile, controversial results were also reported,9,10 leaving the in vivo existence of this homogeneity state of the network unclear. We also adopted unified parameter values for all nodes, partly due to a lack of detailed data for deducing exact parameters, but most importantly, such practice can ensure that any observed dynamic behavior of the network will be completely determined by its structure, a valuable prerequisite for the purpose of this study. As shown by Mendoza and Xenarios, 8 a variety of initial states of this model converges to one of the three steady states. With the particular initial state used in this study, the system is attracted to the Th1 region. However, a shift of steady states is observed for several perturbations. Specifically, a single negative perturbation in IFN-β, IFN-βR, JAK1 or STAT1 shifts the attraction to Th0, while a knock-down of T-bet shifts the attraction to Th2. Single over-expression in GATA3, IL-4R or STAT6 keeps the system at Th0. These results are comparable to that of Mendoza and Xenarios. 8 A shift of the differentiation from towards Th1 to towards Th2 at low T-bet is also in agreement with recent experimental results in which CD4+ cells from T-bet-/- mice are skewed toward Th2 differentiation. 11 This pre-steady state displays robustness to other positive or negative perturbations. Resistance to IL-4 and IL-10 perturbation indicates that as long as the system is determined to differentiate towards Th1, Th2 lymphokine can not reverse the process. In conclusion, although the in vivo homogeneity and pre-steady state of the network is not clear, its use as an initial state ensures capturing several important biological features of the network components.
We have confirmed with continuous modeling that structural reachability in the network does not guarantee a dynamic perturbation. It is likely that most of the non-perturbation for the reachable node pairs is due to the long length of the pathways (Fig. 3). Indeed, we observe signal decay along a long pathway spanning 12 steps from NFAT to STAT3 in the backbone network, in which the velocity of the decay seems dependent on the signal itself (data not shown). However, the decay reaches a valley at a change ratio of 0.005, and much longer pathways seem necessary to decrease the ratio of change under the perturbation cutoff (data not shown). Thus the pathway length alone could not explain non-perturbation. We propose that enrichment of non-linear structural motifs, such as feedback and feed-forward loops, with the elongation of the pathways, could be the reason for complex and non-intuitive network dynamics. By using conditional perturbation simulation, we identified two feedback interactions (from T-bet and STAT3 respectively) which stabilize IFN-4gM against a perturbation from its upstream effectors (TCR/NFAT, IL-12/STAT4 and IRAK). The stabilizing effect of T-bet–-IFN-γ is larger than that of STAT3-|IFN-γ, as revealed by conditional perturbation simulation. This is in agreement with the domain knowledge that T-bet is the master transcription factor in a Th1 cell and is sufficient to direct Th1 commitment.12–14 The greater effect of T-bet–-IFN-γ than STAT3-|IFN-γ is, most probably, due to the fact that the feedback loop via T-bet is purely positive, while the feedback loops via STAT3 are all double-negative, hence as the Th2-related subnet (composed of GATA3, IL-10, IL-10R, IL-4, IL-4Rx, STAT3 and STAT6) is inhibited by the Th1-related subnet (composed of IFN-γ, IFN-γR, JAK1, SOCS1, STAT1 and T-bet) via the inhibitory interactions STAT1-|IL-4, T-bet-|GATA3 and SOCS1-|IL-4R, STAT3-|IFN-γ would no longer be in action. The third positive feedback interaction to IFN-γ from IRAK does not contribute to the robustness at all, nor has it perturbation to IFN-γ. Indeed, even in the backbone network, the signal transduction stops at IL-18R which receives a negative regulation from STAT6 (data not shown), in contrast to GATA3 which also receives an input, yet a positive input, from STAT6, indicating a different effect on the signal transduction of a double-negative interaction along the pathway. As TCR, IL-12 and IL-18 are all Th1 inducers, loss of IFN-γ sensitivity to them indicates that as long as the network is determined to differentiate towards Th1, further enhancement of this trend is not necessary and will be rejected. Together with the last paragraph, the entering of Th1 differentiation insulates the system from all perturbation in relevant lymphokines.
In conclusion, we showed in this paper the relationships between network structures and robustness against perturbation in node concentrations. In particular we provided evidence of multiple positive feedback loops as the source of robustness with simulation experiments on a T helper cell differentiation network. It is possible, however, that the size and topological complexity could be larger in other networks. Further investigations are thus needed with larger and more complex networks to characterize their structure and robustness relationships.
Disclosures
This manuscript has been read and approved by all authors. This paper is unique and is not under consideration by any other publication and has not been published elsewhere. The authors report no conflicts of interest.