
Abstract
The focus of current treatments for obesity is to reduce the body weight or visceral fat, which requires longer duration to show effect. In this study, we investigated the short-term changes in fat metabolism in liver, abdomen, and skeletal muscle during antiobesity interventions including Sibutramine treatment and diet restriction in obese rats using magnetic resonance imaging, magnetic resonance spectroscopy, and blood chemistry. Sibutramine is an antiobesity drug that results in weight loss by increasing satiety and energy expenditure. The Sibutramine-treated rats showed reduction of liver fat and intramyocellular lipids on day 3. The triglycerides (TG) decreased on day 1 and 3 compared to baseline (day 0). The early response/nonresponse in different fat depots will permit optimization of treatment for better clinical outcome rather than staying with a drug for longer periods.
Introduction
Obesity is a medical condition that contributes to several health problems including type 2 diabetes, cardiovascular disease, hypertension, dyslipidemia, stroke, and depression.1,2 The initial choice of intervention for treating obesity is always diet restriction and exercise. However, in cases when these healthy interventions fail in reducing body weight, drug treatment is preferred in combination with exercise and/or diet restriction. The important action of antiobesity drugs is to reduce body weight and fat reduction by altering appetite, absorption of calories, or increase of energy metabolism. In most of the clinical trials, the main biomarker to evaluate weight loss is measurement of total body weight or body mass index. However, it usually takes 3–6 months to identify the weight loss, 3 and cannot provide information on changes in adiposity within ectopic sites such as liver, muscle, and abdomen. Therefore, it is desirable to understand dynamic changes in fat metabolism in each fat depot as a response to the treatment. In this study, we hypothesized that the lipid changes in metabolic organs can be utilized as a potential biomarker to predict antiobesity effects very early compared to body weight changes.
The most popular pharmacological options include Sibutramine, Orlistat, Phentermine, Diethylpropion, Fluoxetine, and Bupropion. Sibutramine (usually in the form of the hydrochloride monohydrate salt) is an oral anorexiant. 4 Although its mechanism of action is distinct, it is a centrally acting serotonin–norepinephrine reuptake inhibitor structurally related to amphetamines. It suppresses appetite by inhibiting the reuptake of the neurotransmitters norepinephrine and serotonin. Earlier studies with Sibutramine showed decrease in body fat, visceral fat, and hepatic fat.5,6 More than 10 prospective, randomized, and controlled trials of Sibutramine lasting 6–24 months have supported its efficacy. 7 It has been marketed and prescribed as an adjunct in the treatment of exogenous obesity along with diet and exercise. A recent clinical trial of this drug showed weight loss in overweight and obese subjects. 8 Recently, Sibutramine has been withdrawn from use in several countries due to side effects, including increased cardiovascular risk, increased blood pressure, and other effects like dry mouth, constipation, headache, and insomnia.9,10
The major mechanism contributing to the pathogenesis of obesity is lipotoxicity, resulting from excessive deposition and accumulation of lipids in peripheral tissues beyond their oxidative or storage capacities. In obese patients, large lipid accumulation is seen in many tissues, including liver, adipose, and muscle.11–13 Imaging techniques, including ultrasound, computed tomography (CT), proton magnetic resonance spectroscopy ( 1 H-MRS), and magnetic resonance imaging (MRI), have been utilized for evaluation of fat metabolism. 14 Ultrasound and CT provide qualitative information, whereas 1 H-MRS– or MRI-based methods can determine changes in fat with high degree of accuracy. The MRI techniques are noninvasive and are suitable for longitudinal and cross-sectional studies including various metabolic conditions and medical treatment regimens. They have been used to evaluate abdominal fat as subcutaneous adipose tissue (SAT) and visceral adipose tissue (VAT) volumes. 1 H-MRS has been widely used to measure liver fat and skeletal muscle fat including intramyocellular lipids (IMCL) and extramyocellular lipids (EMCL) in both humans and rodents.15–18 In addition, advanced localized two-dimensional MRS techniques have been employed to assess skeletal muscle lipids.19–24 Quantifying IMCL in skeletal muscle is important due to its correlation with metabolic disorders including obesity and insulin resistance.25–27 The IMCL and EMCL lipid pools can be separated due to the bulk susceptibility differences28,29 enabling them to be quantified separately. 1 H-MRS has been applied successfully in humans30,31 and rodents32,33 to investigate metabolic disorders and to study drug, nutrition, and exercise effects. Liver fat is strongly associated with insulin resistance and is therefore considered as an important marker for obesity. While mild accumulation is considered benign, excess accumulation can result in lipotoxicity, increased inflammation, and also lead to progressive forms of nonalcoholic fatty liver disease such as fibrosis and cirrhosis.17,34 In our study, we have investigated the longitudinal changes in liver fat, abdominal fat (VAT and SAT), and IMCL in skeletal muscle as antiobesity interventions using Fischer rats. For investigating antiobesity process, calorie-restricted diet and Sibutramine administration were utilized in the same diet-induced obesity model. Longitudinal changes in body weight and blood plasma were measured along with the imaging.
Methods
Animals and diet
Fifteen Fischer rats (male, F344) of 4 weeks were purchased from CLEA Japan, Inc. (Tokyo, Japan) and housed in a room maintained at 23°C. After the arrival, the rats were acclimatized to the experimental facility for 1 week prior to the start of the study. Rats were given experimental diet and water for the entire study period ad libitum. All animal experiments were approved by the Biological Resource Center Institutional Animal Care and Use Committee, A*STAR, Singapore. The composition of the diet is shown in Table 1.
Composition of HFD per 100 g (Research Diet Inc).
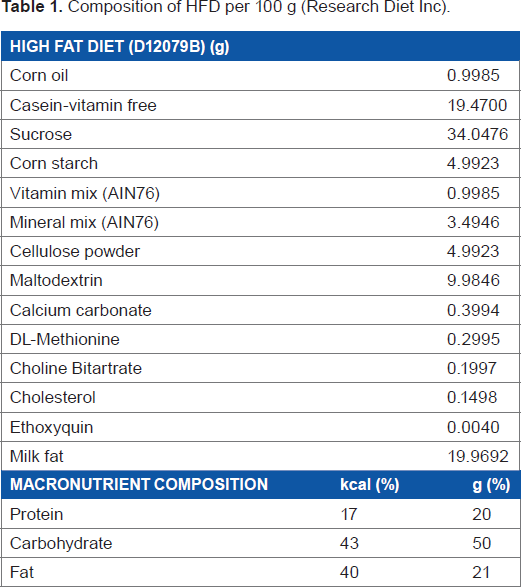
In our study, all the 15 rats were fed with high-fat diet (HFD) from the age of 5 weeks to 17 weeks. After 17 weeks, these animals were randomly divided into three groups, ie, HFD, calorie restriction (CR), and Sibutramine groups as shown in Figure 1. The calorie-restricted group was fed with a limited amount of the same HFD (80% of the initial food intake). The food intake was estimated by averaging the amount of food consumed by each rat for 2 days prior to the start of the experiment. The Sibutramine intervention rats were fed with HFD and Sibutramine (3 mg/kg, 5 mL/kg of saline). All the 15 rats were subjected to baseline imaging scan on day 0 followed by imaging during intervention on days 1, 3, 8, 15, and 29. The measurements included body weight, blood TG, plasma insulin and leptin levels, and food intake along with liver fat, abdominal fat, and skeletal muscle lipids.
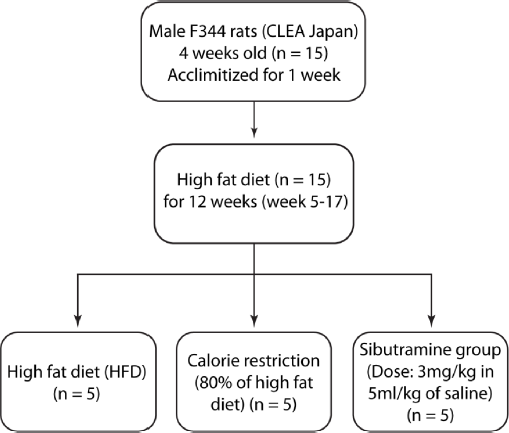
The study design flowchart shows the three groups (HFD, CR, and Sibutramine) and the experimental conditions.
Physiological measurements
From 5 to 21 weeks, body weight and food intake were measured everyday of the intervention period. Blood plasma and imaging parameters were collected on baseline (day 0) and day 1, 3, 8, 15, and 29. A rodent restrainer was utilized during lateral vein bleeding. Each blood withdrawal did not exceed 0.2 mL, and the amount of blood withdrawn did not exceed a total of 7.5% of circulating volume per week in accordance with internationally accepted guidelines (http://oacu.od.nih.gov/arac/documents/Rodent_Bleeding.pdf). The blood sampling was performed without fasting due to the frequency of the imaging experiments. TG measurement was performed by Quest Laboratories Pvt. Ltd. (Singapore) using an ADVIA Chemistry triglycerides reagent kit. Leptin and insulin values were measured using rat Leptin ELISA kit and an ultrasensitive rat insulin ELISA kit (Crystal Chem, Inc., IL).
Magnetic resonance imaging and spectroscopy
All animals were subjected to MRI and localized MRS. Prior to in vivo experiments, animals were initially anesthetized with 3% isofluorane in a dedicated chamber. During the imaging experiments, isofluorane levels were reduced to 1.5%–2.0% in combination with medical air and medical oxygen. 1 H-MRS and MRI measurements were performed on all rats using a 7-Tesla Bruker ClinScan MR scanner employing volume transmit and surface receive coils for liver, abdomen, and skeletal muscle. The imaging and spectroscopic data were acquired with motion compensation by respiratory-triggered acquisition. Abdomen imaging was performed by water-suppressed fast spin-echo imaging sequence with a field of view of 55 × 55 mm; matrix size of 256 × 256; 25 slices with 1.6-mm thickness; repetition time (TR) = 2111 ms; echo time (TE) = 33 ms; and 4 averages. Coronal images were used for anatomical reference, and transverse images from L1 to L5 vertebrae were used for quantitation of visceral and subcutaneous fat as shown in Figure 2. Segmentation of visceral and subcutaneous fat depots was performed using custom-developed MATLAB program employing fully automated graph theoretic segmentation algorithm. 35 The first step of the two-step segmentation procedure separated the fat tissues from the nonfat tissues in the image by intensity thresholding. The extracted fat tissues were then segmented in to SAT and VAT using graph cuts. The image was formulated as a graph with each voxel representing a vertex and edges connecting the vertices. The weights of the edges were assigned using distance-transformed values of the voxel. The minimum cut on this graph found the boundary with the minimum sum of weights in the graph. The weights being smaller at the narrow connections between SAT and VAT favored the cut that separates them.
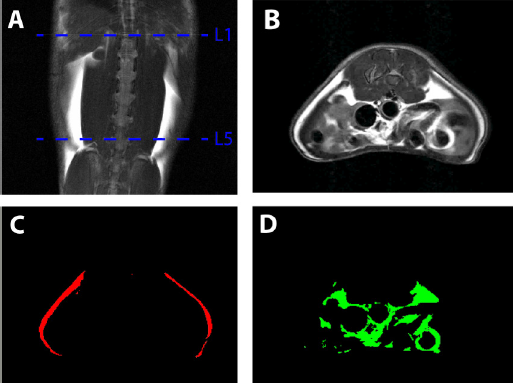
Segmentation and quantification of abdominal VAT and SAT between L1 and L5 vertebrae from MRI. (A) Coronal image of rat abdomen showing the upper side of L1 and lower side of L5; (B) transverse view of the abdomen showing SAT and VAT; (C) SAT; and (D) VAT after segmentation.
Localized PRESS 36 experiments were performed on liver and skeletal muscle with a voxel size of 4 mm3 and 3 mm3, respectively, with TR = 4000 ms and TE = 13 ms. MR spectra were acquired from the right lobe of the liver and tibialis posterior region of the skeletal muscle (Fig. 3). The spectra were acquired from the volume of interest with and without water suppression. Water-suppressed acquisition was performed with 128 averages along with one acquisition of unsuppressed water. The spectral analysis and liver fat estimation were performed using LCModel software. 37 The percentage of liver fat was calculated from the concentrations of methyl (0.9 ppm) and methylene (1.3 ppm) resonances and the unsuppressed water peak (4.7 ppm) as reported in earlier work 38 and corrected for T2 losses. The IMCL content from skeletal muscle was estimated with reference to total creatine.

Localized 1D PRESS spectrum of liver (A) and skeletal muscle (B). Images show the MRS voxel positions where the spectra was acquired. The voxel sizes are 4 × 4 × 4 mm3 in the liver and 3 × 3 × 3 mm3 in the tibialis muscle, respectively.
Statistical analysis
Since the sample size (n = 5) of the study is small to prove a normal distribution, the statistical analyses were performed using the Mann–Whitney U-test for all biochemical and metabolic parameters. Median and interquartile ranges are reported, and P < 0.05 was considered significant. The comparison of parameters between the three groups (HFD, CR, and Sibutramine) was performed using Kruskal–Wallis one-way analysis of variance and multiple comparisons test. All statistical analyses were performed using MATLAB software.
Results
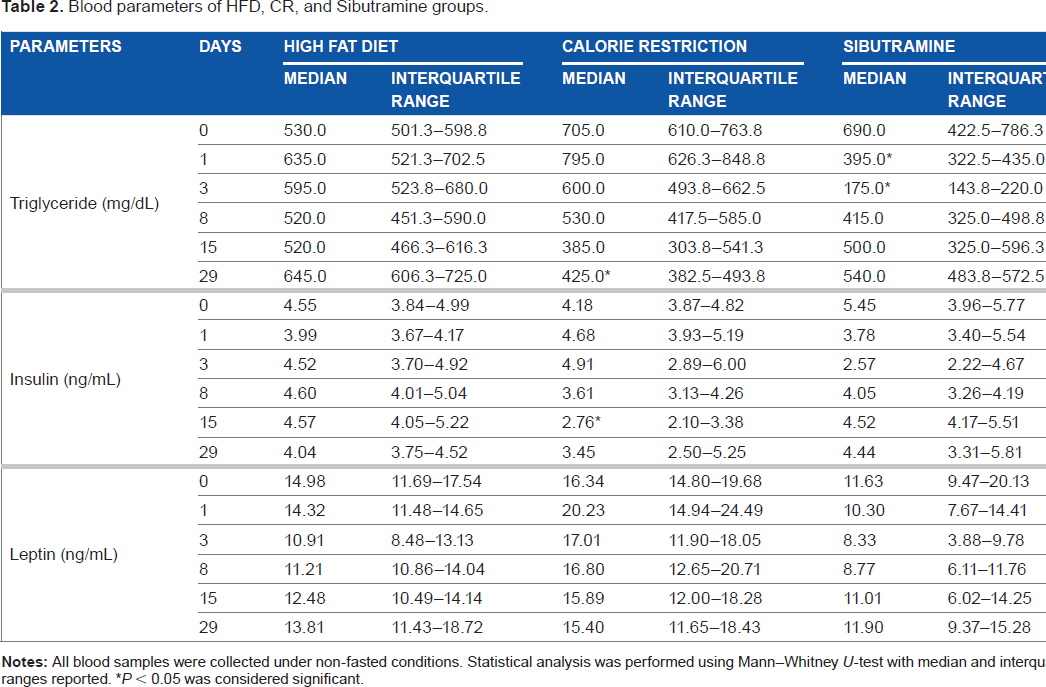
Table 2 shows the blood and metabolic parameters obtained from all groups (HFD, CR, and Sibutramine) during day 0, 1, 3, 8, 15, and 29 of the intervention period. Figure 4 shows the changes in the body weight, and Figure 5 represents the changes in food intake, liver fat, and IMCL for all the groups.
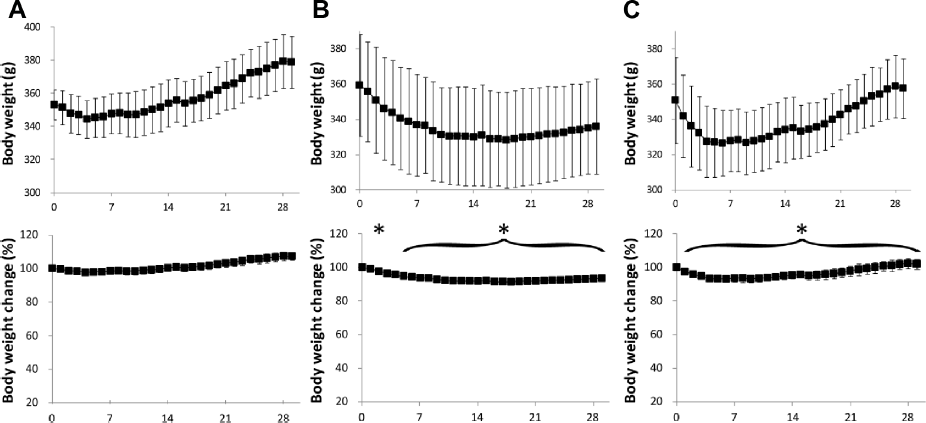
Variation of body weight in (A) HFD, (B) CR, and (C) Sibutramine groups. The y-axis of the body weight change graph shows normalized values with respect to the corresponding average value of the HFD group at day 0. Data are represented as mean ± standard deviation (*P < 0.05 vs. day 0).
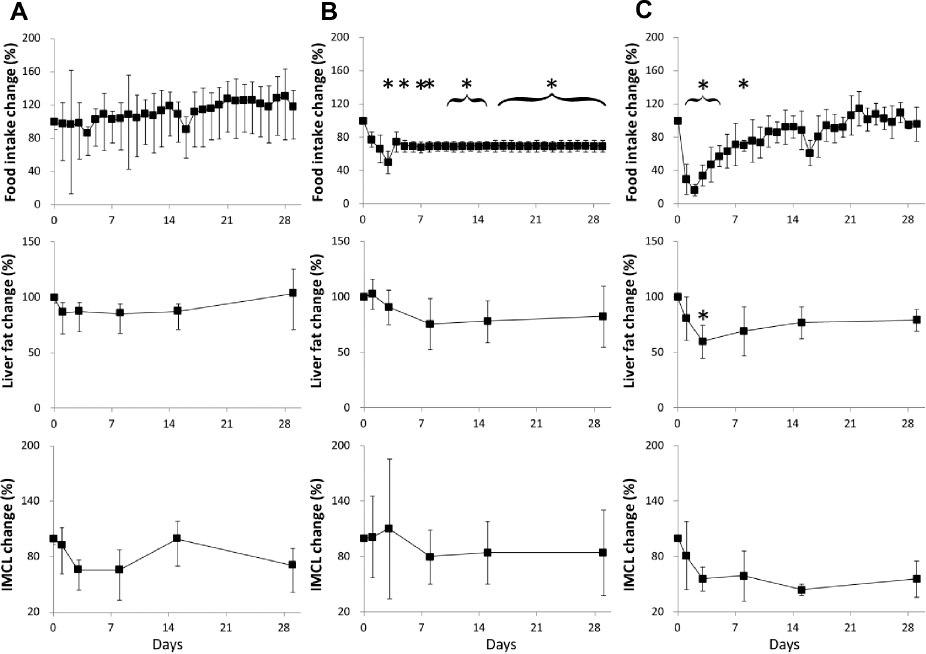
Variation of food intake, liver fat, and skeletal muscle IMCL in (A) HFD, (B) CR, and (C) Sibutramine groups. The y-axis of the graphs show normalized values with respect to the corresponding average value of the HFD group at day 0. Data are represented as mean ± standard deviation (*P < 0.05 vs. day 0).
Blood parameters of HFD, CR, and Sibutramine groups.
Blood parameters
Before the start of the intervention, the TG, insulin, and leptin levels were 641.66 ± 45 mg/dL, 4.72 ± 0.48 ng/mL, and 14.31 ± 1.8 ng/mL, respectively. The CR group showed a reduction in TG on day 29 and insulin on day 15. The Sibutramine-treated group showed significant decrease in TG on day 1 and 3. Kruskal–Wallis comparison showed significant differences in TG at all time points between high-fat, calorie-restricted and Sibutramine groups. When corrected for preintervention values, the differences were significant on day 1, 3, and 29 for the Sibutramine group and on day 29 for the CR group. Insulin levels showed significant difference only on day 15, and leptin was different on day 3 and 8 in CR group. After adjustment for preintervention values, Sibutramine group showed significant difference in leptin levels on day 3 and CR group showed difference on day 1, 3, and 8. Insulin level was significantly different on day 15 for the CR group.
Body weight
The CR group showed a significant body weight change on day 3 and from day 5 to day 29 (Fig. 4B). The body weight decreased until day 15 and then showed a gain until day 29. The Sibutramine-treated group had a sharp drop in the body weight up to day 3, which then remained unchanged until day 12, and gradually increased during the remaining period of intervention (day 13–29). The change in body weight with respect to the HFD group was significant from day 1 to day 29 (Fig. 4C). There was significant difference in body weight between the three groups on day 1 and from day 21 to day 29 of the intervention period.
Fat depots
The changes in liver fat and IMCL in the CR group showed a decrease that was not statistically significant. The CR group showed a decrease in liver fat from 22.42% (day 1) to 16.93% on day 15, which then increased to 17.20% on day 29. The rats in CR group did not show significant change in the VAT and SAT volumes. There were no significant changes in IMCL and liver fat (except day 3) during the intervention period. Liver fat analysis of the Sibutramine-treated rats showed an initial reduction from 17.76% to 13.83% on day 3, which then increased to 15.40% on day 29. The Sibutramine-treated rats did not show significant change in the VAT and SAT volumes. The IMCL in Sibutramine group showed a sharp decrease until day 3, and then did not show significant changes during the remaining period. Liver fat and IMCL showed significant change (P < 0.05) between the initial value (day 0) and the subsequent measurements during the intervention period (day 1–29). Kruskal–Wallis analysis showed significant differences in liver fat between the three groups on all time points. IMCL was significantly different between the groups on days 1, 3, and 29. Significant difference in VAT was observed only on day 8 of the intervention period. After adjustment for preintervention values, Sibutramine group showed significantly different liver fat on day 3 and IMCL on day 15.
Discussion
Sibutramine is a novel 5-hydroxytryptamine and noradrenaline reuptake inhibitor. It is an antiobesity drug, where the mechanism of action (Sibutramine-induced weight loss) is considered to include enhancement of satiety and an increase in thermogenesis. Sibutramine markedly reduces feeding behavior and is effective in inducing weight loss in lean and genetically obese rodents. We have investigated body fat changes using Sibutramine and CR as interventions in comparison with a HFD group using Fisher 344 rats. The Sibutramine-treated rats showed 20 g reduction in body weight compared to HFD group. This group also had reduction in food intake during the initial phase (~3 days). The CR group showed 50 g reduction in the body weight compared to HFD group during the first 2 weeks of intervention. The initial body weight loss was similar to the Sibutramine group, but body weight remained unchanged after 15 days. Our results were in agreement with a previous study suggesting that food choice or physiological adaptation in response to CR can cause increased body fat and decreased lean mass in both rodents and humans.39–41 Additional studies have also shown that the eating pattern and behavior can change under conditions of food restriction.5,40,42 Eating behavior in calorie-restricted mice alters energy expenditure resulting in larger TG production and storage in fat depots. 42 Further investigation might be needed to clarify the complex relationship between CR, fat accumulation, and feeding behavior.
The body fat analysis using fat pads (encapsulated adipose tissue) (Fig. 6) indicated similar changes and is in agreement with the MR results. Earlier Sibutramine intervention studies on human subjects showed depletion of adipose tissues rather than lean tissue mass.43,44 The amount of fat mass is altered with the increase in lipid deposition and fat infiltration in liver and skeletal muscle. Liver fat plays an important role in several metabolic diseases including obesity, diabetes, and nonalcoholic fatty liver disease.17,34 Previous clinical studies have evaluated intrahepatic fat fraction in the obese population or patients at risk for developing type 2 diabetes45–48 and in morbidly obese patients undergoing bariatric surgery. 49 Other studies have demonstrated that moderate weight reduction (around 8% body weight) leads to a marked reduction of liver fat content in subjects with type 2 diabetes 50 and women with previous gestational diabetes. 51 Our results showed a reduction in liver fat from day 1 to day 29 in CR and Sibutramine groups, which is in agreement with the body weight reduction.
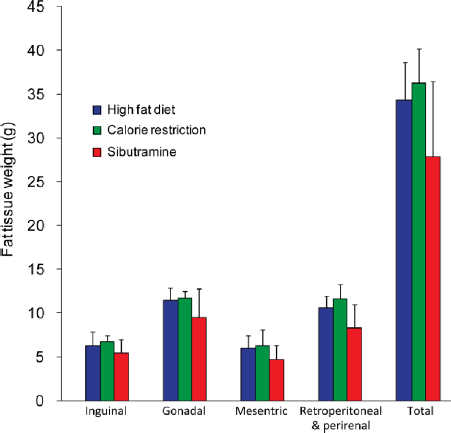
Tissue weight (g) of the fat depots among the HFD, CR, and Sibutramine groups. Data are represented as mean ± standard deviation.
The IMCL changes in skeletal muscle should be considered taking into account the age, diet, and exercise.52–54 CR group showed the reduction of IMCL during days 1–8, which later relapsed to similar level as in the HFD-fed group. Sibutramine-treated group showed an acute decrease in the early phase up to 8 days and then did not show changes for the remaining period. This reduction in the IMCL in Sibutramine group is in agreement with the previous study using Rosiglitazone drug. 55 In the Sibutramine-treated group, the percentage change of body weight was significant and follows the actual body weight change immediately after Sibutramine administration. The liver fat and IMCL had a reduction after the intervention, which implies that these fat depots can be useful biomarkers to predict antiobesity effects compared to indices of body weight. The small number of rats (n = 5) used in the experiments might be a limitation in the study. Even though an earlier study showed that the Sibutramine-treated group had reduced food intake, 56 the short-term effects on fat depots have not been reported. This study investigates the changes in fat depots during both obesity and antiobesity interventions using 1 H-MRS and MRI techniques. More detailed studies are required to understand the mechanisms for changes in fat depots within liver and skeletal muscle.
In summary, we have shown the short-term changes in fat depots in muscle, liver, and abdomen after Sibutramine intervention. This demonstrates the potential of MRS and MRI approaches to monitor dynamic changes in fat distribution during antiobesity interventions. To our knowledge, this is the first comparison of the simultaneous assessment of CR and short-term effect of drug intervention.
Author Contributions
Conceived and designed the experiments: YN, MW, TH, TN, BZ and SSV. Performed the experiments: AP, MST, TYK, VG and ZZ. Analyzed the data: AP, SAS, VG and SI. Wrote the first draft of the manuscript: AP and SI. Contributed to the writing of the manuscript: SAS, VG, SSV. Agree with manuscript results and conclusions: YN, TN and SSV. Jointly developed the structure and arguments for the paper: AP, SAS and VG. Made critical revisions and approved final version: SSV. All authors reviewed and approved of the final manuscript.