
Abstract
Breast cancer is a major health problem in women and early detection is of prime importance. Breast magnetic resonance imaging (MRI) provides both physical and physiologic tissue features that are useful in discriminating malignant from benign lesions. Contrast enhanced MRI is valuable for diagnosis of small tumors in dense breast and the structural and kinetic parameters improved the specificity of diagnosing benign from malignant lesions. It is a complimentary modality for preoperative staging, to follow response to therapy, to detect recurrences and for screening high risk women. Diffusion, perfusion and MR elastography have been applied to breast lesion characterization and show promise.
In-vivo MR spectroscopy (MRS) is a valuable method to obtain the biochemical status of normal and diseased tissues. Malignant tissues contain high concentration of choline containing compounds that can be used as a biochemical marker. MRS helps to increase the specificity of MRI in lesions larger than 1cm and to monitor the tumor response. Various MR techniques show promise primarily as adjunct to the existing standard detection techniques, and its acceptability as a screening method will increase if specificity can be improved. This review presents the progress made in different MRI and MRS techniques in beast cancer management.
Keywords
Introduction
Breast cancer is most prevalent and is the leading cause of cancer related deaths among women worldwide (National Cancer for Health Statistics 1998; Greenlee et al. 2001; NRCP 2001). It is estimated that in India, one out of every 20 women has the risk of developing breast cancer especially in cities like Delhi and Mumbai (NRCP, 2001). The early and accurate diagnosis of breast cancer is crucial for successful treatment and to improve the quality of life.
Conventional mammography has been the primary screening and diagnostic tool for breast cancer for more than 20 years. The mammographic screening guidelines were developed in the 1980's (Shapiro, 1977; National Cancer Institute, 1987) and continue to change almost annually. Recently, the American College of physicians issued recommendations for women in the age group of 40–49 years to obtain clinical assessment of risk before undergoing mammography screening (Qasim et al. 2007) while mammography screening among women aged 70 and older are being reconsidered (Caplan, 2001; Moody-Ayers, 2000). The sensitivity of mammography to detect cancer ranges from 63% to 98% (Burhenne et al. 1994; Robertson, 1993; Kerlikowske et al. 1996). However, it was reported to be as low as 30%–48% in dense breasts (Mandelson et al. 2000; Kolb et al. 2002). In addition, the positive predictive value of mammography for breast cancer ranges from 20% under age of 50 to 60%–80% in women in the age 50–69 years (Ferrini et al. 1996; Elwood et al. 1993). The false positive detection of mammography leads to unnecessary biopsies with associated complications such as hemorrhage, abscess, pain and complications related to anesthesia. Thus, additional evaluation of a lesion observed in mammography using other non-invasive techniques may help reduce the number of unnecessary biopsies.
Ultrasonography is useful adjunct to other modalities and its main role is in the diagnosis of cyst, mammographically occult lesions and in screening young women with dense breast. It is also useful in the guidance of precutaneous biopsy. However problem arises in identification of micro-calcifications, and ductal carcinoma in situ (Stavros et al. 1995; Gordon, 2002).
In view of the limitations of mammography and other techniques, considerable interest is focused on breast MRI (Fischer et al. 1999; Esserman et al. 1999; Rankin, 2000; Sardanelli, 2004; Deurloo et al. 2005; Von Goethem et al. 2006; Kuhl, 2007). The sensitivity and specificity of MRI for detection of cancer can be significantly increased by the use of paramagnetic contrast media (Fischer et al. 1999; Esserman et al. 1999; Rankin, 2000; Sardanelli, 2004; Deurloo et al. 2005; Von Goethem et al. 2006; Kuhl, 2007). However, most studies reported poor specificity (ranging from 20% to 100%) (Boetes et al. 1994; Nunes et al. 1997; Saslaw et al. 2007) and nearly 50% lesions detected by contrast enhanced (CE) MRI turned out as benign by histopathology (Orel and Schnall, 2001). A recent multi-institutional and multi-national study showed improved specificity (88%) of MRI (Kuhl, 2007) and is also recommended as a screening method in specific patients (Saslow et al. 2007). Several studies report that CEMRI is excellent in the detection of multi-focal, multi-centric disease, preoperative evaluation and for accurate staging. Other applications include evaluation of intermediate mammographic findings in radiographically dense breasts, detection of recurrent tumors and monitoring therapy response (Fischer et al. 1999; Esserman et al. 1999; Rankin, 2000; Sardanelli, 2004; Deurloo et al. 2005; Von Goethem et al. 2006; Kuhl, 2007).
Recent advances in MRI have shown the potential in bridging the gap between sensitivity and specificity. Methods based on differences in physiological, cellular and biochemical characteristics of malignant, benign and normal tissues were developed to monitor changes in diffusion (Guo et al. 2002; Woodhams et al. 2005; Manton et al. 2006; Pickles et al. 2006; Yankeelov et al. 2007), perfusion (Kuhl et al. 1997; Kvistad et al. 1999), tissue elasticity (Sinkus et al. 2007) and metabolic activity (Jagannathan et al. 1998; Roebuck et al. 1998; Jagannathan et al. 1999; Cecil et al. 2001; Yeung et al. 2001). Application of diffusion weighted imaging (DWI) in differentiating malignant and benign breast tissues (Guo et al. 2002; Woodhams et al. 2005) as well as in monitoring the treatment response were reported (Manton et al. 2006; Pickles et al. 2006; Yankeelov et al. 2007; Sharma et al. 2008). For unambiguous and early diagnosis of breast cancer with high specificity, it is desirable to have a standardized protocol with a combination of techniques.
Several reports examined the diagnostic accuracy, sensitivity and specificity of the screening mammography, physical examination and ultrasound and MRI when used in combination (Kolb et al. 2002; Berg et al. 2004; Irwig et al. 2004; Kuhl et al. 2005b; Shoma et al. 2006). The sensitivity and specificity of mammography were 77.6% and 98.8%. Addition of ultrasound increased the positive predictive value from 35.8% to 42% (Kolb et al. 2002). Ultrasound detected additional cancers but with increased false-positives when used as adjunct to mammography (Irwig et al. 2004). For invasive cancer, ultrasound and MRI were more sensitive than mammography, but both involved the risk of overestimation of the tumor extent (Berg et al. 2004). In asymptomatic women at increased familial risk for breast cancer with or without documented BRCA mutation, the sensitivity for mammography was reported as 33%, while it is 40% for ultrasound, and 91% for MRI. When both ultrasound and mammography were combined the reported sensitivity was 49% (Kuhl et al. 2005b). Shoma et al. (2006) reported that ultrasound was more accurate than clinical breast examination and mammography in assessing tumor size in palpable breast cancer.
Various methods discussed above provide wealth of information on tumor anatomy and physiology, however, an insight into the underlying biochemical processes associated with tumor progression and regression could be achieved through the use of in-vivo magnetic resonance spectroscopy (MRS). In addition, information on the alterations of metabolic pathways during disease processes by detection and quantification of metabolites could be obtained. Several centers have begun to supplement breast MRI studies with MRS to increase the specificity. To distinguish cancer from benign and normal breast tissues, the presence of composite choline (tCho) signal observed in proton ( 1 H) MRS was used (Jagannathan et al. 1998; Roebuck et al. 1998; Jagannathan et al. 1999; Cecil et al. 2001; Yeung et al. 2001) and is shown to increase the specificity of diagnosis. The specificity of MRS was reported to be around 88%, however, the poor sensitivity and requirement of slightly larger lesion to detect a tCho signal is one of the limitations. The ability of MRS to follow the metabolic profile of malignant cells before, during, and after drug treatment also helps in predicting the response of the tumor to treatment.
The present review focuses certain aspects of the development of breast MR imaging and spectroscopy. The continual efforts made to improve the specificity of MR in diagnosis, the assessment for screening, and the treatment monitoring are also presented here.
Breast MR Imaging
The MR image characteristics of breast lesions are influenced by several factors like image contrast, signal-to-noise ratio (SNR), spatial and temporal resolution. To differentiate cancerous tissue within the fatty breast, T2-weighted images were acquired with fat suppression; however, differentiation of benign and malignant breast tissues was difficult using signal intensity on T1- or T2-weighted images. T2-weighted images were used for the characterization of cystic lesions and sometimes fibroadenomas. MRI also played a useful role in the preoperative evaluation of patients planned for breast conserving surgery. MR imaging was reported to be useful for the evaluation of intermediate mammographic findings including radiographically dense breasts (Esserman et al. 1999; Fischer et al. 1999; Sardanelli, 2004; Deurloo et al. 2005; Von Goethem et al. 2006; Kuhl, 2007). It helps to avoid unnecessary biopsies for suspicious lesions seen on mammograms and also reported as a screening technique in high risk women (Saslow et al. 2007). Based on a comprehensive review of MR breast screening studies and the consensus of an expert panel, a new set of guidelines for breast screening with MRI as an adjunct to mammography was established by the American Cancer Society (Saslow et al. 2007). The reviews by Van Goethem et al. (2006) and Kuhl (2007) present detailed discussion on the current status of MR imaging in the management of breast cancer patients.
Dynamic Contrast Enhanced Breast MRI (DCEMRI)
Technical Considerations
In DCEMRI, T1-weighted images were usually acquired using a 3D spoiled gradient recalled echo (GRE) pulse sequence to acquire fast frames (data sets) of volumetric images continuously over time, spatially covering the whole breast. However, 2D GRE sequence was used for non-fat saturated subtracted DCEMRI to avoid in-plane blurring artifacts due to phase errors in all three dimensions in 3D mode (Kuhl, 2007). Shortest possible repetition and echo times are recommended for GRE pulse sequence to avoid any confounding T2 contrast. Suppression of fat is necessary to differentiate post-contrast enhancing lesion from adjacent fatty tissue. However addition of radiofrequency pulses for fat saturation or selective water excitation, results in increased acquisition time of dynamic protocols. Recently, more efficient fat suppression methods for static and dynamic MRI have been reported (Pediconi et al. 2005; Yu et al. 2006; Desmond et al. 2007). For example, Yeung et al. (2001) proposed a pseudo-Dixon pulse sequence that can be combined with parallel imaging. Another method involved the intermittent application of the fat saturation pulse throughout the k space thereby reducing the scan time (Desmond et al. 2007). Most breast CEMRI studies report the use of gadolinium diethylenetriaminopentaacetic acid (Gd-DTPA). However, a study by Pediconi et al. (2005) showed that gadobenate dimeglumine was significantly superior to gadopentate dimeglumine for breast lesion detection and characterization. This might arise due to increased T1 relaxivity of gadobenate dimeglumine that translates into greater contrast enhancement resulting in improved detection of lesions (Knopp et al. 2003; Pediconi et al. 2007).
Contrast Kinetics, Curve Features and Lesion Characterization
For characterization of contrast enhancement pattern, images with high temporal resolution are important while structural features of lesions are assessed using images with high spatial resolution. However, the major drawback is that both these conditions can not be accomplished and a compromise on either temporal or spatial resolution is necessary (Kuhl, 2007). In kinetic studies, the contrast uptake was measured with high temporal resolution imaging and the uptake curves for malignant, benign and normal tissues were evaluated. Generally benign lesions showed gradual continually rising curve with no signal decrease over at least the first 10 minutes post-contrast, known as persistent enhancing curve. Malignant tissues showed characteristic washout curve due to their increased vascular permeability. It showed a peak after 2–10 minutes of contrast injection followed by a rapid decline and washout. A plateau type curve was considered indeterminate. Figure 1(A) shows the DCE MR subtracted transverse image showing hyperintense malignant breast tumor. The image was acquired with spoiled gradient recalled echo sequence and mean signal intensity curve obtained in the enhanced lesion area is shown in (B). The curve indicates early peak enhancement with rapid washout that is strongly suggestive of malignancy.
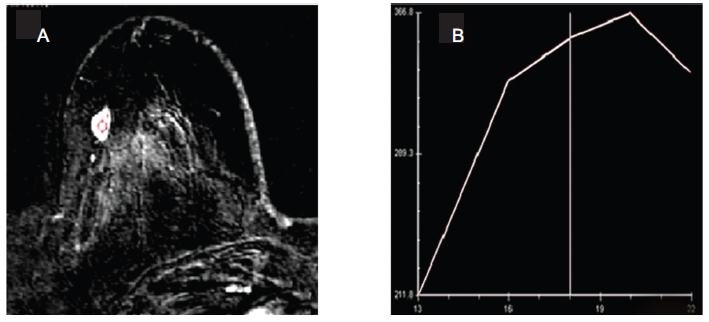
A) Transverse DCE MR image of a patient with histopathologically proven malignant breast tumor. The image was obtained with subtraction and a spoiled gradient recalled echo sequence. The breast lesion appears as hyper-intense with homogenous enhancement. B) Plot of signal intensity-versus-frame number obtained in the enhanced lesion area. The curve shows early peak enhancement with rapid washout strongly suggestive of malignancy.
High spatial resolution (~1 mm) images acquired prior to and after contrast injection were used to characterize the structural features of breast lesions. The architectural details produced by these two images allowed characterization of lesion morphology that was effective in distinguishing benign from malignant lesions (Von Goethem et al. 2006; Kuhl, 2007). It was shown that a typical invasive cancer was observed as a focal mass with an irregular shape and spiculated margins (Kuhl, 2007). Studies revealed that lobular invasive cancer appeared like diffuse non-mass like growth but exhibited weak and persistent enhancement kinetics like benign tumors misleading the diagnosis (Qayyum et al. 2002; Szabo et al. 2003). Benign tumors (fibroadenomas) appeared as a focal mass with a round or oval shape and smooth margins and exhibited variable enhancement. Typical intraductal cancer i.e. ductal carcinoma in situ (DCIS) appeared as asymmetric (unilateral) non-mass like enhancement that follows the ductal system. The enhancement kinetics showed segmental or linear distribution and was unreliable for diagnosis (Kuhl et al. 1998; Liberman et al. 2003; Morakkabati-Spitz et al. 2005).
Higher specificity might be achieved by combining both the morphological features and the enhancement kinetics information (Degani et al. 1997; Liberman et al. 2002). Recently, Kuhl et al. (2005a) and Goto et al. (2007) compared the dynamic enhancement patterns and morphological features of enhancing lesions. Their study revealed that high accuracy in diagnosis might be achieved by increasing the spatial resolution, whereas loss in temporal resolution did not affect the accuracy significantly since overlapping enhancement patterns in malignant and benign breast lesions were observed. Other groups suggested a judicious combination of both the dynamic uptake and morphological features that might improve the diagnostic accuracy of breast MRI (Schnall et al. 2006). It was shown that highest predictive value could be obtained when integration of both morphology and contrast uptake dynamics is taken in to consideration (Schnall et al. 2006).
Degani et al. (1997) reported a model based method that optimized spatial resolution by using three time points (3TPm) to characterize tumor heterogeneity in terms of microvascular permeability and extra-cellular fraction. The three points selected along a contrast enhanced curve, one pre-contrast and two post-contrast times were sufficient to estimate wash-in and wash-out behavior. Recently, Hauth et al. (2006) reported the use of three time points software in conversion of contrast kinetics on a pixel by pixel basis into color-coded images and this image could be used for lesion diagnosis by analysis of color intensity and color hue.
Clinical Applications: Diagnosis, Screening and Therapy Monitoring
The use of DCEMRI in the detection of microcalcification (Uematsu et al. 2007) and in detecting breast lesions in lactating breast (Epsinosa et al. 2005) have also been reported. The method was also shown to be useful for monitoring therapy especially for detection of the early response (Pickles et al. 2005), for treatment optimization (Martincich et al. 2004) and to monitor changes in tumor angiogenesis due to adjuvant chemotherapy (Delille et al. 2003). Recently, Garimella et al. (2007) reported the use of CEMRI in planning breast-conserving surgery after neoadjuvant chemotherapy (NACT). However, Kwong et al. (2006) documented that MRI frequently overestimated residual invasive carcinoma after NACT that contradicts other reports that underestimated post-chemotherapy residual cancer (Cheung et al. 2003; Denis et al. 2004). Further, it was observed that the discriminatory ability of morphological and contrast uptake features depend on the type of therapy (Yu et al. 2007). It was reported that the contrast uptake parameters might be more important predictors of response particularly of the anti-angiogenic drugs.
MR Elastography (MRE) of Breast
Breast cancer often shows a desmoplastic stroma reaction in terms of a reactive proliferation of connective tissue so that a dense layer of fibroblasts accumulates around malignant breast epithelial cells (Meng et al. 2001). This leads to hardening of the breast tissue that can be diagnosed by palpation. These alterations in visco-elastic properties of tissue on malignant proliferation may be quantitatively measured using a new MR technique called MR elastography (MRE) (Plewes et al. 1995; Sinkus et al. 2000; Oliphant et al. 2001; Lorenzen et al. 2002; Sinkus et al. 2005a; Sinkus et al. 2005b; Sinkus et al. 2007). MRE is a phase contrast based technique in which acoustic waves in the 100 to 1000 Hz range are applied to the tissue to be imaged and propagation of these waves are imaged using MRI. This is performed by synchronizing motion-sensitive MR imaging sequences with the application of waves. The wave can be observed at various time points by changing the timing of acquisition. These wave images can be processed to estimate the wavelength, which is converted directly to a shear modulus value, producing a shear modulus map.
Malignant invasive breast tumors showed the highest value of elasticity (approximately 15.9 kPa) and a wide range (8 and 28 kPa) of stiffness (Sinkus et al. 2007). In contrast, benign breast lesions showed low values of elasticity, which were significantly different from malignant breast tumors (~7.0 kPa), whereas, breast parenchyma (~2.5 kPa) and fatty breast tissues (~1.7 kPa) showed lowest value of elasticity (Sinkus et al. 2007). These studies document clearly the discrimination between normal, malignant and benign tumors (Lorenzen et al. 2002; Xydeas et al. 2005). MRE may overcome the limitations of manual palpation as well as increase the specificity of CEMRI (Plewes et al. 1995; Sinkus et al. 2000; Manduca et al. 2001; Oliphant et al. 2001; Sinkus et al. 2005a; Sinkus et al. 2005b; Sinkus et al. 2007). The combination of the Breast Imaging Reporting and Data System (BIRADS) categorization obtained via MR mammography with viscoelastic information may lead to a substantial rise in specificity.
Perfusion-Weighted Imaging
Proliferation of cancer requires generation of new vessels and angiogenesis for the supply of nutrients. The characteristics of these vessels are different from normal vessels like larger diameter, more permeability and lack of contractile properties (Dvorak et al. 1995; Sinha and Sinha, 2002). There are several MR methods that measure the characteristics of vessels or vascularity or tumor perfusion. Endogenous method does not use contrast agent and depend on spin labeling that essentially saturates the incoming perfusing intravascular protons (black blood) to mix with the non-saturated blood pool (Barbier et al. 2001). Zhu and Buonocore (2003) reported the use of endogenous spin labeling (also called arterial spin tagging) to examine breast tissue perfusion. Perfusion could be monitored by tracking changes in the apparent relaxation rate T2* during the first passage of the bolus. T2* is the measured loss of transverse magnetization in a GRE sequence that was due to the combined effects of the inherent spin-spin relaxation time T2 and macroscopic magnetic field inhomogeneities. In addition, the passage of a paramagnetic contrast agent induced a further shortening of T2* as it passed through the tissue microvasculature which resulted in signal attenuation from spin dephasing in regions of large magnetic field gradients (Cha et al. 2002).
Delille et al. (2002) reported the perfusion of breast lesions using echo planar sequence with increased spatial coverage and evaluation of blood volume. The first-pass perfusion imaging related directly to tumour micro-vascular perfusion and provided a direct measure of blood volume (Kuhl et al. 1997; Kvistad et al. 1999; Delille et al. 2002; Delille et al. 2005). Kuhl et al. (1997) and Kvistad et al. (1999) compared T2* images with T1 imaging of malignant tissues and showed stronger decrease in signal intensity whereas perfusion effects in fibroadenomas were minor with a high level of specificity. Increase in both blood flow and volume in tumors compared to the normal breast tissue was reported. Recently, quantification of microvascular network in various breast lesions was also reported (Furman-Haran et al. 2005). The feasibility of using a second-bolus injection to measure the regional perfusion and permeability in human breast tumors was reported by Makkat et al. (2007). A pixel-by-pixel model independent deconvolution of the relative signal enhancement was performed to estimate the tumor blood flow, tumor volume of distribution, mean transit time, extraction flow product, and extraction fraction. In malignant tumors, the parametric maps clearly delineated tumors from the normal breast tissue. Further, deconvolution gave objective parametric maps of tumor perfusion in malignant tumors. The method appeared promising to quantitatively characterize tumor pathophysiology (Makkat et al. (2007). Physiologic changes in breast during menstrual cycle were also studied using perfusion imaging (Delille et al. 2003). It was recommended that DCE MRI might be performed during first half of the menstrual cycle (days 3–14) in order to minimize interpretative difficulties related to the uptake of contrast in normal breast tissue due to hormonal functions during the menstrual cycle.
Diffusion-Weighted Imaging (DWI)
Since cellularity and other tissue properties vary in normal, malignant and benign tumors, diffusion coefficient of water in these tissues may serve as a potential parameter that could be of diagnostic value. It could also be used for assessment of therapeutic response. DWI is a promising technique in characterizing the diffusion of water molecules in tissues (Le Bihan, 1991). The microscopic thermally induced random motion of water molecules is referred to as self-diffusion or Brownian motion. The rate of water diffusion is described by the apparent diffusion coefficient (ADC); in a system of small compartments (cells) separated by semipermeable barriers (cell membranes), the ADC may largely depend on the separation of barriers.
The first report of DWI in human subjects was made by Englander et al. (1997). The normal breast tissue and the benign lesion showed significantly higher ADC than those found in malignant breast lesions (Guo et al. 2002). Differentiation between malignant and benign breast tissue was also reported (Guo et al. 2002; Woodhams et al. 2005). Sinha and coworkers (2002) used DWI for the classification of breast lesions. They showed that ADC was lower in malignant breast tumors compared to the normal tissue and benign tumors. However, cyst showed higher ADC compared to benign and malignant tissues. Reduced ADC in malignant tumors reflects the underlying histological pattern of densely packed randomly organized tumor cells, which inhibited effective motion of water molecules and restricted diffusion. ADC was also shown to correlate with tissue cellularity (Sugahara et al. 1999; Le Bihan et al. 2001).
Along with other current imaging methods, DWI improved the characterization of breast diseases and was reported to be a sensitive tool to monitor the response to therapy (Maier et al. 1997; Partridge et al. 2001; Kinoshita et al. 2002; Sinha et al. 2002; Sinha and Sinha, 2002). Increased water diffusion was observed in patients responding to therapy with chemotherapy and radiotherapy (Le Bihan et al. 2001). Manton et al. (2006) reported low sensitivity of ADC compared to T2 relaxation time and water-to-fat ratio (W-F), in predicting the early response of breast cancer patients to NACT. Recently, we also reported tumor ADC, volume and diameter in assessing the response of locally advanced breast cancer patients (n = 56) undergoing NACT at four time periods namely, prior to therapy and after I, II and III NACT (Sharma et al. 2008). Figure 2 shows the ADC map of a patient obtained prior to therapy (A) and after III NACT (B). Comparison of the percentage change in ADC, volume and diameter after each cycle of NACT between clinical responders and non-responders showed that the difference in ADC after I NACT was statistically significant compared to volume and diameter, indicating its potential in assessing the early response. After III NACT, the sensitivities for volume and diameter was 89% and 68% for ADC in differentiating responders from non-responders while the specificities were 50%, 70% and 100%, respectively. A sensitivity of 84%, specificity of 60% with an accuracy of 76% was achieved when all the three parameters were taken together to predict the response (Sharma et al. 2008). Results demonstrate ADC as a useful parameter to predict early response of tumor to NACT compared to morphological parameters, suggesting its potential in effective treatment management (Sharma et al. 2008).
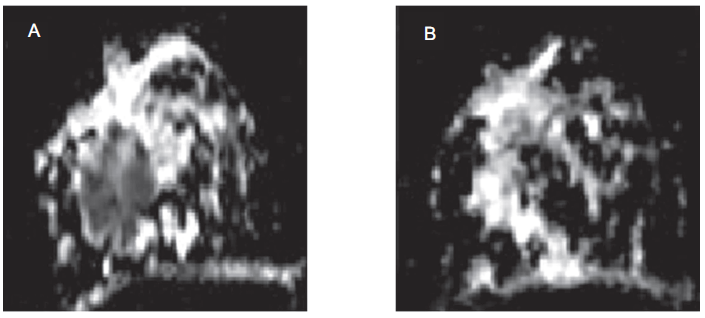
A) Transverse image showing ADC map of a patient with histopathologically proven malignant breast tumor obtained prior to therapy. The tumor is seen as hypointense area. B) Transverse image showing ADC map of the same patient after three cycles of neoadjuvant chemotherapy. The patient is a complete responder and the reduction in the hypointense area (tumor) is clearly evident on post-therapy ADC map.
MR Guided Biopsy
Recent advances in MR methodology have enabled the use of MRI guided interventions for lesion localization and core biopsy. MRI offers the advantage of identifying additional breast cancer lesions that are occult in mammography and ultrasound Most MRI vendors provide MR-compatible breast biopsy device. With this, localization of non-palpable lesions seen only on MR became easy, fast and safe especially with the use of MR-guided hook-wire placement (Kuhl CK, 2002; Lampe D et al. 2002; Perlet C et al. 2002a; Perlet C et al. 2002b; Berg WA, 2004; Daniel BL et al. 2005; Liberman L et al. 2005). MR-compatible vacuum assisted biopsy presents direct histologic proof of lesions, thus avoiding surgical interventions.
In-Vivo Magnetic Resonance Spectroscopy (MRS)
The various MRI methods outlined above provide information on the tumor extent and pathology; however the specificity of diagnosis of benign disease from malignant is still poor. In addition to protons of water and fat, tissues contain several biologically important molecules (biochemicals) that are distributed throughout. Thus tissue biochemical information may be useful for specific diagnosis in addition to anatomic details obtained from MR images. Further, biochemical (metabolic) information from a well-defined region of interest or volume element (voxel) is possible from in-vivo MR spectroscopy. Information that normally requires biopsies may now be acquired through in-vivo MRS, in a noninvasive manner.
Most in-vivo MRS studies carried out and reported in the literature on breast used either proton ( 1 H) or phosphorus ( 31 P) nucleus owing to their high natural abundance and sensitivity. 31 P MRS provided information on energy status, phospholipid metabolites, intracellular pH and free cellular magnesium concentration. Various phosphorous metabolites like phosphocreatine, inorganic phosphate, nucleotide phosphates, phosphomonoesters, and phosphodiesters were observed in 31 P MRS and their relative concentration was estimated. Several studies demonstrated high levels of phosphomonoesters, and phosphodiesters in malignant tumors compared to normal tissue (Degani et al. 1986; Leach et al. 1998; Park and Park, 2001; Ronen and Leach, 2001). The use of 31 P MRS in monitoring the response of breast tumors to chemotherapy was reviewed by Leach et al. (1998) and Ronen and Leach (2001). Decreased phosphomonoesters is associated with the response of tumor to therapy, while an increase reflects disease progression (Glaholm et al. 1989; Redmond et al. 1992; Twelves et al. 1994). Although 31 P MRS studies showed promising results, the lower MR sensitivity of detecting signal from phosphorous nuclei hampered its use in characterizing tumors. Also, 31 P MRS requires special hardware that may not be available with all clinical scanners.
1 H MRS not only offers higher sensitivity compared to 31 P, but also has the ability to provide biochemical information from a well-defined region of interest or voxel, using volume localization method. Thus in parallel to the MRI developments, several groups (Jagannathan et al. 1998; Roebuck et al. 1998; Jagannathan et al. 1999; Kvistad et al. 1999; Bakken et al. 2001; Cecil et al. 2001; Jagannathan et al. 2001; Yeung et al. 2001; Bolan et al. 2003; Jacobs et al. 2004; Stanwell et al. 2005) have explored the utility of 1 H MRS for characterizing breast cancers. In addition to water and fat, water-suppressed 1 H MRS of breast cancer patients showed choline containing compounds (tCho). MRS was shown to improve diagnostic accuracy and also as a useful technique to monitor the tumor response to therapy (Jagannathan et al. 2001). Several review articles discussed the progress made in the technical aspects, identifying lacunae, and determining the sensitivity and specificity of the MRS technique (Katz-Brull et al. 2002; Sharma and Jagannathan, 2006a; Gary et al. 2006; Sharma et al. 2006b; Stanwell and Mountford, 2007; Sardanelli et al. 2008).
Technical Considerations of 1 H MRS
The addition of in-vivo 1 H MRS protocol with the MRI procedure increases the overall acquisition time by approximately 10 minutes but has the advantage to improve the diagnostic accuracy of clinical breast MR, thus making it a more versatile and widely used technique. Most in-vivo studies were carried out at 1.5 T however, recently, there have been reports on breast MRS at 3 T (Do et al. 2006; Moy et al. 2006), 4 T [Bolan et al. 2002; Bolan et al. 2003; Bolan et al. 2004; Meisamy et al. 2004; Meisamy et al. 2005], and at 7 T (Bolan et al. 2006).
Usually the patient was positioned prone in a dedicated single or double breast coil which is either commercial or custom make with the breasts fitted into the cup of the coil. The breast was slightly compressed with cushions to reduce the motion related artifacts. T2- and T1- weighted MR images in all three orthogonal planes were acquired to localize the tumor. In cases where it was difficult to localize the tumor using conventional imaging, CEMRI was used (Jagannathan et al. 2002). It was reported that gadolinium may attenuate the sensitivity of in-vivo detection of choline containing compounds, tCho (Sijens et al. 1997). Shimming both globally and over the voxel region was necessary to achieve a good magnetic field homogeneity prior to 1 H MRS. This enhanced the probability of detecting a tCho signal in small lesions by increasing the sensitivity. Additionally, a good water and fat suppression further improved the detection of tCho resonance.
Two types of localization schemes are in use: single-voxel spectroscopy (SVS) and multi-voxel MRS [referred as chemical-shift imaging (CSI) or MR spectroscopic imaging (MRSI)]. SVS methods produce signal from a single volume of interest, while MRSI methods acquire signal from a large volume but sub-encode it using phase encoding techniques, as in MR imaging. Applying a Fourier transform over the phase encode direction(s) produced a grid of spectra. By measuring the amplitude of a peak in each box of the grid, an image is generated for each peak in the spectrum. Such metabolite maps are useful, but the CSI acquisition methods are time consuming and sensitive to artifacts.
Most breast MRS studies so far have used SVS method centered on the lesion of interest. The two most commonly used sequences were double spin echo (PRESS) and the stimulated echo acquisition mode (STEAM) with echo times ranging from 30 ms to 270 ms. The disadvantage of using STEAM sequence is the loss of 50% signal compared to that obtained using PRESS sequence at the same TE. The proton spectrum without water suppression provides information on water and fat and the W-F ratio can be calculated (Sijens et al. 1988; Jagannathan et al. 1998). The water-suppressed spectrum provides information on the Cho containing metabolites, which is considered as biochemical marker of malignancy (Jagannathan et al. 1998; Roebuck et al. 1998; Jagannathan et al. 1999; Cecil et al. 2001; Yeung et al. 2001; Katz-Brull et al. 2002; Sharma and Jagannathan, 2006a; Gary et al. 2006; Stanwell and Mountford, 2007; Sardanelli et al. 2008; Sharma et al. 2008. The short echo time MRS may be used to obtain high signal intensity of tCho resonance but in breast tissue long echo times (TE ≥ 135 ms) are preferred for better detection of the composite choline signal from the huge lipid signal (Jagannathan et al. 1999; Yeung et al. 2001).
Role of Water-Fat Ratio (W-F) in Diagnosis and Therapy Monitoring
Sijens et al. (1988) were the first to report the breast MRS using a surface coil and observed that the W-F ratio was high in breast cancer patients compared to normal volunteers. Later several studies reported the use of SVS to study the changes in water and lipid content of breast tissue during malignant transformation and benign condition (Jagannathan et al. 1998; Kumar et al. 2006). Normally the W-F ratio was calculated from the respective peak areas of water (4.7 ppm) and the major lipid peak (1.33 ppm) from the in-vivo 1 H MR spectrum acquired without water-suppression (Jagannathan et al. 1998; Jagannathan et al. 1999; Kumar et al. 2006). Normal breast tissues showed high fat content while the tumor tissue showed higher water content (Sijens et al. 1988; Jagannathan et al. 1998; Kumar et al. 2006). Changes in lipid content were also found to be associated with tumor development and progression (Thomas et al. 2001). However, W-F ratio of benign and malignant tissues was not significantly different due to substantial overlap of the values and has limited utility in diagnosis (Jagannathan et al. 1998; Roebuck et al. 1998; Jagannathan et al. 1999; Kvistad et al. 1999).
W-F ratio was also demonstrated to be useful in monitoring the effect of chemotherapy on tumors. In patients receiving chemotherapy, reduction of W-F ratio was reported in association with the reduction of primary tumor size indicating its use as a noninvasive indicator of favorable clinical outcome of chemotherapy (Kumar et al. 2006). Recently, Thomas et al. (2001) reported the use of localized 2D COSY (correlated spectroscopy) experiments in the evaluation of W-F ratio using 2D spectral peak volumes.
Total Choline (tCho) in Diagnosis and Therapy Monitoring
The water suppressed in-vivo 1 H MR spectrum acquired from malignant breast lesion is characterized by an intense peak at 3.22 ppm corresponding to several Cho containing compounds. Several studies over the past decade documented that tCho is specific to malignancy and can be used to differentiate cancerous from benign tissues (Jagannathan et al. 1998; Roebuck et al. 1998; Jagannathan et al. 1999; Cecil et al. 2001; Yeung et al. 2001; Jagannathan et al. 2001; Katz-Brull et al. 2002; Gary et al. 2006; Stanwell and Mountford, 2007; Sharma et al. 2008; Sardanelli et al. 2008). A meta-analysis by Katz-Brull et al. (2002) showed the overall combined sensitivity and specificity of MRS as 83% and 85%, respectively. A sensitivity of 100% and a specificity of 89%–100% in detecting malignancy from benign lesions in younger patients (≤40 years of age) was reported using MRS technique (Roebuck et al. 1998; Cecil et al. 2001; Yeung et al. 2001). Recently, the potential of MRSI in breast cancer was also evaluated (Jacobs et al. 2004; Jacobs et al. 2005). The advantages of MRSI over SVS include the ability to assess multiple lesions and tissues with normal appearance, as well as to distinguish lesion borders and infiltration into the surrounding tissues (Baik et al. 2005; Hu et al. 2005). Figure 3 shows the breast tumor and the MRSI grid (A) of a patient suffering from infiltration ductal carcinoma while (B and C) shows the MR spectrum obtained from a voxel from the normal portion of the breast and from a voxel positioned inside the tumor, respectively.
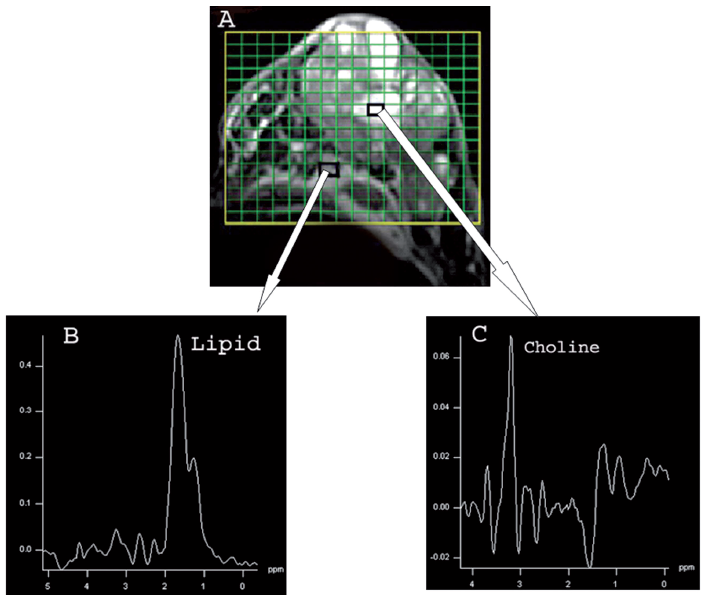
A) Transverse fat suppressed T2 weighted MR image of a patient with histopathologically proven malignant breast tumor showing hyperintense breast tumor. The MRSI grid encompasses the normal and tumor area of breast with small rectangles showing the voxels. B) Shows the MR spectrum obtained from a voxel from the normal portion of the breast. C) Shows the MR spectrum obtained from a voxel positioned inside the tumor.
Several choline containing compounds like phosphocholine (3.21 ppm), glycerophosphocholine (3.28 ppm), and free choline (3.19 ppm), contribute to the peak observed at 3.2 ppm in-vivo (Sitter et al. 2002). It was suggested that the elevation of the tCho in tumor cells is related to the increased synthesis of cellular membranes (Ruiz-Cabello and Cohen, 1992). However, recent in-vitro 1 H and 13 C MRS study reported increase in both the biosynthetic pathway governed by choline kinase and the catabolic pathways governed by specific phospholipase contribute to elevated tCho in tumors (Glunde et al. 2004).
Detection of choline from the normal breast tissue of lactating women was also reported (Kvistad et al. 1999; Jagannathan et al. 2001; Stanwell et al. 2005). Stanwell et al. (2005) reported the need for post processing procedures that optimized the spectral resolution. The central frequency of the tCho peak at 3.22 ppm was shown due to phosphocholine in cancer patients, whereas in volunteers the central frequency was at 3.28 ppm perhaps due to glycerophosphocholine (Stanwell et al. 2005). By recognizing the shift of 0.06 ppm of the central frequency, specificity could be improved from 80% to 100% (Stanwell et al. 2005).
Two-Dimensional (2D) in-Vivo MRS
Single voxel 1D spectroscopy method was used in most breast MRS studies reported in the literature. The major drawback of 1D MRS is the overlap of dominant lipid peak with other metabolites. In order to alleviate, Thomas and co-workers used localized 2D correlation spectroscopy methodology (Thomas et al. 2001; Thomas et al. 2005). It was reported that due to an added dimension, a localized 2D MR spectrum showed better resolution than a conventional 1D MR spectrum. They characterized invasive ductal carcinoma and healthy fatty breast tissues non-invasively using the classification and regression tree analysis of 2D MR spectral data. 2D L-COSY spectra were acquired in 14 invasive breast carcinoma and 21 healthy fatty breasts at 1.5 T. 2D L-COSY spectra were recorded in a total of 43 voxels. Five diagonal and six cross peak volumes were integrated and at least eighteen ratios were selected as potential features for the statistical analysis using CART. The 2D L-COSY data showed a significant increase for the majority of these ratios in invasive breast carcinomas compared to healthy fatty tissues. Better accuracy of identifying carcinomas and fatty tissues was reported using classification and regression tree analysis of different combinations of ratios calculated from the relative levels of water, choline, saturated and unsaturated lipids. 2D L-COSY spectra provide less ambiguous information than one-dimensional spectra, including the relative levels of saturated, unsaturated fatty acids and choline pool. Further studies are required to evaluate this promising technique (Thomas et al. 2001; Thomas et al. 2005).
Quantification of tCho
tCho Signal-to-Noise Ratio (SNR)
Several researchers showed the observation of choline signal in some benign and normal breast tissues. Thus there is a requirement for accurate quantification of choline in contrast to qualitative assessment of relying on the presence or absence of tCho resonance for the differentiation of malignant and benign lesions. Several researchers reported the use of semi-quantitative method of estimating tCho by calculating the signal-to-noise ratio (SNR). Typically, SNR was measured using the peak intensity (height) of Cho signal and the noise intensity in an off-resonance region of the spectrum by using the formula SNRCho = amplitude of Cho resonance/RMS amplitude of noise. In a recent study, 244 patients were investigated at 1.5 T with dynamic MRI with high spatial resolution (Sardanelli et al. 2008). Of these, 124 patients showed enhanced foci and 1 H MRS was performed for these lesions (Sardanelli et al. 2008). A thresh-old SNRCho value ≥ 1.9 was used for the diagnosis of malignancy that gave 90% sensitivity (equal to the value obtained with dynamic MRI) with a specificity of 89% (compared with 81% obtained using dynamic MRI). If lesions less than 1 cm were excluded then 97% sensitivity was achieved (Sardanelli et al. 2008). Bartella et al. (2006) evaluated MRS of 56 patients (suspicious lesions on MRI or biopsy proven cancers) with histology as the reference standard (Bartella et al. 2006). MR spectroscopy findings were defined as positive if the SNRCho value was ≥ 2. The study showed the feasibility of incorporating proton MRS into breast MR imaging studies of lesions approximately 1 cm or larger in size.
Recently, Baek et al. (2008) investigated the application of CSI for characterizing human breast lesions at 1.5T, and evaluated the diagnostic performance using ROC (receiver operating characteristics) analysis. Thirty-six patients with 27 malignant and 9 benign lesions were investigated using DCEMRI and CSI. The highest accuracy was found when the SNRCho was >3.2. The mean SNRCho was 2.8 ± 0.8 (range, 1.8–4.3) for the benign group and 5.9 ± 3.4 (2.1–17.5) for the malignant group (p = 0.01). Based on the criterion of SNRCho > 3.2 as malignant, CSI correctly diagnosed 22 of 27 malignant lesions and 7 out of 9 benign lesions, resulting in 81% sensitivity and 78% specificity with an overall accuracy of 81%. If the criterion was set higher (SNRCho > 4.0), the specificity improved to 89% but with lower sensitivity of 67% (Baek et al. 2008). Recently, our group also reported preliminary findings on the use of SNR measured using MRSI method for monitoring the tumor response to therapy (Danishad et al. 2006).
Absolute tCho Concentration Determination
Instead of semi-quantitative assessment using SNRCho, methods to determine the absolute concentration of tCho were also developed using external referencing and internal water referencing. Roebuck et al. (1998) reported the concentration of tCho in the range of 0.7–2.1 mM using external referencing method. Meisamy et al. (2005) quantified the concentration of tCho compounds in breast lesions (n = 55) using SVS. In conjunction with MR imaging features like morphology and contrast enhancement, they showed that the MRS data showed higher sensitivity, specificity, accuracy, and inter-observer agreement. In a recent study Baik et al. (2006) reported choline concentration at 1.5 T using water peak as an internal reference. The concentration of choline was reported to be in the range of 0.76–21.2 mmol/kg in malignant lesions. The use of internal reference method overcomes some of the limitations of the external reference method like the need for correction for partial volume effect and separate calibration experiments. It also showed promise for increasing the specificity of MRS.
Therapy Monitoring Using tCho
The potential of MRS to monitor treatment response in patients receiving therapy was reported by Jagannathan et al. (2001). They observed that the presence of tCho before treatment and its reduction/absence after treatment may serve as a useful indicator of response. Meisamy et al. (2004) showed that changes in tCho occur within 24 hours of administering chemotherapy that correlated positively to lesion size changes and showed potential as a predictor of therapeutic response.
Limitations
There are several limitations of in-vivo MRS and the major one is related to sensitivity due to which it is difficult to acquire the spectrum from small lesions. Another limitation is the difficulty to observe other biochemicals which may be of value in the characterization of breast lesions due to the dominant peaks from fat and water. However, improved detection of tCho signal is possible using simultaneous suppression of both the water and lipid signals (Bolan et al. 2003; Baik et al. 2006). Saturation method is applied for lipid/water signal reduction. The transverse magnetization is dephased selectively before and after the second slice selective 180° spin-echo pulse. This dephasing is defined to affect both the water and lipid signals from 0.7 to 2 ppm, following the procedure of Mescher et al. (1996). Further, differentiating the responders and non-responders using tCho as criterion during the course of therapy, especially in responding tumors where the concentration of tCho is reduced, is difficult due to poor sensitivity and specificity. MRS at high fields can improve the quality and utility due to increased sensitivity and spectral resolution and the use of smaller voxel size (Hoult and Phil, 2000; Vaughan et al. 2001).
Future Directions
Today mammography is the only established modality for population based screening. However, advances in ultrasonography, MRI and other nuclear imaging techniques like positron emission tomography have the potential to improve the specificity of breast imaging with regard to cancer detection. Currently MRS and MRI are complementary methodologies to histology, mammography and other accepted techniques. The focus of future studies should be on the population of women at high risk for whom there is no clear recommendations for care. Studies at various centers have demonstrated that MRI is a powerful imaging modality that can detect cancers that are occult on both clinical examination and mammography. There is need for international guidelines and appropriate clinical recommendations for screening women in order to decrease morbidity and mortality in high risk women.
Breast MRS is not routinely performed as part of a breast MRI examination in many centers, because it is technically challenging and takes extra time. However, it provides complementary information that is valuable. Results obtained to date indicate that the sensitivity of MRS may be limited by various technical factors rather than by intrinsic properties of the tumors. However, recent advances in technological developments, such as quantitative MRS methods, high-field MR systems, increasing the design and sensitivity of breast coils and developing better magnetic field shimming have the potential for improving the accuracy and precision of breast MRS. Further to reduce motion related artifacts the use of respiratory-gated pulse sequences may be evaluated. Use of metabolic imaging will also allow exploration of tumor heterogeneity and characterization. The sensitivity and specificity of in vivo MR particularly for small lesions needs to be improved before MRS can be incorporated into clinical practice.
Abbreviations Used
magnetic resonance imaging;
magnetic resonance spectroscopy;
contrast enhanced MRI;
dynamic contrast enhanced MRI;
diffusion-weighted imaging;
neo-adjuvant chemotherapy;
apparent diffusion coefficient;
phosphorus MRS;
proton MRS;
magnetic resonance spectroscopy imaging;
total choline;
water-to-fat ratio;
one-dimensional;
two-dimensional;
single voxel spectroscopy;
signal-to-noise ratio;
choline signal-to-noise ratio;
magnetic resonance elastography;
correlated spectroscopy;
stimulated echo acquisition mode;
point resolved spectroscopy;
national cancer registry programme.
Disclosure
The authors report no conflicts of interest.
Footnotes
Acknowledgements
The authors thank Profs. G.K. Rath, P.K. Julka, A. Srivastava, S.D Gupta, Rajinder Parshad, V. Seenu, S. N. Dwivedi, Raju Sharma, Dr. Mahesh Kumar and Mr. K.A. Danishad for their help and for many fruitful discussions. Dr. Raju Sharma is thanked for providing material for ![]() . The Department of Science and Technology, Government of India, is acknowledged for financial support (SP/S0/B27/95, SP/S0/B21/2001and SP/S0/HS-80/2006).
. The Department of Science and Technology, Government of India, is acknowledged for financial support (SP/S0/B27/95, SP/S0/B21/2001and SP/S0/HS-80/2006).