
Abstract
A major goal of this pilot study was to quantify intramyocellular lipids (IMCL), extra-myocellular lipids (EMCL), unsaturation index (UI) and metabolites such as creatine (Cr), choline (Ch) and carnosine (Car), in the soleus muscle using two-dimensional (2D) localized correlated spectroscopy (L-COSY). Ten subjects with type 2 diabetes (T2D), controlled by lifestyle management alone, and 9 healthy control subjects, were studied. In T2D patients only, the following measurements were obtained: body mass index (BMI); waist circumference (WC); abdominal visceral and subcutaneous fat quantified using breath-held magnetic resonance imaging (MRI); a fasting blood draw for assessment of glucose, insulin, and estimation of homeostasis model assessment of insulin resistance (HOMA-IR), HbA1c, and high-sensitivity c-reactive protein (hs-CRP). Analysis of the soleus muscle 2D L-COSY spectral data showed significantly elevated IMCL ratios with respect to Cr and decreased IMCL UI in T2D when compared to healthy subjects (P < 0.05). In T2D subjects, Pearson correlation analysis showed a positive correlation of IMCL/Cr with EMCL/Cr (0.679, P < 0.05) and HOMA-IR (0.633, P < 0.05), and a non-significant correlation of visceral and subcutaneous fat with magnetic resonance spectroscopy (MRS) and other metrics. Characterization of muscle IMCL and EMCL ratios, UI, and abdominal fat, may be useful for the noninvasive assessment of the role of altered lipid metabolism in the pathophysiology of T2D, and for assessment of the effects of future therapeutic interventions designed to alter metabolic dysfunction in T2D.
Keywords
Introduction
The epidemic of type 2 diabetes (T2D) in the United States continues to worsen. The Centers for Disease Control and Prevention predict that T2D in the US will triple by 2050. 1 Muscle is the primary tissue contributing to whole body insulin-mediated glucose disposal and it is thought that changes in muscle mass and function may be an important factor in the pathogenesis of insulin resistance and the development of T2D.2,3 Findings in the last decade have increasingly emphasized the importance of ectopic lipid deposits such as intramyocellular lipids (IMCL), both in the development of insulin resistance4,5 and as a part of the pathology of T2D.6,7
Given that the primary source of lipid fuel for skeletal muscle is free fatty acids (FFA), IMCLs serve as a source of energy while extramyocellular lipids (EMCL) act as more of a long-term source of energy. 8 The mechanisms by which these fuel compartments contribute to changes in glucose homeostasis is currently a topic of concerted investigation.9–11 IMCL characteristics are modulated by the degree to which dietary saturated fatty acids are altered by desaturase enzymes to produce increased levels of unsaturated fatty acid. Decreased saturation status of IMCL has been suggested to have a significant physiological impact on insulin sensitivity, as it has been observed in obese individuals. 12 Since insulin sensitivity plays a crucial role in pathological T2D, an alteration in IMCL content and the degree of IMCL unsaturation may have important clinical consequences. Hence, non-invasive quantification of IMCL and its unsaturation in vivo could be a useful tool in examining both the physiologic basis of alterations in insulin sensitivity and responses to therapeutic interventions.
Spatially resolved one-dimensional (1D) magnetic resonance spectroscopy (MRS) enables the quantitation of several metabolites, including creatine/phosphocreatine (Cr/PCr), choline groups (Ch), carnosine (Car), IMCL and EMCL2,13–17. Since IMCL are stored in spheroid droplets in muscle cells adjacent to mitochondria, the proton density or protein concentration in IMCL is larger than those in EMCL, which are distributed over large regions of muscle fascia. At a typical volume size of approximately 8 mL used by the single-volume (SV)-based 1D MRS, the overlap of EMCL and IMCL severely hinders the accurate quantification of IMCL alone. Using 1D MRS techniques, techniques, IMCL and EMCL ratios are currently calculated using the polymethylene and methyl groups of overlapping saturated and unsaturated lipid spectral peaks. Therefore, 1D MRS methods cannot accurately determine differences in the saturated and unsaturated groups in IMCL.13–17 In contrast, two-dimensional (2D) L-COSY can unambiguously resolve the saturated and unsaturated peaks of IMCL and EMCL as well as those of metabolites such as Cr, Ch, Car, etc. This technique can provide a quantitative measure of ratios of IMCL and EMCL and lipid unsaturation in vivo.12,18–21
Furthermore, significant changes in intrahepatic triglyceride biochemical composition (with a decline in fatty acid length and saturation independent of changes in triglyceride content) have been shown to be associated with increased hepatic insulin sensitivity. 22 Since the 1980s, subcutaneous intraperitoneal and visceral adipose tissue (VAT) compartments have been investigated using computed tomography (CT) and MRI. 23 Using these two imaging modalities, VAT and abdominal subcutaneous adipose tissue (SAT) have been differentiated in each slice and the accuracy assessed against autopsy in humans.23,24 MRI has been the preferred abdominal lipid imaging method due to the ionizing radiation concerns inherent in CT use. Initially, Dixon's two-point “in and out of phase” chemical shift imaging (CSI) was used to create separate images of water and fat which exploited their chemical shift differences. 25 This was modified later to a three-point method which took into account B0 field inhomogeneities.26–28
In the present study, we investigated the following: (i) 2D L-COSY to record soleus muscle IMCL, EMCL, and unsaturation of lipids and metabolites (ii) breath-held, abdominal MRI to test the hypothesis that the IMCL, EMCL, and degree of lipid unsaturation index (UI) and abdominal fat content reflect the lipid-metabolic derangements associated with T2D.
Methods
Subject characteristics + .
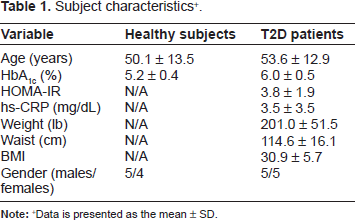
Data is presented as the mean ± SD.
Nine of these subjects were healthy volunteers with no history or record of treatment for T2D and an HbA1c% < 5.5%. Other exclusions were as described above. Written informed consent was obtained from all participants, the project was approved by the UCLA Institutional Review Board, and the study procedures were carried out in accordance with the principles of the Declaration of Helsinki, as revised in 2000.
MRI and 2D L-COSY were performed on a 3T MRI scanner (Siemens Medical Solutions, Erlangen, Germany) with Trio-Tim technology. For abdominal imaging, 6-element body matrix and 6-element spine matrix coil was used. After the initial localizer scans, standard T1-weighted spin-echo imaging was performed with respiratory compensation. The parameters employed were as follows: TR/TE = 96/1.85 ms; field of view (FOV) = 500 mm; flip angle = 70°; parallel acceleration factor (GeneRalized Autocalibrating Partially Parallel Acquisitions— GRAPPA) = 2; bandwidth = 500 Hz/pixel; acquisition matrix = 256 × 256; averages = 1; and slice thickness = 10 mm. A total of 20–25 slices were acquired between vertebral levels T12 and L5.
Subsequently, the subjects underwent soleus muscle spectroscopy using the 2D L-COSY sequence employing two echoes: a spin echo and a coherence transfer echo.18,19 As shown in Figure 1, the volume of interest (VOI) of 30 × 30 × 30 mm3 was localized with a 90°–180°–90° radio-frequency (RF) pulse train, in combination with appropriate B0 crusher gradient pulses used around the second 180° and third 90° pulses. An incremental period for creation of the second dimension was inserted immediately after the formation of the spin echo. A repetition time (TR) of 2000 ms was employed and minimal echo time (TE) was 30 ms. Along the second spectral dimension, fifty incremental time steps were performed using Δt1 = 0.8 ms, resulting in a spectral bandwidth of 1250 Hz. The signals for each incremental period were averaged over 8 scans and the total acquisition time for the scan was approximately 13 minutes. The acquisition dimension (t2) had a bandwidth of 2000 Hz with 1024 complex points for acquisition. A circularly polarized (CP) extremity coil (Siemens Medical Solutions, Erlangen, Germany) was used for data acquisition as well as for RF pulse transmission. A WET module was used for global water suppression.
29
A T1-weighted spin-echo axial MRI showing the voxel location used for acquiring 2D L-COSY.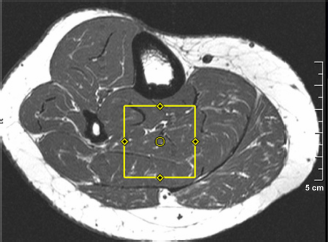
Abdominal fat distribution was determined by a Java based fuzzy c-means (FCM) clustering fat-segmentation program running on a PC. 30 At each MR image slice level, fat pixel signal intensity was segmented and used to determine the total abdominal fat, the total adipose tissue (TAT), for the slice. For VAT and SAT, a region of interest (ROI) was drawn just below the SAT and all white pixels were set to zero inside this ROI, thus giving the SAT. The VAT was calculated by the formula VAT = TAT - SAT. Volume of adipose tissue was computed by multiplying the pixels with pixel size and slice thickness.
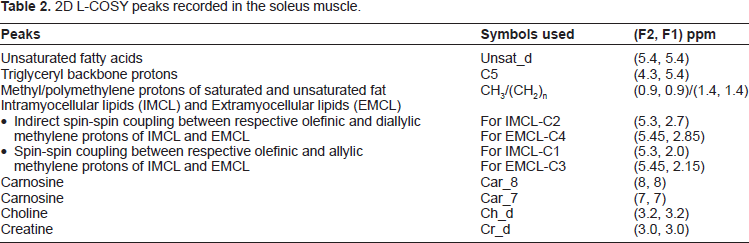
2D L-COSY peaks recorded in the soleus muscle.
Quantitative demographic and laboratory data were presented as mean ± standard deviation (SD). To quantify the differences between subjects with T2D and healthy controls, quantitative (demographic/ anthropometric/laboratory variables) were compared using a Student's t test. Otherwise, the entire data were managed in a Microsoft excel worksheet and statistical analysis was performed using SPSS 15.0. Pearson's correlation analysis was performed to compute correlation coefficients between various anthropometric and biochemical parameters. A P value of less than 0.05 was considered statistically significant.
Results
A 2D L-COSY spectrum recorded from the soleus muscle of a 66 year old diabetic subject is shown in Figure 2. Different locations were identified and quantified for 2D L-COSY peaks of unsaturated fatty acids, methyl/polymethylene protons of saturated/unsaturated fat, triglyceryl backbone protons, choline, creatine and carnosine, as given in Table 2. The 2D cross peaks from EMCL2 (5.5, 2.2) and IMCL2 (5.2, 2.0) arise from indirect spin-spin J-coupling between olefinic and allylic methylene protons; EMCL1 (5.5, 2.9) and IMCL1 (5.2,2.7) arise from indirect spin-spin coupling between respective olefinic and diallylic methylene protons of EMCL and IMCL. The pilot 2D L-COSY findings in the ten T2D and nine healthy subjects are summarized in Figure 3. Significantly increased IMCL and EMCL ratios and decreased unsaturations indices were observed in T2D subjects. The Car_8 and Car_7 ratios were also significantly increased in T2D compared to healthy subjects. There was a non-significant change in Ch/Cr between the two groups.
A 2D L-COSY spectrum recorded from the soleus muscle of a 65 year old diabetic subject.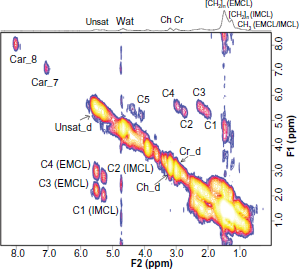
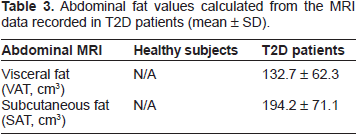
Abdominal fat values calculated from the MRI data recorded in T2D patients (mean ± SD).
Pearson's correlation coefficients calculated from the T2D data [r (P value)].
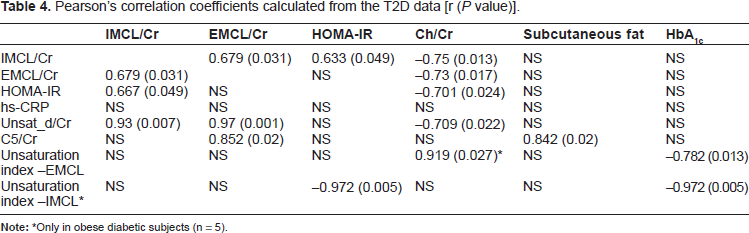
Only in obese diabetic subjects (n = 5).
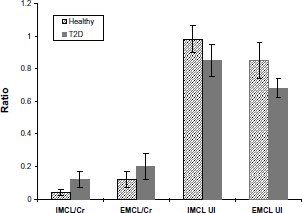
2D L-COSY findings in T2D compared to healthy subjects (mean ± SD). All four ratios were significantly different (p<0.05).
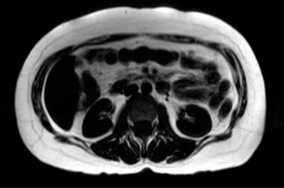
T1-weighted Spin-echo axial MR slice image from the breath-hold water-suppressed fat data of a diabetic patient.
Discussion
As demonstrated previously in healthy lean and obese subjects,12,21 2D L-COSY is unique in that, unlike 1D MRS, it separates the contribution of olefinic protons within the IMCL and EMCL pool, thus providing both a measure of the IMCL and EMCL ratio and the degree of the unsaturation of these lipid pools. The UI provides a relative measure of unsaturated lipids (monounsaturated and polyunsaturated) in the respective pools. The present study utilized 2D L-COSY to demonstrate that well-controlled T2D subjects not on anti-diabetic medications exhibit significantly higher IMCL and EMCL ratios (/Cr) as well as lower levels of IMCL and EMCL unsaturation indices in soleus muscle, relative to healthy controls. Thus, our study findings suggest that even in well-controlled T2D patients, both lipid content and lipid unsaturation are altered.
Contribution of IMCL in the pathogenesis of skeletal muscle insulin resistance was previously explored by Jacob et al. 7 Their study containing a group of 280 first-degree relatives of T2D patients, 13 lean insulin-resistant, and 13 lean insulin-sensitive subjects reported increased IMCL in the soleus (84%) and the tibialis anterior by 57% in the insulin-resistant offspring, whereas the EMCL and total muscle lipid content were not significantly different between the two groups. Another study by Sinha et al. Reported that the IMCL in the soleus muscle and CRP and insulin resistance were significantly higher in T2D patients compared to healthy controls. 14 Using MRS, another recent study by Petersen et al reported reversal of muscle insulin resistance by weight reduction in young, lean, insulin resistant offspring of parents with T2D. 2
The basis for the decreased IMCL and EMCL unsaturation in the T2D patients observed in the present study might be due in part to a process similar to the increased lipid peroxidation that has been observed in obese individuals. 31 Haugaard et al noted that intramyocellular triacylglycerol (IMTG) content varied inversely with IMTG saturation. 32 It has been noted that in obese individuals total intramuscular triglyceride content correlates inversely with the amount of intramuscular saturated fatty acid, noted on biopsy due to a lower level of in situ desaturation and resulting from decreased stearoyl-CoA desaturase-1, which is hypothesized to affect insulin sensitivity and glycemic control. Reactive oxygen species can induce this type of lipid oxidative damage, and their generation in mitochondria has been reported to be increased in T2D patients. 33 Moreover, the higher levels of IMCL in T2D might lead to increased lipid diffusion into mitochondria, 34 potentially disrupting normal myocellular glucose metabolism and contributing to insulin resistance. Regarding the composition of the IMCL, there has been controversy regarding the potential role of specific bioactive lipid metabolites such as long chain-fatty acyl-coenzyme A, 35 diacylglycerol (DAG) 36 and sphingolipids (including ceramides), in the pathogenesis of insulin resistance.37,38 Desaturation of saturated fatty acids involves the conversion of (–CH2–CH2–) groups to (–CH=CH–) by a family of desaturase enzymes. Thus, the level of unsaturation may play an important role in the physiological activity of IMCL and EMCL.
Furthermore, it has been suggested that the lipid composition of the EMCL exerts a paracrine influence on skeletal muscle membrane fatty acids, which in turn may alter lipid species within the myocyte and accelerate the progression of insulin resistance. 39 In fact, the EMCL has been hypothesized to contain less polyunsaturated FFA and more saturated FFA and trans fat (unsaturated FFA) species. 40 Increased trans-membrane passage of these FFA species, as well as the production of adipokines and cytokines by neighboring adipocytes, may alter the desaturation status of the IMCL lipids. Thus, additional study is required to determine how changes in the composition of the IMCL and EMCL relate to alterations in the pathway between insulin resistance and T2D. 14
Our abdominal MRI analysis did not show significantly higher SAT volume than that of VAT in T2D subjects, as shown in Table 3. A recent study by Li et al using 10 sedentary, non-diabetics, and non-obese subjects, 5 of which were insulin resistant and the other 5 insulin sensitive, showed significant correlation of the VAT volume with IMCL. 41 In this study, there was a positive correlation only of the subcutaneous fat of T2D with the triglyceryl backbone protons ratio (C5/Cr) recorded from the 2D L-COSY of the soleus muscle.
A limitation of the present study is that it was cross sectional. While we noted significant differences in the ratio of IMCL/Cr and unsaturation indices of T2D patients relative to healthy subjects, longitudinal studies will be required to determine whether the changes in the ratios of IMCL and EMCL and UI observed in our present study are of primary importance in the development of insulin resistance and progression to T2D.
In summary, while 2D L-COSY has previously been used to assess myocellular saturated and unsaturated lipid components 21 in obese versus normal subjects, 12 in our current study we utilized this technique to examine the status of these components in subjects with T2D. We noted significant differences in the IMCL and EMCL content, as well as UI of IMCL and EMCL, between healthy subjects and T2D patients when using 2D MRS. Accordingly, it is likely that 2D MRS quantification and characterization of IMCL and EMCL unsaturation will be a useful technique for future studies designed to noninvasively assess the role of altered muscle lipid metabolism in the pathophysiology of T2D. Additionally, it will serve in the evaluation of the effects of therapeutic interventions in T2D. Given the significant role that insulin resistance plays in the pathophysiology and progression of T2D, understanding the role of the UI as a surrogate of these changes, which can be determined noninvasively, will allow utilization of the UI as a means to examine the mechanisms of responses to therapeutic interventions.
Author Contributions
Conceived and designed the experiments: MAT and PS. Analysed the data: AS, NW, RN and MAT. Wrote the first draft of the manuscript: PS and AS. Contributed to the writing of the manuscript: MAT. Agree with manuscript results and conclusions: PS, MAT, AS, CL, TH, NW, RN and CR. Jointly developed the structure and arguments for the paper: PS, MAT, AS, CL, TH, NW, RN and CR. Made critical revisions and approved final version: MAT, CL, TH and CR. All authors reviewed and approved of the final manuscript.
Funding
This work was partially funded by two UCLA intramural grants: The UCLA Clinical and Translational Science Institute (NIH grant#1UL1RR033176) and Radiology intramural Seed grant. CKR was supported during this project by the National Heart, Lung and Blood Institute (P50HL105188) and the National Institute of Diabetes and Digestive and Kidney Diseases (DK090406).
Competing Interests
Author(s) disclose no potential conflicts of interest.
Footnotes
Acknowledgements
The authors would like to acknowledge Dr. Rakesh Gupta and co-workers in India for assistance with the MRI protocol implementation, and Mr. Anthony Sosa for assistance with the diabetic subject recruitment.
As a requirement of publication author(s) have provided to the publisher signed confirmation of compliance with legal and ethical obligations including but not limited to the following: authorship and contributorship, conflicts of interest, privacy and confidentiality and (where applicable) protection of human and animal research subjects. The authors have read and confirmed their agreement with the ICMJE authorship and conflict of interest criteria. The authors have also confirmed that this article is unique and not under consideration or published in any other publication, and that they have permission from rights holders to reproduce any copyrighted material. Any disclosures are made in this section. The external blind peer reviewers report no conflicts of interest.