
Abstract
This article reviews a new concept in magnetic resonance as applied to cellular and biological systems. Diffusion weighted magnetic resonance imaging can be used to infer information about restriction sizes of samples being measured. The measurements rely on the apparent diffusion coefficient changing with diffusion times as measurements move from restricted to free diffusion regimes. Pulsed gradient spin echo (PGSE) measurements are limited in the ability to shorten diffusion times and thus are limited in restriction sizes which can be probed. Oscillating gradient spin echo (OGSE) measurements could provide shorter diffusion times so smaller restriction sizes could be probed.
Keywords
Introduction
This short invited article reviews diffusion techniques used to infer sizes of structures in samples that lead to restricted diffusion. It briefly explains the time dependence of the MRI-measured apparent diffusion coefficient. Then it explains how the time dependence is used to infer sizes of structures, such as axon diameters, in the sample. It then discusses the limitations of current methods inferring small sizes and briefly explains one possible alternative to overcome these limitations.
Diffusion
Molecules in a liquid undergo diffusion. Their mean square displacement depends on the diffusion time, Δ, as described by Einstein's relation <r 2 > = 2DΔ (in one dimension) where D is the diffusion coefficient. 1 Molecules diffusing in a uniform medium with no barriers experience unrestricted diffusion. In non-uniform media (eg, porous samples and cellular tissues) barriers restrict molecular displacements so that the diffusion depends on the time scale of the study and the permeability of the barriers. Assuming Einstein's relation, <r 2 > during the time Δ can be used to find an apparent diffusion coefficient (ADC) that is less than D because of restrictions or hindrances to motion. Understanding the influence of the restrictions or hindrances on the ADC gives information about the geometry of the boundaries of the surrounding medium which, for MRI, could be tissues, rocks, concrete, cement, polymers, gases, etc. 2
As an example, the ADC in a simple system consisting of molecules with diffusion coefficient D that are entirely restricted to a single pore of diameter a will depend on Δ. For Δ < a 2 /(2D), the diffusion will appear almost unrestricted. For Δ ≫ a 2 /(2D), all molecules, regardless of their starting position, will be found anywhere in the pore. 3 Measurements as a function of Δ thus provide information about the structure in which the molecules are diffusing. Specifically, there will be a change in the ADC when measuring through the time Δ = a 2 /(2D) which can be used to determine the pore size.
Traditional MR measurements of the ADC in different samples use the Pulsed Gradient Spin Echo (PGSE) sequence,
4
see Figure 1. After excitation, a magnetic field gradient pulse is applied to the sample for a short time. This causes the spins to obtain a phase based on their position at the time of the pulse. A π RF pulse is then applied to the system which reverses the phase of the spins. Another identical gradient pulse is applied to the sample which changes the phase of the spins based on their position at the time of the second pulse (Δ). If no diffusion has occurred, the phase acquired from the second pulse will be equal and opposite to the phase of the spin just before the pulse, resulting in a net phase of zero. If diffusion occurs, the mean squared phase of all spins will be nonzero and cause a loss in MR signal which can be used to calculate the ADC.
4
Pulsed gradient spin echo (PGSE) sequence. The basic PGSE sequence consists of two RF pulses, shown in blue, and two gradient pulses, shown in black. The diffusion time, Δ, is the time from the start of the first gradient pulse to the start of the second gradient pulse.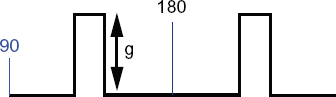
Alternatively, Callaghan proposed q-space imaging using PGSE with short gradient pulses to measure the conditional probability, P(r'–-r, Δ), that a spin initially at r has migrated to r’ over the time Δ. By measuring the signal as a function of gradient strength, one can calculate the probability distribution of displacements of spins. 5 Using this probability distribution, one can infer from MR images tissue geometric information, such as axon diameter distributions and axonal and cellular volume fractions or densities.5–9 It is difficult, however, to find P in white matter because of the variability of axon diameter. 2
In vivo measurements using echo planar imaging (EPI) sequences are used to acquire images more rapidly. 2 This allows full diffusion tensor imaging (DTI) in vivo although the resolution is often not as good as standard imaging sequences. 10 Perfusion can also be measured using MRI and the effects of perfusion on diffusion measurements must be taken into account.11–14
Many changing cellular structures, due to disease or injury, have already been shown to affect ADC measurements. Specifically for white matter imaging, some have measured changes in DTI metrics with changing myelin content or myelin damage.2,15–22
Axon Diameter Measurements from Diffusion Weighted MRI
There are several methods for estimating axon diameter distributions and densities using MRI and most use PGSE with ADC(Δ) or q-space. One method, AxCaliber, uses a framework that combines composite hindered and restricted models of water diffusion (CHARMED) and PGSE measurements. 23 This method uses one fixed gradient direction and multiple diffusion times and gradient strengths to make the CHARMED model more sensitive to axon diameter. 8 It fits the MR signal to an equation which has components due to restricted diffusion, hindered diffusion, and later free diffusion. 24 Water in each axon size will experience restricted diffusion at different Δ. For example, water in an axon with a small diameter will experience restriction for much smaller Δ than water in a larger axon. 2 Thus by shortening Δ, smaller and smaller axons move from the restricted component to the hindered component allowing the inference of axon diameter of smaller and smaller axons.
The framework used in AxCaliber for dividing the models into different types of diffusion was based on another model, which describes bovine optic nerve tissue as a three-compartment system, (axons, glial cells, and extracellular space). Each compartment has its own diffusion coefficient, size, volume fraction, membrane permeability, and NMR relaxation times. It uses multiple Δs and gradient strengths in a pulse sequence similar to PGSE (stimulated echo) which allows for longer diffusion times and measures the mean axon diameter, but not the distribution. 25
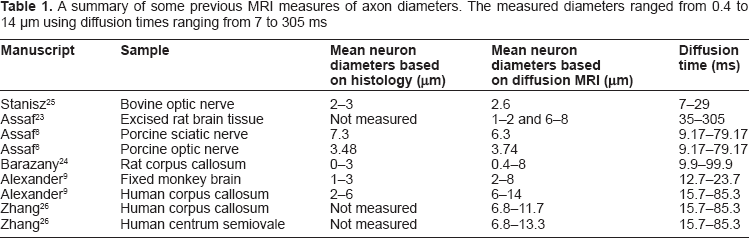
A summary of some previous MRI measures of axon diameters. The measured diameters ranged from 0.4 to 14 μm using diffusion times ranging from 7 to 305 ms
Measuring axon diameter distributions with MRI, even with intact ex vivo brains, has advantages over traditional ex vivo histological techniques. Ex vivo histological techniques are cumbersome, require tissue sectioning and are subject to inaccuracies such as cell shrinkage. 9 With MRI, the brain remains intact and images can provide measurements over large regions of the brain. Because of the difficulties with ex vivo histological measurements of axon diameter distributions, the variation of fiber composition over the population and during development is largely unstudied. 9
Although fixation can affect samples, studies have been done to compare ADC and other DTI metrics between in vivo and fixed ex vivo samples.22,28–30 While absolute values of ADC change, partially due to the temperature of the sample, fractional anisotropy is similar. 31 Thus ex vivo measurements of axon diameters on intact fixed brains can still offer important information.
Limits to the Ability to Measure Small Axon Diameters
The PGSE sequence requires, however, that Δ be large with respect to the restriction sizes in biological tissues, thus limiting the information that could be obtained from the measurements as will now be explained. The signal from a PGSE sequence is given by ln (S/S0) = -γ2 δ2 g2 (Δ - δ/3)D = -bD, where γ is the gyromagnetic ratio of the hydrogen nucleus, δ is the duration of the gradient pulse, and g is the amplitude of the gradient pulse. In order to measure the diffusion coefficient, the difference in signal with, S, and without, S0, diffusion gradients has to be large enough compared to the noise. Thus a large b = γ2δ2g2 (Δ - δ/3) value is needed. Given that small Δs are desired, and δ < Δ for PGSE, the only remaining factor that can be increased is the gradient strength. With q-space imaging, the smallest displacements which can be probed depend on the largest q which can be used. 8 Again, to make a large q, large gradient strengths need to be used. Gradient coils are limited in power they can supply. Moreover, for small duration, large amplitude gradient pulses, there will be a large change in magnetic field experienced by the subject in a short amount of time. This induces an electric field in the subject, which could cause twitching of the skin, pain, or interference with the function of the heart or brain. 32
Thus, in practice, it is difficult to make measurements at short diffusion times using the PGSE sequence. PGSE signals from water molecules in small axons do not change with diffusion time in the typical range used. Thus methods to determine axon diameter from these PGSE measurements are insensitive to these small axons. Shortening Δ would allow the inference of restriction sizes, for example rodent sized axon diameters, and surface-to-volume ratios in samples. However, such measurements presently cannot be done with PGSE as described above.32,33
Oscillating Gradient Spin Echo Sequences
In 1969, an oscillating gradient spin echo (OGSE) sequence was proposed to make measurements at short diffusion times,
34
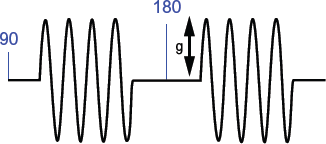
see Figure 2. In this sequence, the trapezoidal gradient pulses of the PGSE sequence are replaced with sinusoidally varying gradient pulses. Each period of the sine wave acts as a diffusion weighting so that the magnetic moments are dephased by the first lobe of the sine wave and rephased by the second lobe. These sine waves are repeated multiple times so that sufficient diffusion weighting can be obtained. The first measurements were made of surface-to-volume ratios from packed beads in water
33
and in vegetables.
36
Oscillating gradient spin echo (OGSE) sequence. The basic OGSE sequence consists of two RF pulses, shown in blue, and two sinusoidally oscillating gradient pulses, shown in black. In theory, the higher the frequency of the gradient pulses, the smaller the structures that can be probed. More complicated OGSE sequences which provide a straightforward means of characterizing the diffusion spectrum, change the form of the sine wave gradient pulses to apodized cosine or double sine waves.
35
However, only in the case of unrestricted Brownian motion can these multiple diffusion-weighting periods be considered independent.37,38 For this reason, the signal attenuation should be described in terms of a frequency spectrum rather than simply a scalar value (Δ). More complicated gradient modulations that selectively sample a narrow frequency domain of the diffusion spectrum have been proposed. 39 These provide a straightforward means of characterizing the diffusion spectrum, but are difficult to implement accurately. 35 Thus double-sine- and apodized cosine-modulated gradient waveforms, which are modified forms of OGSE, have been used and are still termed OGSE sequences. 35 In this so-called temporal diffusion spectroscopy, the effective diffusion times are changed by varying diffusion gradient frequencies, and thus a spectrum of diffusion rates, which describe the biological tissue microenvironment, can be measured. These measurements are different from q-space imaging where the propagator is usually defined at a given long diffusion time and has spatial and directional dependences over a large range of q-space.5,40 The contrast between tissues might be greater at a discrete, moderately high frequency than at low frequencies, as suggested by theoretical consideration of simple geometries and preliminary studies in tumors 41 and rat brain. 42
Using OGSE sequences might improve axon measurements. As Alexander notes: “More significant improvements may come from replacing the standard PGSE sequence with other diffusion-sensitive sequences such as oscillating gradient … experiments, which may be more sensitive to microstructural parameters. … Combination of the experiment design with these other pulse sequences should allow the a priori range of axon diameters to extend to include smaller diameters. This should provide protocols with sensitivity to wider ranges and provide more discriminative axon diameter indices.” 9 This same group performed experiments with optimized gradient waveforms (GEN) and were able to make axons with smaller radii more distinguishable with GEN than with PGSE.43,44 They still suggest that oscillating waveforms would provide valuable information for in vivo studies. 43 Developing DTI techniques to visualize better smaller fibers is considered an active area of research 45 and creating new techniques using short diffusion times will cause water in the larger fibers to become less restricted allowing for easier visualization of the restricted diffusion of water in the smaller fibers.
OGSE and Axon Diameter Measurements
Extending the measurements made with OGSE from studying the variation of ADC with diffusion time or frequency to create a method which uses this variation to infer restriction sizes using the shortest possible diffusion times could allow for the probing of smaller axon diameters. In theory, this method overcomes problems with high gradient strengths necessary in current MR diffusion methods (PGSE and q-space) to allow smaller restriction sizes to be distinguished. 35 The OGSE and PGSE methods could be used together to distinguish a large range of restriction sizes from very small (OGSE) to fairly large (PGSE). Combining the two methods might allow for a more complete understanding of the geometry of the sample.
Author Contributions
Conceived and designed the concept: MM. Wrote the first draft of the manuscript: MM. Agree with manuscript conclusions: MM. Made critical revisions: MM. The author reviewed and approved of the final manuscript.
Funding
The author acknowledges support from the Manitoba Health Research Council and the Natural Sciences and Engineering Research Council of Canada.
Competing Interests
Author(s) disclose no potential conflicts of interest.
Footnotes
As a requirement of publication the author has provided signed confirmation of compliance with ethical and legal obligations including but not limited to compliance with ICMJE authorship and competing interests guidelines, that the article is neither under consideration for publication nor published elsewhere, of their compliance with legal and ethical guidelines concerning human and animal research participants (if applicable), and that permission has been obtained for reproduction of any copyrighted material. This article was subject to blind, independent, expert peer review. The reviewers reported no competing interests. Provenance: the author was invited to submit this paper.