
Abstract
A method has been developed whereby diffusion and exchange in micro cellular structures in the human brain are correlated to produce a new type of image contrast leading to determination of water exchange rates in vivo. The diffusion method relies on differential apparent diffusion coefficients as detectable nuclei exchange between adjacent compartments marked with different apparent diffusion coefficient values (e.g. intra- and extra-cellular compartments). A new pulse sequence was developed, and used to calculate water intra/extra mean residence times in brain, and the signal dependence on various experimental parameters was analysed. The method was tested in vivo at 3T field strength and produced 160 ms and 550 ms for extra-cellular and intra-cellular mean residence times, respectively.
Keywords
Introduction
There are an increasing number of pulse-sequence based contrast mechanisms being developed for application in clinical imaging. Most are based on the different types of molecular, structural and biochemical information made available by subtle changes of pulse sequence time delays, radio frequency pulses and/or amplitude of various pulsed field gradients.1,2
The Apparent Diffusion Coefficient (ADC, mm2 s-1) of water in living tissue is due to restricted and tortuous diffusional motion and is a measure of the average area covered per unit time as a result of random incoherent motion only. Diffusion effects should not be confused with flow effects, since the latter is a coherent type of motion and their associated effects can be undone by proper pulse sequence design, whereas diffusion effects are random and incoherent. Since water is the fastest diffusing molecule in the body by virtue of its low molecular weight, most of the ADC studies have focussed on water, although some researchers have looked into different metabolites in localised spectroscopy. 3
The correlation of different molecular properties in two dimensional techniques used in high resolution MR spectroscopy encouraged us to apply a similar principle on a whole body MR scanner. Morris et al, 4 used diffusion-ordered spectroscopy (DOSY) where they were able to correlate different molecular diffusion coefficients in a mixture with their corresponding chemical shifts. Callaghan et al5,6 also correlated molecular diffusion with molecular exchange between different domains in a porous solid or a poly-domain liquid crystal. The latter method proved very useful for probing microscopic local anisotropy in the presence of global isotropy Since water protons are an easily exchangeable source of MR detectable signal, the diffusion of water from one compartment to another, marked with different ADCs, provides an insight into local diffusion and exchange especially at tissue-fluid border. Thus, the detected ADCs will be weighted by the rate of exchange of water between different compartments. Andrasko 7 used proton NMR to measure diffusion in red blood cells in vitro, after considering the effect of diffusion. Amide proton imaging was used by some researchers8,9 to obtain a different type of image contrast. The proposed method is different from the latter in that it focuses on the more concentrated water, and on its physical migration between different compartments–-rather than the transfer of magnetization. The influence of exchange on diffusion measurements has previously been described by Karger et al 10 who warned that chemical exchange could cause significant signal distortions that can lead to a distinct sensitivity loss. The effects of cell membrane permeability/exchange were also discussed in great detail by many others.11,12 The choice of parameters in a diffusion-weighted imaging procedure are therefore critical and influence the capacity to observe the effect of chemical species involved in exchange. 13 Whilst Wu et al 14 proposed a diffusion-sensitive pulse sequence that eliminated the effect of exchange, exchange-related information can also be utilised to gain additional knowledge about the system under consideration. Does et al 15 used multi-exponential fitting methods to extract multiple T2 values for different water compartitions in the in vivo rat brain. Two compartments, with discernable T2 and ADC values were found in rat trigeminal nerve. 15 Quirk et al 11 infused a non-crossing, blood-brain barrier contrast agent, Gd-DTPA, into the extracellular water pool of brain to introduce a large difference between the T1 values of the intra- and extracellular water pools, which then enabled them to fit the ADC data multi-exponentially to characterize different partitions.
Here a similar aim to the above is targeted, but by using a triply-weighted imaging technique where by MR signal is sequentially weighted with respect to diffusion, T1-relaxation and diffusion. The diffusion-exchange weighted (DEW) imaging is implemented in the human brain, in vivo at 3 T. This provides additional insight into characterizing exchange between extra-intracellular water pools.
Materials and Methods
All data were collected on a standard Magnetom Trio system (Siemens AG, Erlangen, Germany), using a circularly polarized (CP) head coil for transmitreceive (Siemens AG, Erlangen, Germany). A spherical phantom loaded with isotonic aqueous solution was used for phantom measurements and to optimize the DEW imaging sequence.
Theory
The DEW imaging pulse sequence is shown in Figure 1 where a slice selective gradient and gradient refocussing pulses are applied with each slice selective 90° RF pulse. For short echo times, the second 90° RF pulse rotates the refocussed transverse magnetization back to the z-axis of the rotating frame, where its relaxation is governed by T1 which is, generally speaking, longer than T2. It is important for the second 90° RF to be a plane-rotation pulse (e.g. hard or sinc), to maximise the fraction of stored magnetization along the z-axis. This acts as storage of the diffusion weighted magnetization along the z-axis. So far, the sequence resembles a stimulated echo sequence, STEAM16–18 (STE), which is known to be useful for rapidly relaxing species. An appropriate time delay (exchange time; ET) is inserted to allow weighting with respect to the local molecular exchange, that is, to allow water molecules to move between adjacent compartments. A third 90 RF pulse nutates the now exchanged-weighted longitudinal magnetization back to the transverse plane, and another 180° RF pulse forms an echo, which is subsequently acquired at a particular bandwidth. The coherence transfer pathway (CTP) 19 shown in Figure 1 monitors the state of magnetization from its creation by the 90° RF pulse until its detection. The CTP also helps in designing complex pulse sequences by realizing the sign of coherence level and matching with it the polarity of gradients, whether diffusion-sensitizing or slice-selective.
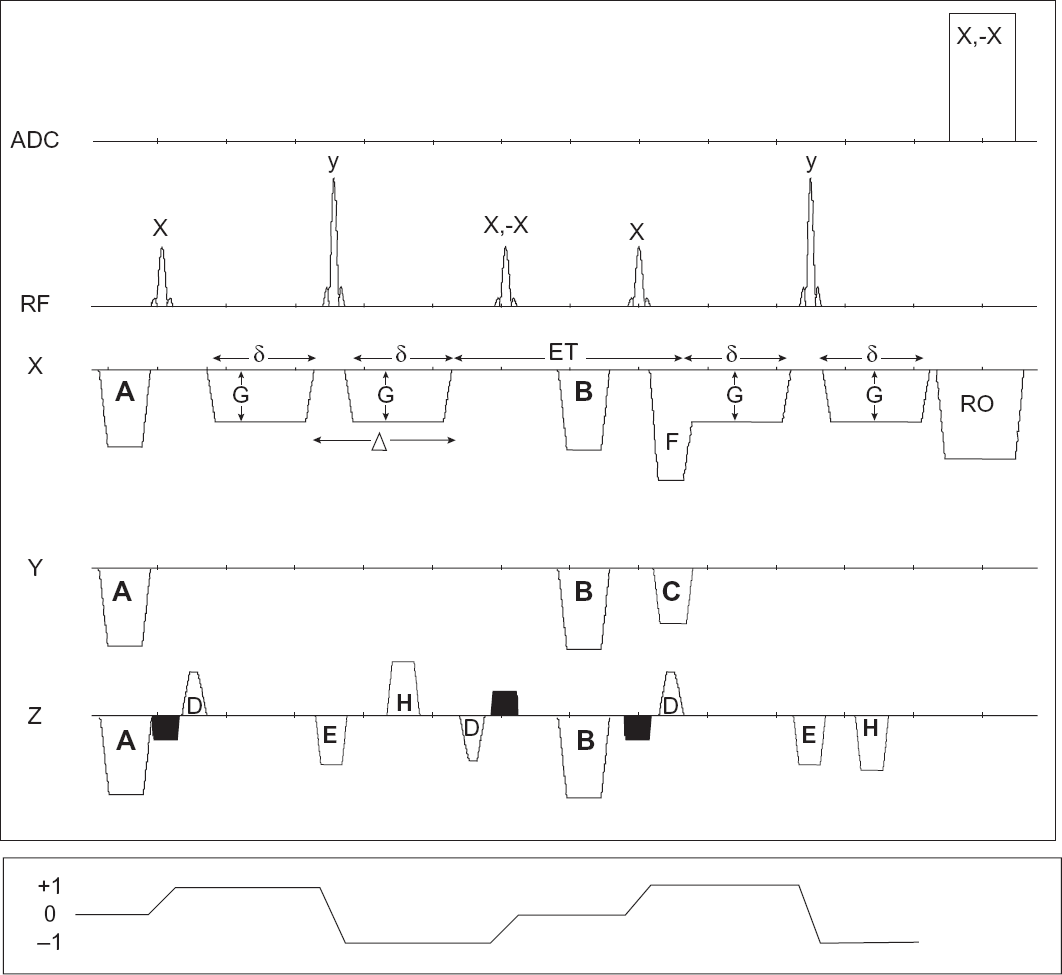
Top: DEW imaging pulse sequence with diffusion gradients oriented in the x direction, but can also be oriented along y or z directions. Dark gradient pulses are slice-selection pulses. Symbols in figure are as follow: A: dephasing spoilers to remove any residual transverse magnetization, B: spoilers to remove any transverse magnetization during exchange time, C: phase-encoding gradients, D: slice selection rephasing gradient, E: slice-selective refocusing gradient, F: readout-rephase gradient, G: amplitude of diffusion sensitizing gradients (DSG), H: spoilers for the spin-echo formed by the last 90°–180° RF pair, RO: readout gradient, δ: duration of DSG from leading edge to end of plateau, δ: delay from leading edge of DSG to leading edge of next DSG, ET: exchange time. Note that the effective exchange time is ET + δ. G and ET are changed while all other parameters are kept constant. Bottom: Coherence Transfer Pathway showing different levels of coherence of desirable signal throughout the life-time of pulse sequence.
TE must be kept short, since long TE values will lead to unavoidable T2-weighting and lower signal-to-noise ratio (SNR). High-amplitude diffusion gradients may produce eddy currents even in a system with reasonable eddy-current compensation. To overcome the problem, each diffusion gradient can be split into two bipolar gradients separated by a hard 180° RF pulse. It is essential to negate the polarity of the slice selection and rephasing gradients of the 2nd 90° RF pulse due to the change of the coherence level by the 180° RF pulse.
To be able to detect the signal from water that has exchanged between different compartments, the signal from the independent and terminal (90°–180°) RF pair must be suppressed. This is important to discriminate between fresh magnetization excited by the terminal 90° RF pulse and magnetization that was created and weighted with the first part of the pulse sequence. This can be done either by phase cycling the RF pulses as shown in Figure 1, and setting the number of averages to an even number, or by using spoiler gradients along the slice direction due to the more effective phase dispersion efficiency along this direction. 1 To retain the signal from the stimulated spin-echo and spoil the signal from the final 90°–180° RF pair, the following two equations must be satisfied simultaneously:

where (G1, G2) and (G3, G4) are the diffusion gradient pairs straddling the first and second 180° RF pulses, respectively, whereas Gsp2 and Gsp4 are the spoiler gradients ‘H’ in Figure 1.
Thus, setting G1 = G2 = G3 = G4 on one axis, and Gsp2 = −Gsp4 on another axis will select STE signal and spoil the spin-echo signal. However, Gsp2 and -Gsp4 that are used to spoil the spin-echo signal will enhance diffusion attenuation during the ET, and thus must be minimised. The initial area of Gsp2 spoiler was obtained by using:

where ‘12π’ is the number of rotations of the magnetization vector and is an integer multiple of 2π, γ is the gyromagnetic ratio for hydrogen atom and sl is slice thickness. The spoiler gradient area is then experimentally optimised to take into account magnetic inhomogeneities induced in the human head. The optimization of the spoilers was done by commenting out the first 90° RF pulse and fine-tuning the spoiler amplitude so that the final 90°–180° part of the pulse sequence does not produce any signal.
In a single compartment, the detected signal, S, resulting from pulse sequence depicted in Figure 1 (neglecting any relaxation effects), obeys the following mono-exponential equation:

where S o represent full spin-echo signal without diffusion attenuation, D is the diffusion coefficient, and b = 2 γ 2 G 2 δ 2 (Δ - δ/3) (neglecting imaging gradient for the moment).
If the water molecules are not exchanging at all and are totally confined to two separate and different compartments A and B, for example, with relative populations of P A and P B , respectively, then the detected STE signal will be:

where S oA and S oB represent the full stimulated-echo signals originating from compartments A and B without diffusion attenuation, respectively. A more detailed expression of S o can be obtained from. 1 The signal represented in Eq 5 will decay in a bi-exponential fashion with respect to the two independent domains A and B.
However, in tissues with semi-permeable membranes such as the brain, water exchanges between adjacent compartments. In a simple in vivo case, let τ A and τ B be the mean residence times or exchange times of water in compartments A (extra-cellular) and B (intra-cellular), respectively, and be defined as the time required for the exchanging species concentration in a particular compartment to be reduced to 1/e of the initial concentration, where e = 2.71828. Figure 2 illustrates schematically a generic cellular environment showing different compartments that might mimic the in vivo situation.
A generic neuron diagram showing intracellular B) water molecules as white circles, and extracellular A) water molecules as dashed circles. At long ET, measured ADC will reflect difference in intracellular/extracellular mean residence time, intrinsic ADC values, as well as population fractions. The initial ratio of water molecules in A:B is assumed to be 0.2:0.8. See text for more explanation.
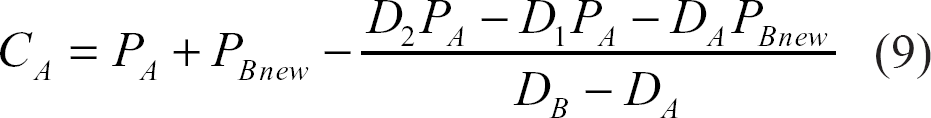
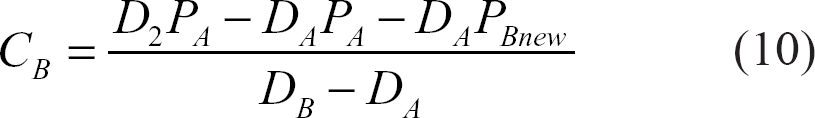
The detected signal,10,20–24 taking into account the effect of exchange, will be:
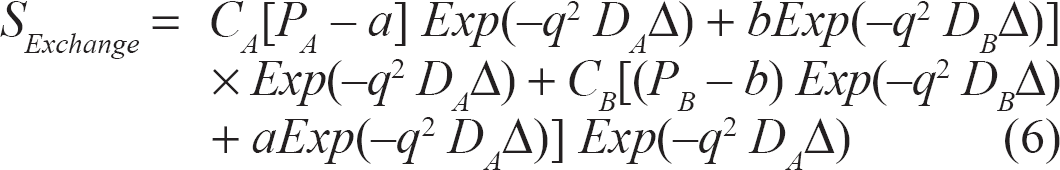
where:
a: water exchanged from A to B = P A [1 - Exp(-ET/τA)]
b: water exchanged from B to A = P B [1 - Exp(-ET/τB)]
P A : normalized magnetization of population in A relative to (A + B) = 0.16 11
P B : normalized magnetization of population in B relative to (A + B) = 0.84 11
C A and C B : population fractions
D A and D B : extra- and intra-cellular apparent diffusion coefficients
D1 and D2: intra- and extra-cellular intrinsic diffusion coefficients
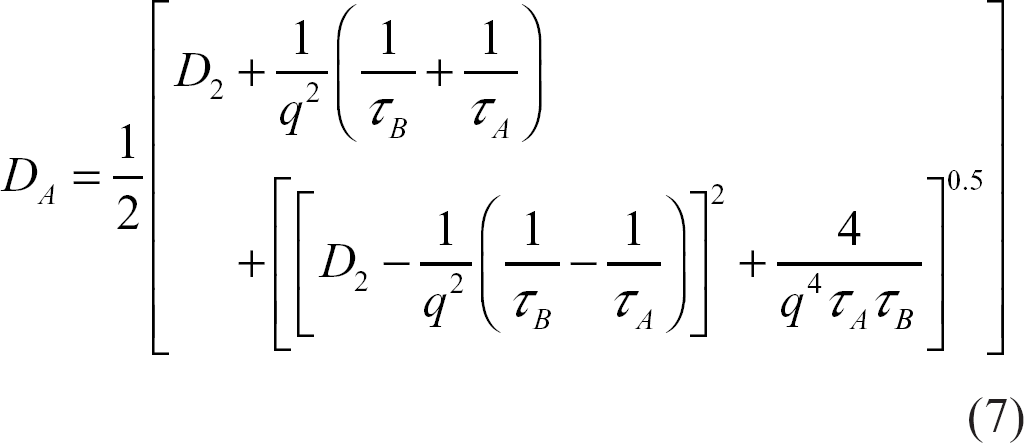
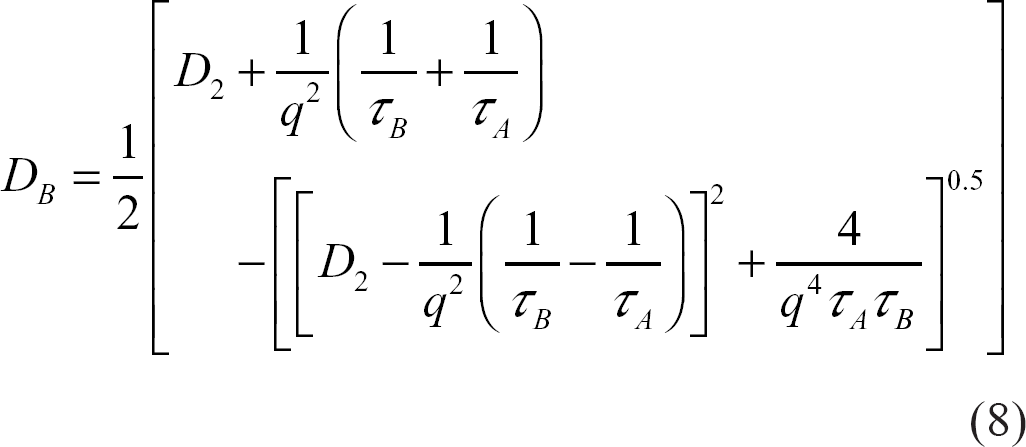
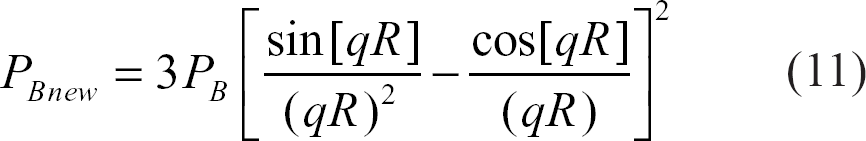
R: “effective” radius of the typical neuron ~1.5 μm11 q = γδG
Note that the above formulations are different from, but based on, Karger's model 10 in which it is assumed that diffusion in both exchanging sites is unrestricted and free. These assumptions are known to be untrue in the brain. The derivation of the above equations can be obtained from Price et al. 24
Different image contrast can be obtained at various ET as can be seen from Eq. 6. Note that short pulse gradient (SPG) approximation 25 was used for mathematical simplification. SPG approximation assumes that diffusion does not take place during the very short diffusion gradients (i.e. δ→ 0 and G→ infinity). Accounting for diffusion during the diffusion sensitizing gradient pulse makes the problem analytically intractable.23,25
Notice that an important difference between the pulse sequence shown in Figure 1 and a standard diffusion weighted STEAM pulse sequence is that diffusion attenuation does not take place in the former during the mixing time, ET, but it does in the latter. This is one of the reasons why the contrast obtained with DEW imaging is different from diffusion weighting alone.
Phantom DEW Imaging
To evaluate the performance of DEW imaging technique, a spherical brain phantom was used. The ADC values were measured at different ET values (10 and 300 ms) in the read, phase and slice directions. Experimental parameters were: slice thickness: 5 mm, FOV: 300 × 300 mm, TE: 40 ms, TR: 300 ms, attenuation factor, or b-value as it is usually called, was varied from 0 to 330 s mm-2.
In Vivo DEW Imaging
After acquiring a series of localizer images, a series of DEW images were acquired using the following parameters: 300 ms/40 ms (TR/TE), 5-mm slice thickness, 256 × 256 matrix, 300-mm x 300-mm field of view (FOV), bandwidth: 130 Hz/pixel, acquisition time: 7680 μs, gradient rise time: 1 ms, δ: 13 ms, δ: 15 ms, ET: 10 or 300 ms. Two pairs of diffusion sensitizing gradients (DSGs) were applied in the phase direction, but in principle they can be oriented in any direction. Fat suppression was added to the sequence by placing fat frequency-selective RF pulses and associated magnetic spoilers before the pulse sequence to avoid chemical shift artefacts (e.g. ghosting). The sequence was repeated for five different DSG values, yielding images with different diffusion-exchange weighting. The b-value used in this study was set to 2, 30, 110, 212, 330 s/mm2. Larger b-values were obtainable at longer TE, which in turn degrades SNR. Shorter ET can also allow an increase in b-value, but long ET was chosen to increase exchange weighting.
The constant contribution of imaging gradients (bimaging), interaction of imaging and DSG (bcross) and DSG (bdiffusion) to the total b-value was calculated by using Mathematica 26 according to.27–29 The final b-value is obtained as a sum of the three above b values. Note that the contributions of bimaging and bcross in the proposed pulse sequence are much smaller than that of bdiffusion.
Results
ADC values for a spherical water phantom measured at room temperature were found to be independent of the ET and TE and equal to (2.02 ± 0.06) x 10-3 mm2 s-1 in read, phase and slice orientations at ambient temperature. The ADC was measured with ET set to 10 and 300 ms.
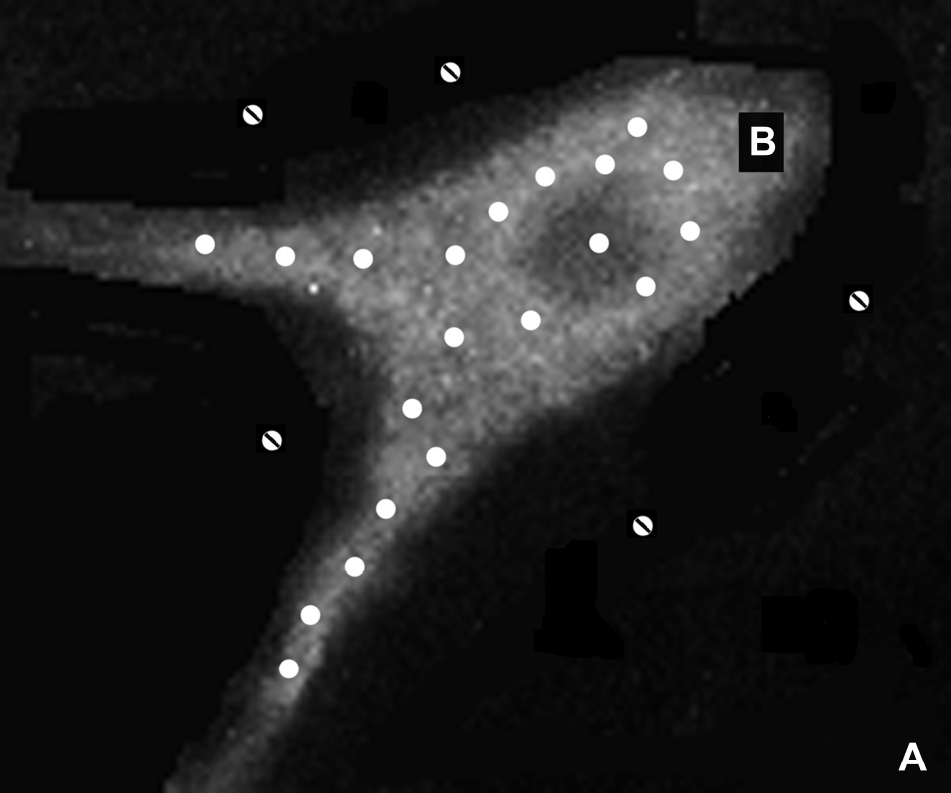
The average ADC in human brain in vivo was measured from the same anatomical area (occipital, 10 cm2) in four healthy and adult volunteers, at a TE = 40 ms with ET set to 10 or 300 ms, and ADC was found to be (1.01 ± 0.13) x 10- 3 mm2 s-1 and (1.25 ± 0.18) x 10-3 mm2 s-1, respectively. ET value of 300 ms was chosen to amplify exchange effects on the signal, but with the inevitable penalty of losing signal due to T1 relaxation. A Mathematica 26 program was written to determine τ A and τ B as various relationships between physical parameters were varied as expressed in Eq. 6–Eq. 11. Mean residence times were found to be τ A = 160 ms τ B = 550 ms. A spin-echo (SE) and DWI spin-echo (DWI-SE) images were also acquired for the purpose of comparison with the DEW images and these results are shown in Figure 3.

Different image contrast obtained by: A) spin-echo (TE/TR = 40/300), B) spin-echo DWI (TE/TR = 40/300 ms), C) DEW (TE/TR = 40/300 ms); ET = 10 ms, (D) DEW (TE/TR = 40/600 ms); ET = 300 ms. Images were acquired from an informed 36 year old volunteer.
Discussion
The identity of the signal acquired using the pulse sequence shown above, was confirmed by commenting out the 1st 90° RF pulse. The fact that no signal was detected at all when the 1st 90° RF pulse was removed indicated that the signal is purely STE and not contaminated by spin-echo signal arising from the terminal 90°–180° RF pulse pair.
The proposed pulse sequence is not meant to be a new method to measure ADC in the brain, since heavy weighting is associated with it. It, however, provides physical information about diffusion-exchange properties of brain micro cellular structures in vivo based on water exchange between compartments with different ADC values, as well as an insight into exchange rates. The increase of ADC value at ET of 300 ms compared to that at ET of 10 ms is due to, at least in part, water exchange between compartments with different ADC values. The cellular exchange time of water is in general dependent on the cell wall permeability, the intra- extra-cellular diffusion constant, the cell volume, and the cell geometry.
The observed ADC is the result of exchange-weighted average of N diffusion phenomena, where N is the number of compartments characterised with different ADC values; e.g. slow intra- (ADCB) and fast extra- (ADCA) cellular environments. ADCB is assumed to be a function of viscosities and restricting volumes and not affected by induced magnetic susceptibilities.30,31 The observed ADC will also be affected by the relative relaxation times of the different contributing environments, as well as the exchange rate of protons between the environments. Knowledge of how many different compartments are involved in water exchange can be experimentally useful, but this adds to the complicated variability of exchange rates between different compartments. Keeping all experimental parameters constant, except for DSG amplitude (G) and ET, as shown in Figure 1, ensures that the final detectable signal is a weighted function of diffusion and exchange only.
An insight into what is happening experimentally can be obtained by evaluating Eq. 6–Eq. 11 using standard MR parameters for relaxation, diffusion and mean residence times.32–34 Assuming two compartments and setting: ADCA to 10.0 × 10⁻³ mm2 s-1, 35 ADCB to 1.0 × 10⁻³ mm2 s-1, 36 δ to 13 ms, δ to 15 ms, ET to 300 ms, TE to 40 ms, and the same range of p-values used experimentally, yielded a simulated ADC value of 1.22 × 10⁻³ mm2 s-1, which is very close to the experimentally determined value of 1.25 × 10⁻³ mm2 s-1. Note that the experimentally determined ADC is the result of the net effect of diffusion and exchange. This change in ADC can be explained by the presence of exchange between the two, or more, compartments proposed above.
Literature values for τ A and τ B (120 ms and 550 ms, respectively), 11 and (230 ± 90 ms and 610 ± 100 ms, respectively), 36 are in good agreement with the predicted results in the current work (τ A = 160 ms τ B = 550 ms).
The intracellular water exchange time in rat brain in vivo was reported by Meier et al 20 to be 622 msec. Duong et al 37 reported intra- and extra cellular water exchange times to be 610 and 230 msec, respectively. Thus, with a shorter residence time, and larger ADC for extra-cellular water, ADC is expected to increase as ET increases. 36 One would expect, though, that proton-proton exchange between water and other molecules (e.g. proteins) to contribute to the observed exchange weighted ADC value. However, the low ratio of potentially exchangeable protons present within other molecular species in vivo to water, would make the aforementioned contribution insignificant.
The DEW sequence is expected to be motion-sensitive due to the nature of the first segment of the pulse sequence (90°–180°–90°) and due to the relatively long ET employed to induce exchange weighting. The leading (90°–180°–90°) part is the same as the preparation period used in a typical driven equilibrium Fourier transform (DEFT),1,38–40 which is known for its motion sensitivity. However, absence of significant motion-related artefacts in vivo seems to be fortuitous and combining the proposed sequence with a time-efficient imaging sequence (e.g. EPI 41 will be essential for a time-efficient protocol.
The average distance travelled along one direction by water in the brain during ET is (2 ADC ET) 12 . For ET of 300 ms, and an intra-cellular average ADC of 1.0 × 10⁻³ mm2 s-1, 36 the average distance travelled can be approximated to be about 24.5 μm. This is the extent to which local diffusion-exchange is investigated with the settings in the above pulse sequence. Investigating larger distances means using longer ET, with the penalty of lower SNR due to T1 relaxation effects. The T1 value of water in the brain is long enough to allow an ET value of few hundred ms at the field strength of 3 T. 42 The soma (neuron cell body) has a diameter of 25 μm, while the axon is typically 1 μm in diameter with widely variable length. Shorter ET can also be used, which will also improve SNR. During δ, however, the intra-cellular two-dimensional mean average distance travelled is 8 μm, assuming δ = 15 ms. This distance is larger than the “effective” diameter of the typical neuron diameter of ~3 μm. 11 Also, note that this calculation does not take into account the more abundant glial cells. It is important to realize that water exchanges during ET but its associated signal does not attenuate due to diffusion weighting.
Brain tissue can be regarded as a ‘poly-domain’ structure with variable domain sizes and orientations, where a ‘domain’ can be considered any compartment with different diffusion and/or orientation properties compared to other compartments. Thus, neurons, amongst other things, are domains with variable orientations. One possible application of DEW imaging sequence is to determine the mean domain size by following a similar analysis to that by Callaghan et al. 5 However, for the mean domain size to be meaningful, it might be preferable to consider part of the anatomy with many similar domains, e.g. spinal cord. This task must be done in spectroscopy mode and requires inverse Laplace-Laplace transformation. 5
While the original spectroscopic application of diffusion-exchange spectroscopy 6 used inverse Laplace–Laplace transform for processing, Fast Fourier Transform (FFT) 43 was used in the present situation due to the non-spectroscopic nature of the proposed technique. In, 6 the presence of exchange was indicated by the presence of spectroscopic cross peaks, whereas in the present imaging analogue, exchange is indicated by the dependence of ADC on ET. In DEW imaging, the directions of DSG pairs were set to be identical and the experiment probes changes in ADC over the adjustable exchange time ET. Incrementing DSG amplitude in DEW experiment as was the case in DEXSY experiment 5 is not applicable here due to imaging requirement of similarity of acquisition conditions for different lines in k-space, other than the changing amplitude of phase-encoding gradients. 1
The type of data obtained with DEW imaging is similar in nature to DTI data,44,45 since DTI infers fibre orientations from directional diffusivity. The time delay, ET, allows water molecules to diffuse in all possible directions, but most preferably along the long axis of the fibre, where diffusion hindrances are minimal. The fact that anisotropic information is exaggerated by this method may be useful, as anisotropic diffusion images can be difficult to interpret by naked eye and rely on quantitation.
Conclusions
A new diffusion-exchange-weighted imaging pulse sequence has been evaluated on a whole body MRI scanner and demonstrated to provide value for water intra/extra mean residence times. Combination of the proposed sequence with EPI is essential to produce a time-efficient protocol and to reduce motion-related artifacts.
Disclosure
The author reports no conflicts of interest.
Footnotes
Acknowledgments
We thank Mr. Peter Stanwell and Professor Brian Tress for fruitful discussions. The financial support of S.R. by an Australian Research Council Discovery Project Grant (DP0663987) is acknowledged.