
Abstract
The purpose of the study was to demonstrate the J-coupling connectivity network between the amide, aliphatic, and aromatic proton resonances of metabolites in human brain using two-dimensional (2D) localized correlated spectroscopy (L-COSY). Two different global water suppression techniques were combined with L-COSY, one before and another after localizing the volume of interest (VOI). Phantom solutions containing several cerebral metabolites at physiological concentrations were evaluated initially for sequence optimization. Nine healthy volunteers were scanned using a 3T whole body MRI scanner. The VOI for 2D L-COSY was placed in the right occipital white/gray matter region. The 2D cross and diagonal peak volumes were measured for several metabolites such as N-acetyl aspartate (NAA), creatine (Cr), free choline (Ch), glutamate/glutamine (Glx), aspartate (Asp), myo-inositol (mI), GABA, glutathione (GSH), phosphocholine (PCh), phosphoethanolamine (PE), tyrosine (Tyr), lactate (Lac), macromolecules (MM) and homocarnosine (Car). Using the pre-water suppression technique with L-COSY, the above mentioned metabolites were clearly identifiable and the relative ratios of metabolites were calculated. In addition to detecting multitude of aliphatic resonances in the high field region, we have demonstrated that the amide and aromatic resonances can also be detected using 2D L-COSY by pre water suppression more reliably than the post-water suppression.
Introduction
Magnetic resonance spectroscopy (MRS) enables non invasive detection of tissue metabolism. In vivo MRS has been widely used for over three decades to investigate biochemical pathways in organs and tissues in living systems.1–4 Absolute or relative quantification of metabolites and chemical compounds can be performed in a number of pathological tissues using one-dimensional (1D) proton ( 1 H) MRS. Most of these studies have described the detection of resonances in the spectral region between 0.5–4.5 ppm which originate from brain metabolites having concentrations in the range of several millimolar (mM), such as N-Acetylaspartate (NAA), choline containing compounds (Cho), phosphocreatine and creatine (PCr/Cr), myo-inositol (mI), and others. However, a small number of studies have also investigated resonances in the “aromatic region” downfield from water. Few resonances at higher frequencies than water have been unambiguously identified in vivo.5–7 The detection of resonances in this spectral region is more difficult due to the low physiological concentration of spins per molecule and their relatively short transverse relaxation times (T2). Resonances from water-exchangeable protons, such as NH and NH2 groups of nucleotides and amino acids, are present with variable amplitudes depending on the water saturation scheme used.
Two-dimensional (2D) correlated spectroscopy (COSY) facilitates mapping the connectivity between different protons within brain metabolites. Gradient assisted COSY is a quick method of establishing connectivity. 8 The conventional COSY spectrum provides information regarding three-bond J-couplings (from a proton to its carbon, to the adjacent carbon, then to that carbon's proton, i.e. H-C-C-H). A variety of COSY spectra may be generated by advanced techniques, allowing one to view four-, five-, and occasionally six-bond couplings. 9
A resonance at 7.8 ppm is attributed to the water exchangeable proton of the NAA amide group.5,7,10–12 Most of the amide groups such as asparagine, glutamine (Gln), NAA, protein back-bone, and certain amine protons (e.g. those in bases of nucleotide/nucleoside) have very slow exchange rates (<100 s-1). Although these protons are detectable, they are generally severely attenuated in conventional proton nuclear magnetic resonance (NMR) due to the use of water presaturation schemes and the consequential saturation transfer from water to the exchangeable sites. The major goal of this work was to compare the detection efficiencies of amide, aromatic and aliphatic proton resonances using localized correlated spectroscopy (L-COSY) combined with water suppression methods both before and after excitation/localization on a 3T whole body magnetic resonance imaging (MRI) scanner. Hereafter, these methods will be referred to as pre and post water suppression for short.
Materials and Methods
Nine healthy volunteers (mean age 31.2 years) were studied using a Siemens 3T Trio Tim MRI/MRS scanner (Siemens Medical Solution, Erlangen, Germany) running on the VB15A platform (gradient strength, 40 mT/m; slew rate, 200 T/m/sec). Informed consent for this study was obtained according to procedures approved by the local Institutional Review Board (IRB). Pre-and post water suppression techniques were adopted by using frequency selective radio-frequency (RF) pulses followed by dephasing B0 gradient crusher pulses in this study. In the pre water suppression scheme, three WET (Fig. 1) (water suppression enhanced through T1 effects) frequency selective pulse trains
13
were used before the 2D L-COSY volume localization (Fig. 2). In the post water suppression scheme, a MEGA RF pulse
14
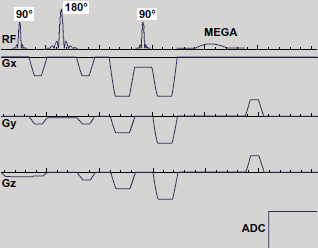
was used after the volume localization prior to detection of MRS signals as shown in Fig. 3.
The WET sequence containing three frequency selective pulses, each followed by dephasing B0 gradient pulse. A single-volume localizing 2D L-COSY pulse sequence. The 2D L-COSY sequence combined with a Post water suppression pulse module.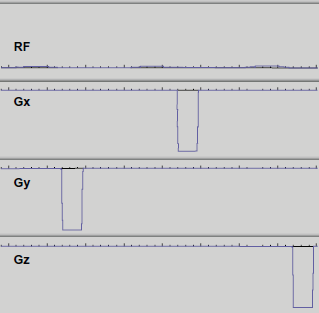
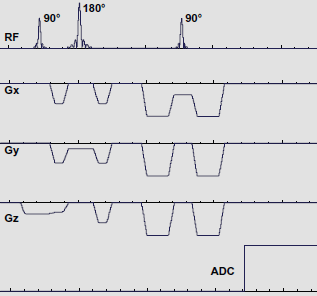
The L-COSY sequence 15 consisted of three slice-selective RF pulses (90°–180°–Δt1–90°–t2) for the volume localization, modified from the PRESS (Point Resolved Spectroscopy) sequence. 16 In addition to localization, the last 90° RF pulse also enabled the coherence transfer necessary for correlating the metabolite peaks in the second dimension. An incremental time period (Δt1) was inserted after the formation of the Hahn spin-echo and before the terminal 90° RF pulse. Eight averages were acquired per Δt1 in order to improve the signal-to-noise ratio (SNR) from a desired volume of interest (VOI). The average full width at half maximum (FWHM) of the water peak was around 10 Hz after shimming. The L-COSY spectra were recorded in the occipital white matter region using the following parameters: TR of 2 seconds, minimal TE of 30 msec for pre water suppression and longer TE for the MEGA combined L-COSY sequence, 100 At, voxel size of 4 × 4 × 3 cm3 (48 ml) and 8 averages per Δt. The raw data along the t2 dimension were acquired using 2048 complex points with 2000 Hz spectral window. Δt1was incremented to yield a spectral window of 1250 Hz along the second dimension (F1).
A 0.5 L white matter brain phantom was prepared at pH of 7.1 containing the following metabolites and concentrations: 10 mM NAA, 6 mM Cr, 1 mM Cho, 7 mM glutamate (Glu), 2 mM glutamine (Gln), 1 mM aspartate (Asp), 4 mM mI, 0.5 mM GABA, 1.5 mM glutathione (GSH), 2 mM phosphocholine (PCh), 1 mM phosphoethanolamine (PE) and 0.4 mM lactate (Lac). Similar spectra were also recorded using this phantom solution.
The raw spectral files were transferred to an SGI O2 workstation. A Felix 98 software package (Felix NMR, San Diego, CA, USA) was used for post processing. The raw MRS data matrix was apodized with skewed squared sinebell filters along the two axes and zero-filled to 2048 × 256. A double Fourier transformation resulted in a 2D L-COSY spectrum which was displayed in magnitude mode using contour plots.
Results
The spectra recorded in a brain phantom using the different water suppression schemes are shown in Fig. 4 and Fig. 5. Fig. 4 showed the cross peaks between the amide and methine protons of NAA clearly, which were identified above and below the main diagonal: (F2 = 7.8 ppm, F1 = 4.3 ppm) and (F2 = 4.3 ppm, F1 = 7.8 ppm). In addition, the cross peaks of NAA between the methine and methylene protons were identified in the aliphatic region as reported earlier.15,17
A water suppressed 2D L-COSY spectrum recorded in a white matter brain phantom using the pre-saturation WET module. A 2D L-COSY spectrum recorded in the white matter brain phantom using the post-saturation module containing the single MEGA RF pulse module.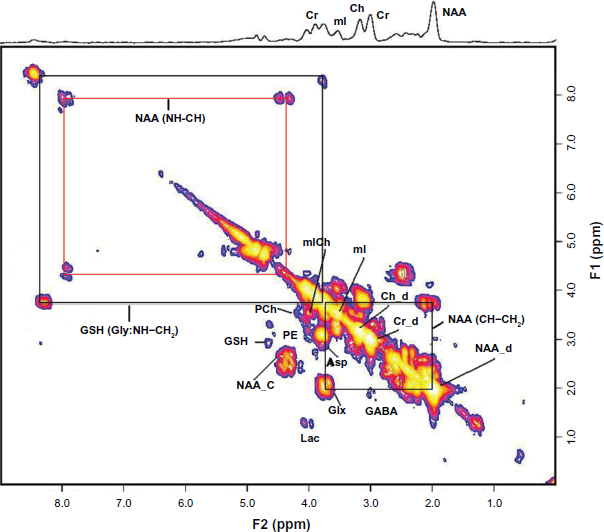
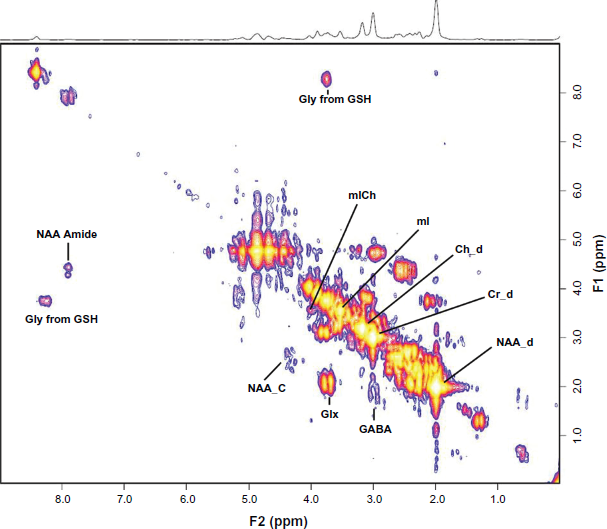
Glutathione, a tri-peptide made up of glycine (Gly), cysteine (Cys) and Glu is present in two-forms in living system, reduced (GSH) and oxidized (GSSG). It has been shown previously that only the reduced GSH is detectable in MRS. 18 The 2D cross peaks from the cysteine moiety from GSH were identified at (F2 = 4.5 ppm, F1 = 2.9 ppm) as the other mirror image cross peaks were saturated by water suppression due to the proximity of the multiplet at 4.5 ppm to water. The amide (NH) to methine (CH) cross peaks of Cys is not determined in the physiological concentration. 19 The cross peaks at (F2 = 8.2 ppm, F1 = 3.7 ppm) and (F2 = 3.7 ppm, F1 = 8.2 ppm) were due to the Gly amide and methylene protons from GSH 1 . The amine group of Glu in GSH was not observed due to rapid exchange with water. It has been reported that higher pH values did not affect the Gly amide frequency. 19 The intensity of Gly NH obtained from 1D spectra at pH 7.3 can be affected because of the presence of oxidized glutathione (GSSG). 19 The remaining cross peaks in the aliphatic region agreed with our previous assignments. 17
Due to inferior post-water suppression by a single MEGA RF pulse, Fig. 5 showed only the cross peak at (F2 = 7.8 ppm, F1 = 4.3 ppm) and the cross peaks between the methine and methylene protons of NAA identified in the aliphatic region as reported earlier. The cross peaks from the cysteine moiety from GSH at (F2 = 4.5 ppm, F1 = 2.9 ppm) and the other cross peaks were much weaker than that shown in Fig. 4 again due to insufficient water suppression using the MEGA RF pulse. The cross peaks due to the Gly amide and methylene protons were identified at (F2 = 8.2 ppm, F1 = 3.7 ppm) and (F2 = 3.7 ppm, F1 = 8.2 ppm), respectively.
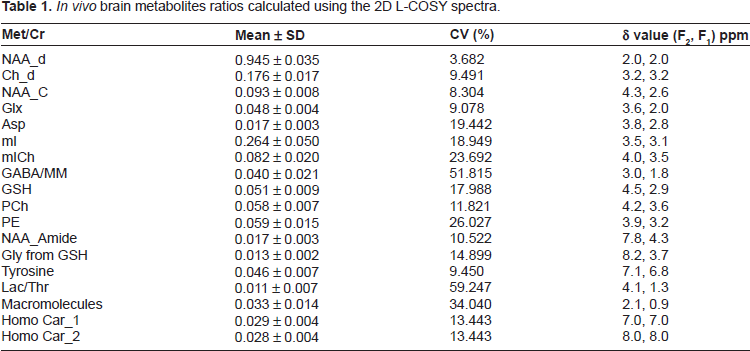
In vivo brain metabolites ratios calculated using the 2D L-COSY spectra.
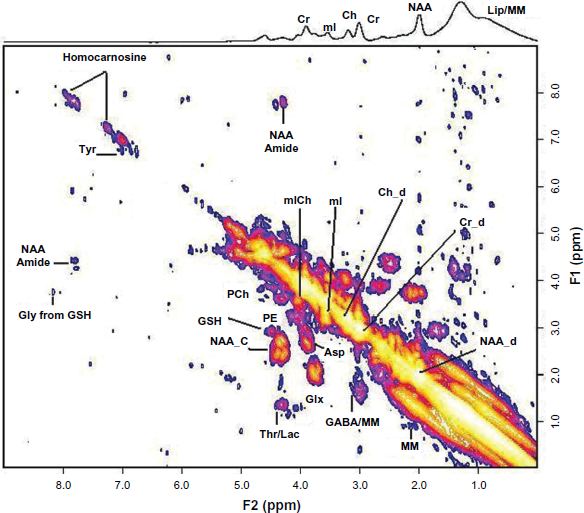
A 2D L-COSY spectrum recorded in the occipital white matter region of a 28yo healthy human subject using the pre-saturation sequence.
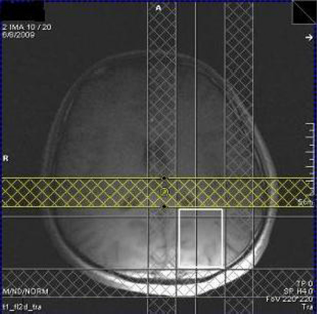
The voxel location shown on a T1-weighted MRI axial slice image.
Discussion
The concentrations of cerebral metabolites are generally in the millimolar range, which is several orders of magnitude lower than the concentration of water. To facilitate the in vivo detection of these metabolites, 1 H MRS or MR spectroscopic imaging (MRSI) typically includes pre-saturation of the abundant water signals. One-dimensional MR spectra contain overlapping resonances from a number of metabolites. As a result of this overlap, information from metabolically important or potentially diagnostic resonances can be obscured, affecting both peak assignment and accurate quantitation of metabolite levels. One method of overcoming this problem has been the development and application of 2D MRS methods to enhance the spectral dispersion by using a second spectral dimension. The additional spectral information obtained from the L-COSY experiment arises from protons that are linked or coupled through covalent bonds in a molecule, appearing in the 2D spectra as a pair of intersecting resonant frequencies or cross peaks.
The data presented here demonstrate the connectivity of amide protons and aromatic resonances in human brain using 2D L-COSY by means of pre- and post-water saturation technique. Even though few reports have shown the feasibility of detecting the NAA amide proton resonance using the PRESS or STEAM based 1D MRS,5,7 this study demonstrates the feasibility of detecting the entire J-coupling network between different protons.
NAA is a free amino acid present in the brain at fairly high concentrations 20 having seven protons with NMR signals between 2.0 and 8.0 ppm. The amide NH proton, which is exchangeable with water-protons, gives a broad doublet at 7.8 ppm that is known to be temperature dependent.10,20 The most widely used resonance of NAA is a singlet at 2.01 ppm from the three protons of an N-acetyl CH3 group. The cross peaks between the amide and methine protons of NAA were identified at (F2 = 7.8 ppm, F1 = 4.3 ppm) and (F2 = 4.3 ppm, F1 = 7.8 ppm) in 2D L-COSY. As discussed previously, the amide protons of NAA exchange slowly under physiological conditions so that the effect of saturation transfer is negligible.5,21,22
There are two different forms of Gly: free and part of GSH. The response of the Gly NH signal in glutathione solution indicates that its intensity is affected by pH changes in the physiological range, whereas its chemical shift is constant in this range. 19 Signals originating from the amine group of Glu were not observed because of rapid exchange with water. 19
Tyrosine is a nutritional ingredient for the synthesis of the neurotransmitters epinephrine, norepinephrine, and dopamine. Tyrosine is also needed to produce a number of important hormones including thyroxin, which has an important role in regulating the metabolism, skin health, mental health, and human growth rate. Tyrosine has seven water non-exchangeable protons, four from the phenyl ring and three from its aliphatic side chain. The four phenyl ring protons give rise to multiplets at 6.89 and 7.19 ppm. The CH and CH2 aliphatic protons of an ABX spin system give three doublet-of-doublets between 3.04 and 3.93 ppm. 20
Homocarnosine is a brain specific dipeptide of γ-aminobutyric acid (GABA) and L-histidine in the mammalian central nervous system. Large quantities of GABA and homocarnosine are found in the CSF derived from patients with GABA-transaminase deficiency. The histidine–-imidazole CH-protons in homocarnosine resonate at 8.08 and 7.08 ppm and are sensitive to local chemical environment, making homocarnosine a possible sensor for measuring intra-cellular pH. 12
Aliphatic endogenous signals obscure the proton spectrum between 0.7 and 5.5 ppm rendering this region of the spectrum challenging for analysis. Metabolic transformations on aliphatic regions of the parent compound are, therefore, relatively difficult to identify on the basis of such a spectrum. In contrast, the aromatic region is free of resonances originating from protein and lipid contamination. Resonances observed in this region are mainly due to resonances of the parent compound and its metabolites.
The benefit of going to 3T is enhanced resolution and the advantage of using 2D L-COSY give better separation of NAA amide protons, Tyrosine, Glycine residue of Glutathione, and Homocarnosine in the aromatic region; and the remaining metabolites in the aliphatic region.
Table 1 shows mean, standard deviation (SD), coefficient of variance (CV) and chemical shift value of all the metabolites. Except for a few metabolites (mICh, GABA/MM, PE, Lac/Thr and macromolecules) most of the metabolites shows the CV of less than 20%. The metabolites occurring at low concentration showed higher CV. Higher CVs may be caused by poor sensitivity of the metabolites, day-to-day fluctuations in RF power and magnetic field (B0) inhomogeneity.
The actual physics involved in higher field strengths, however, present significant drawbacks of 3T MRI. For example, the T1 relaxation times are prolonged with increasing magnetic field strength and the T2 relaxation times are decreased. Increasing resonance frequency at higher fields often limits specific absorption rates (SARs), and leads to larger chemical shift dispersion and stronger susceptibility artifacts which can be challenging.
The residual water is manifested in 2D Fourier transform spectra in the form of a vertical strip along F1 indicative of t1-noise along the water resonance that may obscure cross peaks that are close to the water signal and thereby impede spectral analysis. Typically, the presaturation module contains three frequency-selective RF pulses on water resonance as used for recording the 2D L-COSY spectra shown in Figs. 4 and 6. Suppression by a factor of at least 1000 is achievable using these three pulses. However, pre-water-suppression schemes using more than three RF pulses such as the variable pulse power and optimized relaxation delays (VAPOR) sequence have been proposed. 23 In contrast, one MEGA RF pulse for the post-water suppression as used in this work was not sufficient enough to accomplish enough water suppression. Adding more than one MEGA RF pulse in the post-water suppression sequence is not favorable as the spectral acquisition will be further delayed resulting in severe signal losses due to T2-weighting. Another drawback of this work was due to the larger voxel size of 48 ml to record the 2D L-COSY spectra. However, this was necessary to record metabolites occurring at lower physiological concentrations, 1 mM concentrations or below.
Conclusions
Detection of amide and aromatic resonances in human brain was investigated using the pre-water suppression sequence. This pilot study demonstrates detection of the J-coupling networks in NAA and glutathione including the amide, aromatic, and aliphatic resonances. For comparison, the post-water suppression based L-COSY sequence using the MEGA module was used to record cerebral metabolites. The technical inferiority of the current version of the post-water suppression sequence needs further investigations.
Footnotes
Acknowledgements
The authors like to thank the scientific support of Mr. Neil Wilson and the National Institute of Health for partial funding of this project (1R01MH06569501 A1).
This manuscript has been read and approved by all authors. This paper is unique and is not under consideration by any other publication and has not been published elsewhere. The authors and peer reviewers of this paper report no conflicts of interest. The authors confirm that they have permission to reproduce any copyrighted material.