
Abstract
Histone posttranslational modifications play a fundamental role in orchestrating gene expression. In this work, we analyzed the acetylation of H3 and H4 histones (AcH3-AcH4) and its modulation by visual experience in the mouse visual cortex (VC) during normal development and in two experimental conditions that restore juvenile-like plasticity levels in adults (fluoxetine treatment and enriched environment). We found that AcH3-AcH4 declines with age and is upregulated by treatments restoring plasticity in the adult. We also found that visual experience modulates AcH3-AcH4 in young and adult plasticity-restored mice but not in untreated ones. Finally, we showed that the transporter vGAT is downregulated in adult plasticity-restored models. In summary, we identified a dynamic regulation of AcH3-AcH4, which is associated with high plasticity levels and enhanced by visual experience. These data, along with recent ones, indicate H3-H4 acetylation as a central hub in the control of experience-dependent plasticity in the VC.
Keywords
Introduction
The visual cortex (VC) is a paradigmatic experimental model for the study of experience-dependent brain plasticity processes at both the physiological and molecular level.1–3 During a specific period of postnatal life, called the critical period (CP), visual experience is able to modify the structural and functional organization of this brain area. Visual-experience-induced modifications can occur up till adulthood, but the capacity for such modifications declines with age.4–7 Nevertheless, a few experimental strategies that potentiate the residual plasticity in the adult VC and reinstate juvenile-like levels have been identified in the past 10 years.8–11 Among the more relevant, as noninvasive strategies, are the pharmacological treatment with fluoxetine and the raising in an enriched environment (EE). Fluoxetine is a widely used antidepressive (commercially known as Prozac) belonging to the selective serotonin reuptake inhibitor class, which acts on the serotonergic neuromodulatory system. 12 EE, classically defined as a combination of inanimate and social stimulation, provides experimental animals with optimal conditions for enhanced exploration, cognitive activity, social interaction, and physical exercise. 13 As these approaches have also been shown to allow for the recovery of functions lost during development, they are considered particularly significant to explore new clinical treatments for several neuropathologies.
The cellular and molecular mechanisms underlying plastic processes in the VC are beginning to be elucidated. Mostly through studies involving the CP, it has been shown that plasticity processes are controlled by the complex interaction between numerous factors.5–7 The role of cortical inhibition, as well as its balance with excitation (E/I balance), has received particular attention as a fundamental factor determining the time course of the CP of plasticity. It has also been shown that the restoration of high levels of plasticity, by several experimental strategies, occurs via a reduction of the inhibitory tone.14, 15 Several factors controlling cortical plasticity act by modulating distinct intracellular signaling pathways, which, in turn, control different transcription factor families. All these result in a strict and specific control of the expression of genes mediating the plasticity process. 7 Large-scale transcriptomic and proteomic approaches have clearly shown the existence of ensembles of genes/proteins that are differentially regulated as a function of the plasticity levels in the VC and suggested the presence of a molecular signature of the action of visual experience that is specific to highly plastic juvenile animals.16, 17 It has been suggested that a differential modulation of sets of experience-regulated genes between the CP and adulthood may partially explain the effects of visual experience on the organization of cortical circuits. Thus, in the past years, many investigations have been made to study the molecular mechanisms controlling gene expression. Neuroepigenetics has recently emerged as a highly investigated subfield of neuroscience, and several works have shown that all the main epigenetic processes, ie, histone posttranslational modifications (PTMs), noncoding RNAs, and DNA methylation, are related to the control of cognitive processes.18–24 In the VC, it has been shown that increasing histone acetylation by treatment with histone deacetylase inhibitors (HDIs) reinstates plasticity in the adult.25–27 Also, the brain-specific noncoding RNA miR-132 has been indicated as a transducer of visual experience in developing visual circuitries.28–33 Finally, DNA methylation has been recently identified as a new epigenetic mark for experience-dependent plasticity. 34 Although there is accumulating evidence on the epigenetic control of synaptic plasticity in the VC, this needs to be characterized in more detail.
Histone acetylation is an epigenetic modification that spurred considerable interest in the past years, as HDIs are considered potential pharmacological treatments against several cognitive deficits.35, 36 However, little is known on the modulation of histone acetylation in VC plasticity models.26, 37 Here we focus on the analysis of the acetylation of lysine 9 on the histone H3 and of lysine 8 on histone H4, both of which are considered permissive to gene transcription,38–42 in the mouse VC. Acetylation was studied in a developmental plasticity model and in two adult experimentally induced models of plasticity (fluoxetine treatment [FLX] and EE) in order to obtain insights not only into the mechanisms determining the developmental decline of plasticity but also into those controlling the restoration of juvenile-like levels of plasticity in the adult. In order to identify potentially common mechanisms between the CP and adult restored plasticity, the results obtained in the two experimental conditions were compared. Moreover, the effect of visual experience on histone acetylation was studied in different experimental models. Our results indicate that lysine acetylation on H3 and H4 histones is dynamically regulated in the mouse VC in correlation with developmental and experimentally induced experience-dependent plasticity, suggesting a central role of this PTM in the control of these processes.
In addition, we analyzed the expression of glutamate (vGluT-1) and GABA (vGAT) vesicular transporters in different experimental plasticity models to investigate a possible correlation between these synaptic markers and plasticity levels. Our data show that the inhibitory marker vGAT is downregulated in the adult mouse VC of fluoxetine-treated and of environmentally enriched mice, suggesting that vGAT is one of the molecules involved in the experimentally induced reduction of the inhibitory tone and that it is necessary for the reopening of plasticity in the adult.
The correlation between the regulation of vGAT and of histone acetylation in adult mice suggests vGAT as a possible target of the epigenetic-induced modulation of the E/I balance controlling plasticity.
Methods
Experimental animals and treatments
Histone PTMs Involved in VC Plasticity Processes.

Sample preparation
Experimental animals were sacrificed by cervical dislocation at the same time of the day (between 8:00 and 10:00 am), right and left visual cortices of each animal were rapidly dissected under a stereoscopic microscope on ice in saline solution (NaCl 0.9%), pooled together, and stored at –80°C for further processing.
Histones were extracted from the visual cortices by acid extraction as previously described.47, 48 Briefly, samples were mechanically homogenized in 150–200 μL of hypotonic lysis buffer containing Tris 10 mM (pH 7.5), ethylenediaminetetraacetic acid (EDTA) 1 mM, Igepal CA-630 1%, phenylmethylsulfonylfluoride (PMSF) 1 mM, aprotinin 10 µg/mL, sodium orthovanadate (Na3VO4) 1 mM, and sodium fluoride (NaF) 100 mM, and incubated 1 hour on ice. Histones were then extracted from the nuclear fraction (pellet) by the addition of five volumes of 0.2 M HCl and glycerol 10%, and the insoluble fraction was pelleted by centrifugation (18,000 g, 30 minutes, 4°C). Histones in the acid supernatant were then precipitated with 10 volumes of ice-cold acetone followed by centrifugation (18,000 g, 30 minutes, 4°C), and the pellet was resuspended in a buffer containing Tris 40 mM, urea 7 M, thiourea 2 M, CHAPS 4% (w/v), and dithiothreitol (DTT) 56 mM. In the study of vesicular transporters, total protein extracts from the VC were used. 49 Briefly, samples were mechanically homogenized in 100–150 μL of lysis buffer (Tris 50 mM, EDTA 1 mM, NaF 100 mM, PMSF 0.1 mM, Na3VO4 2 mM, Triton X-100 1%, and glycerol 10%) and then incubated for 30 minutes on ice. Lysates were cen-trifuged (13,000 g, 1 hour, 4°C) to eliminate cellular debris, and the supernatant was recovered. In both kinds of extraction, part of the resuspension was used to estimate the protein concentration by the microtiter plate Bradford method in a 96-well microplate at λ 595 nm, through extrapolation from a standard curve using bovine serum albumin (BSA). The remaining was added with 4× loading buffer (SDS 2%, Tris 0.375 M, glycerol 10%, β-mercaptoethanol 5%, and Bromophenol Blue 0.2%) for subsequent separation of proteins by electrophoresis.
Western blotting
Western blot experiments were performed as previously described. 49 To compare the intensity of bands corresponding to the different samples in the same gel, the same amount of protein per sample was electrophoresed in 12% (for vesicular transporters) or 15% (for histones) sodium dodecyl sulfate polyacrylamide gel electrophoresis (SDS-PAGE) at 160 V for 1 hour (Supplementary Table 3). Following the antibodies data sheets, samples were not boiled before loading. Following electrophoresis, proteins were transferred from the gel onto a nitrocellulose membrane (GE Healthcare) at 100 V for 2 hours. To verify the transfer efficiency, gels were stained with Coomassie (Coomassie Brilliant Blue R-250 0.1%, ethanol 50%, acetic acid 7%) and membranes with Ponceau S 0.5% in acetic acid 1%. Following blocking in non-fat dry milk 5% (anti-H3, anti-AcH3, anti-H4, anti-vGluT-1, and anti-vGAT antibodies) or BSA 5% (anti-AcH4) in phosphate buffered saline (PBS) solution containing Tween-20 0.05% (PBST) for 1 hour at room temperature (RT), blots were probed o/n at 4°C with anti-H3, anti-AcH3, and anti-AcH4 (Cell Signaling, 1:2000, 1:2000, 1:5000, respectively) or anti-vGluT-1, anti-vGAT (Synaptic System, 1:20,000, 1:1000, respectively) rabbit antibodies, or anti-H4 mouse antibody (Cell Signaling, 1:1000) in PBST. Blots were then incubated with horseradish peroxidase (HRP)-linked anti-rabbit (for anti-H3, -AcH3, -AcH4, -vGluT-1, -vGAT) or anti-mouse (for anti-H4) secondary antibodies (Sigma, 1:5000–1:7000) for 1 hour at RT. Immunoreactive bands were visualized using an enhanced chemioluminescence system (Amersham) and processed with a Chemi Gbox system (Syngene).
To verify homogeneous loading, membranes were then stripped (5 minutes, NaOH 0.2 M) and reincubated with the polyclonal rabbit anti-actin antibody (Sigma, 1:5000) or the monoclonal mouse anti-α-tubulin antibody (Sigma, 1:1000). Moreover, total protein staining of Ponceau-stained membranes was used as a further control.
The antibodies against H3 and AcH3 detected a single band of approximately 17 kDa, and the antibodies against H4 and AcH4 detected a band of approximately 11 kDa. The antibodies against vGluT-1 and vGAT detected a single band of approximately 62 and 57 kDa, respectively. Anti-actin and anti-α-tubulin antibodies recognized a single band at the expected molecular weight (approximately 42 and 50 kDa, respectively). Other antibodies used to test the quality of acid-extracted VC samples were the anti-H2A, -H2B, and -pS10H3 antibodies (Supplementary Table 3).
Specificity of antibodies against the acetylated forms of H3 and H4 histones was tested analyzing histone acetylation in cultures of Chinese hamster ovary (CHO) cells stimulated with the HDI trichostatin A (TSA, 50 ng/mL, 4 hours).
To minimize variability, in each experiment the same set of samples was loaded twice in separate lanes of the same gel, and two gels were run simultaneously on the same apparatus. For each gel, the corresponding membrane obtained after blotting was cut into two in order to obtain a complete series of samples in each part of the membrane. One of the two membrane parts was reacted with an antibody that detects the endogenous level of the total H3 or H4 histones and the second part with an antibody that detects endogenous levels of H3 or H4 histones only when acetylated. For vesicular transporters, one part was reacted with anti-vGluT-1 antibody and the other with ant-vGAT antibody.
Densitometry and statistical analysis
The intensity of bands in the digital images obtained in Western blot experiments was quantified using the NIH Image J 1.46r free analysis software. A window size was chosen to include all bands present in each experiment. Following manual background subtraction, peaks corresponding to the signals of interest were selected and plotted on a graph reporting the gray levels/distance in pixel. In order to compare signals of different experimental samples obtained in different Western blot experiments, raw data (area above the peak) obtained in each experiment were normalized to the membrane-specific background.
The signal obtained with the antibodies against the acetylated forms of histones was divided by the signal obtained with the antibodies against the corresponding total histone form to obtain an “acetylation index”. The signal of vesicular transporters was normalized to the signal obtained with the α-tubulin antibody following stripping and reincubation of the same membrane.
The Past 2.14 free analysis software 50 was used to assess significant differences. In the experiments using samples from CP, AD, FLX, EE, and SC, data were compared between the different experimental groups (CP vs. AD, FLX vs. AD, EE vs. SC) using the two-tailed Student's t-test with significance threshold P < 0.05. In the experiments on visual experience effects, the acetylation index of DE, LRE, and NLC samples was compared among the different experimental conditions using the one-way analysis of variance (ANOVA) post hoc Levene test with significance threshold P < 0.05. A total of 129 mice (n = 31 CP, n = 25 AD, n = 29 FLX, n = 24 EE, n = 20 SC) were used in Western blot experiments. All data in the text and in figure legends are expressed as average ± SEM.
Immunohistochemistry
Immunohistochemistry experiments were conducted exclusively to study visual experience induction of H3 and H4 histone acetylation on CP mice. A total of n = 13 C57BL/6J mice were used (n = 6 DE, n = 7 LRE). Transcardial perfusion was performed following deep anesthesia with xilazine/ketamine 10/90 mg/kg of body weight with ice-cold paraformaldehyde 4% in PBS 0.1 M (pH 7.4) containing sodium citrate 0.4% as anti-coagulant. Brains were quickly removed, cryoprotected in sucrose 30% o/n, frozen in isopentane, and stored at –80°C for further processing. Coronal 35-μm brain sections were obtained on a cryostat (Leica) following stereotaxic coordinates of the mouse brain atlas, 51 stored for 24 hours in PBS at 4°C, and then processed for immunohistochemistry. Free-floating sections were blocked for 1 hour (Triton X-100 0.2%, BSA 5% in PBS) followed by incubation with anti-AcH3 or anti-AcH4 antibody (Cell Signaling, 1:1000; Triton X-100 0.2%, BSA 1% in PBS) at 4°C o/n with gentle agitation. Histone acetylation was revealed using goat anti-rabbit FITC-labeled secondary antibody (Sigma, 1:2000; Triton X-100 0.2%, BSA 1% in PBS) for 1 hour at RT.
Image analysis and statistical analysis
Slices were coded, and for each animal confocal images (LSM800 Zeiss) of 10–14 representative fields of the VC were acquired by an operator blind to the treatment using the ZEN Microscope and Imaging Software. Images were obtained using a 25x oil immersion objective using the stitching tiles function (4 × 4 tiles, 947 μm2;5 × 5 tiles, 1180 μm2;6 × 6 tiles, 1410 μm2). Images were analyzed through ImageJ 1.50e (Fiji Is Just) software to count immunopositive neurons using the particle analysis tool. The threshold was defined for each antibody separately as follows: for each image the value d = MGVns + 2 × SD (with MGVns = mean gray value nonspecific, and SD = standard deviation) was calculated. Then, the threshold was defined in each specific image as threshold = MGVns + D. The D-value was calculated averaging the d-value of each image processed with the same antibody. Following thresholding, the parameters to define particles were established as size = 20-infinity (μm), and circularity = 0.05 – 1. Analysis was performed in a defined rectangular area of approximately 600 × 600 μm so to include all VC layers. Cell density was calculated by dividing the number of particles per the area of the rectangular tool (in μm2). The Past 2.14 free analysis software 50 was used to assess significant differences. Cell density values of LRE vs. DE conditions for AcH3 and for AcH4 immunohistochemistry experiments were compared using the Mann-Whitney test with significance threshold P < 0.05. All data in the text and in figure legends are expressed as average ± SEM.
Results
Quality analysis of histone-enriched VC samples
The classical acid extraction method was used to obtain cortical samples enriched in basic proteins. To confirm the presence of histones, 20 µg of acid-extracted VC sample was loaded on 15% SDS-PAGE gels and stained with Coomassie Brilliant Blue R-250 dye. Comparison to previous results confirmed the presence of four main bands corresponding to the four core histone proteins H3, H2B, H2A, and H4 at the expected MW (Supplementary Fig. 1A). A similar banding pattern is observed in most histone proteins of mammalian species.
48
A mass spectrometry analysis (LTQ-Velos; Thermo Scientific) was then performed on the main bands, manually dissected from the gels, to identify the histone proteins present in the acid-extracted VC samples. The analysis revealed the presence of multiple histone variants, confirming the quality and reliability of the methodology used (Supplementary Table 4 and Supplementary Methods). Mass spectrometry analysis performed on gel bands obtained by running basic proteins extracted from visual cortical samples by the salt extraction method identified a lower amount of histone proteins than by the acid extraction method (Supplementary Table 5 and Supplementary Methods). Finally, Western blot analysis was performed using specific antibodies against the four core histone proteins. Each antibody revealed a single band at the expected MW (approximately 14 kDa for H2A and H2B, 17 kDa for H3, and 11 kDa for H4), confirming the presence of histones in the samples and the specificity of the antibodies used (Supplementary Fig. 1B). Detection of specific bands at the expected MW with antibodies recognizing single histone PTMs (anti-pS10H3, -AcK9H3, -AcK8H4) in untreated VC samples confirmed that these PTMs are preserved during the acid extraction process (Supplementary Fig. 1C). Following antibody titration and optimization of Western blot protocols for each antibody in use, the specificity of the anti-AcH3 and anti-AcH4 antibodies was tested on cultures of CHO cells stimulated with the HDI trichostatin A (TSA, 50 ng/mL, 4 hours). The anti-AcH3 and anti-AcH4 antibodies produced a single band of strong intensity at the expected MW exclusively in the treated cells but no bands in the unstimulated cells (Supplementary Fig. 1D).
Acetylation of H3 and H4 Histones Correlates with High Levels of Plasticity in the Cp and Declines with Age. (
H3 and H4 acetylation is developmentally regulated and is induced by visual experience in the CP
We first analyzed histone acetylation in the VC of animals raised in normal light-dark conditions by comparing samples obtained from young mice at the peak of the CP for plasticity and from low-plasticity adult (AD) mice. The signal obtained with the antibodies recognizing the acetylated forms of H3 and H4 histones was normalized to the signal obtained with antibodies recognizing the corresponding total histone form, giving an “acetylation index” for each histone of interest. Inter-experimental variability and sample loading were further verified by reprobing the stripped membranes with anti-actin or α-tubulin antibodies and staining the total proteins on Ponceau-stained membranes (data not shown). Western blot analysis revealed that the signal obtained with both anti-AcH3 and anti-AcH4 antibodies were stronger in CP than in adult samples (Fig. 1). Semiquantitative analysis of Western blots (Fig. 1B) revealed that the acetylation index of H3 in the VC of CP mice was approximately 90% higher than in adults (AcH3: CP, 1.49 ± 0.13 vs. AD, 0.78 ± 0.02, n = 7, Student's t-test, P < 0.05), and that the increase of the acetylation index of H4 was even more accentuated, approximately 160% higher in CP than in AD (AcH4: CP, 2.10 ± 0.28 vs. AD, 0.80 ± 0.02, n = 6, Student's t-test, P < 0.05).
In order to characterize the molecular pathways possibly contributing to the decline of experience-dependent plasticity in the adults, the modulation by visual experience of H3 and H4 acetylation was compared in CP and AD mice. Mice were exposed to darkness during 3 days (CP, P25-P28; AD, P95-P98), and then a group was sacrificed directly (DE) or following re-exposure to normal light environment for 90 minutes (LRE). Samples obtained from mice raised in normal light-dark cycle conditions (NLC) were used as controls. As shown in Figure 2A, Western blot analysis revealed a significant difference in the acetylation level of both H3 and H4 histones between DE and LRE CP mice that was not detected in adult mice. In detail (Fig. 2B), when compared with NLC mice, DE induced a decrease of the H3 acetylation index of approximately 50%, which was restored to NLC-like levels by re-exposing mice to light for 90 minutes (AcH3, CP: NLC, 1.49 ± 0.13, n = 7; DE, 0.74 ± 0.01, n = 5; LRE, 1.31 ± 0.04; n = 5; one-way ANOVA: DE vs. NLC and LRE, P < 0.05; LRE vs. NLC, P = 0.43). DE induced a reduction of the H4 acetylation index of approximately 60%, which was restored to NLC-like levels by LRE (AcH4, CP: NLC, 2.10 ± 0.28, n = 6; DE, 0.78 ± 0.01, n = 9; LRE, 1.88 ± 0.20, n = 9; one-way ANOVA: DE vs. NLC and LRE, P < 0.05; LRE vs. NLC, P = 0.70). On the contrary, in adult mice, neither DE nor LRE modified H3 and H4 acetylation index in comparison to NLC mice (AcH3, AD: NLC, 0.78 ± 0.02, n = 7; DE, 0.81 ± 0.03, n = 4; LRE, 0.81 ± 0.04, n = 4; one-way ANOVA: NLC vs. DE and LRE, P = 0.85; DE vs. LRE, P = 1.00) (AcH4, AD: NLC, 0.80 ± 0.02, n = 6; DE, 0.80 ± 0.03, n = 6; LRE, 0.84 ± 0.04, n = 6; one-way ANOVA: NLC vs. DE, P = 0.99; NLC vs. LRE, P = 0.60; DE vs. LRE, P = 0.59).
De and Lre Modulate Acetylation of H3 and H4 Histones Exclusively During the Cp of Plasticity But Not in Adults. (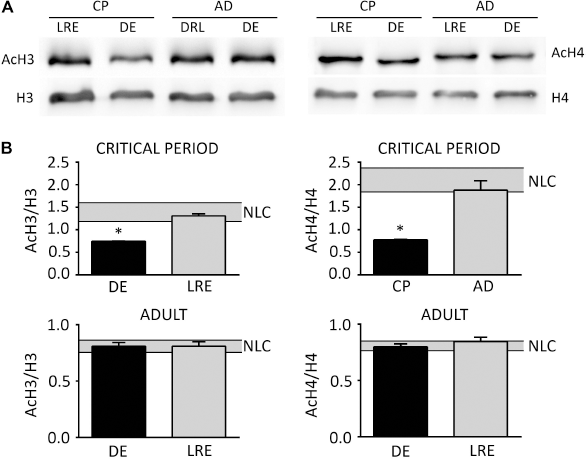
In order to confirm that visual experience during the CP modulates the acetylation of H3 and H4 histones and to analyze the staining localization in the VC, immunohistochemical experiments were performed using the same antibodies as in Western blot experiments (anti-AcK9H3 and anti-AcK8H4 antibodies). Figure 3 shows representative examples of immunohistochemical experiments on the VC of young mice at the peak of the CP of plasticity. Both antibodies revealed specific immunopositive signals that disappeared in control sections incubated without primary antibodies (Figure 3A and C for anti-AcH3 antibody, and Fig. 3B and D for anti-AcH4 antibody). Figure 3E and F show the typical nuclear staining for AcH3 and AcH4 as expected for histone intracellular localization.
Representative Examples of AcH3 and AcH4 Staining in the Mouse VC. Images (at 25×) of Visual Cortical 35 µm Sections of Mice at the Peak of the CP Incubated with (w; 
Figure 4 shows representative images of AcH3 and AcH4 immunohistochemical experiments on the VC of CP mice sacrificed in darkness (DE) or re-exposed to light for 90 minutes prior to sacrifice (LRE). Comparison of LRE vs. DE sections revealed a significant modulation of H3 and H4 acetylation cell density (AcH3: Fig. 4A and C; AcH4: Fig. 4B and D). Image analysis indicated that AcH3 and AcH4 immunopositive cell density in the primary VC was significantly increased by LRE in comparison to DE mice during the CP. AcH3 cell density increased approximately by 21% (AcH3: LRE, 1.75 ± 0.03, n = 7, vs. DE, 1.44 ± 0.06, n = 6; Mann-Whitney test, P < 0.05) and AcH4 cell density approximately by 48% (AcH4: LRE, 1.45 ± 0.03, n = 6, vs. DE, 0.98 ± 0.07, n = 4; Mann-Whitney test, P < 0.05) with respect to DE animals (Fig. 4E and F).
AcH3 and AcH4 immunopositive cell density is modulated by visual experience during the CP. Images of visual cortical sections (at 25×) of LRE (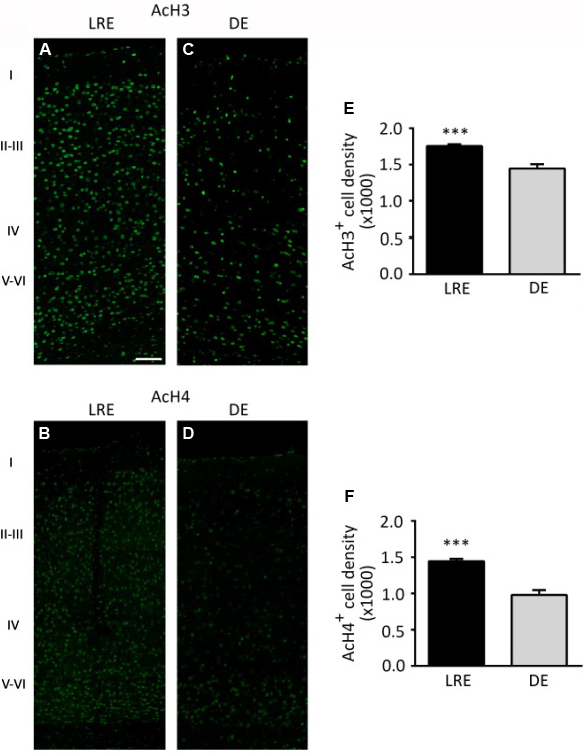
H3 and H4 acetylation is upregulated in models of experimentally induced adult plasticity and is induced by visual experience only in adult plastic mice
We then analyzed whether acetylation of H3 and H4 was modulated in the VC of adult mice when high levels of plasticity were experimentally restored. Western blot analysis was performed on mice orally treated with fluoxetine or raised in EE during four weeks from P70 to P98. Both treatments are known to reinstate ocular dominance plasticity in the VC of adult rodents (FLX;10, 44 EE8, 11, 52). As shown in Figure 5, Western blot analysis revealed that fluoxetine induced an increase of H3 and H4 histone acetylation index in the VC in comparison to untreated mice. Image analysis revealed that the acetylation index of H3 in the VC of fluoxetine-treated mice was approximately 93% higher than in controls (AcH3: FLX, 1.52 ± 0.07 vs. AD, 0.78 ± 0.02, n = 7; Student's t-test, P < 0.05), and that the increase of the H4 acetylation index was even more accentuated, approximately 160% higher in fluoxetine-treated than in untreated mice (AcH4: FLX, 2.08 ± 0.12 vs. AD, 0.80 ± 0.02, n = 6; Student's t-test, P < 0.05).
FLX Induces an Increase in H3 and H4 Acetylation. (
Similar results were obtained in the study comparing adult mice raised in EE to mice raised in SC (Fig. 6). EE induced an increase of H3 acetylation index of approximately 76% (AcH3: EE, 1.36 ± 0.08 vs. SC, 0.77 ± 0.05, n = 6; Student's t-test, P < 0.05), and of H4 acetylation index of approximately 166% (AcH4: EE, 1.89 ± 0.23 vs. SC, 0.71 ± 0.02, n = 6; Student's t-test, P < 0.05).
EE induces an increase in H3 and H4 acetylation. (
As in the developmental study on CP and AD mice, we analyzed the effects of visual experience on H3 and H4 acetylation also in experimentally induced adult plastic mice and relative controls. Both fluoxetine-treated and environmentally enriched adult mice were exposed to darkness during the last three days of the treatment (from P95 to P98), and then a group was sacrificed directly (DE) or following re-exposure to normal light environment for 90 minutes (LRE). Samples obtained from mice raised in normal light-dark cycle conditions (NLC) were used as controls. Western blot analysis revealed a significant difference in the acetylation level of both H3 and H4 histones between DE and LRE exclusively in the VC of mice where plasticity was experimentally restored but not in control mice (Figs. 7 and 8). In fluoxetine-treated mice (Fig. 7), DE induced a decrease of the H3 acetylation index of approximately 50%, which was restored to NLC-like levels by re-exposing mice to 90 minutes of light (AcH3, FLX: NLC, 1.52 ± 0.07, n = 7; DE, 0.76 ± 0.03, n = 6; LRE, 1.67 ± 0.07; one-way ANOVA: DE vs. NLC and LRE, P < 0.05; LRE vs. NLC, P = 0.27). DE induced a reduction of the H4 acetylation index of approximately 65%, which was restored to NLC-like levels by LRE (AcH4, FLX: NLC, 2.08 ± 0.12, n = 6; DE, 0.73 ± 0.02, n = 8; LRE, 1.74 ± 0.22; one-way ANOVA: DE vs. NLC and LRE, P < 0.05; LRE vs. NLC, P = 0.32). On the contrary, in adult untreated mice, neither DE nor LRE modified H3 and H4 acetylation index in comparison to NLC mice (Fig. 2A and B).
DE and LRE modulate acetylation of H3 and H4 histones in fluoxetine-treated adult mice but not in untreated adults. ( DE and LRE Modulate Acetylation of H3 and H4 Histones in Environmentally Enriched but not in Control Adult Mice. (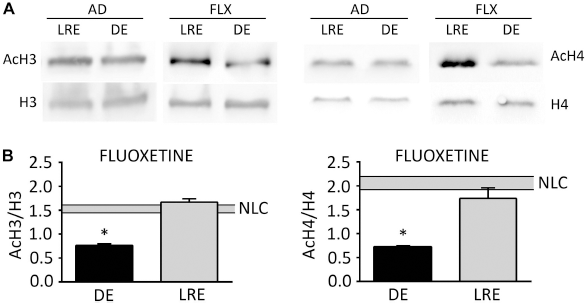

The effect of visual experience in mice raised in EE was similar to what was described in fluoxetine-treated mice (Fig. 8). DE induced a decrease of the H3 acetylation index of approximately 47%, which was restored to NLC-like levels by re-exposing mice to 90 minutes of light (AcH3, EE: NLC, 1.36 ± 0.08, n = 6; DE, 0.72 ± 0.07, n = 3; LRE, 1.46 ± 0.12, n = 3; one-way ANOVA: DE vs. NLC and LRE, P < 0.05; LRE vs. NLC, P = 0.80). DE induced a reduction of the H4 acetylation index of approximately 60%, which was restored to NLC-like levels by LRE (AcH4, EE: NLC, 1.89 ± 0.23, n = 6; DE, 0.73 ± 0.02, n = 7; LRE, 2.12 ± 0.23, n = 7; one-way ANOVA: DE vs. NLC and LRE, P < 0.05; LRE vs. NLC, P = 0.70). This effect was not observed in control mice raised in SC where visual experience induced no significant change in the acetylation index of both H3 (AcH3, SC: NLC, 0.77 ± 0.05, n = 6; DE, 0.63 ± 0.01, n = 3; LRE, 0.64 ± 0.01, n = 3; one-way ANOVA: NLC vs. DE, P = 0.20; NLC vs. LRE, P = 0.27; DE vs. LRE, P = 0.98) and H4 (AcH4: NLC, 0.71 ± 0.02, n = 6; DE, 0.75 ± 0.02, n = 4; LRE, 0.71 ± 0.03, n = 4; one-way ANOVA: NLC vs. DE, P = 0.62; NLC vs. LRE, P = 0.99; DE vs. LRE, P = 0.61).
Modulation of vGluT-1 and vGAT vesicular transporters in models of VC plasticity
In order to study a possible correlation between markers of excitatory and inhibitory synapses with cortical plasticity levels, the modulation of the vesicular transporters vGluT-1 and vGAT in the different experimental plasticity models was studied. As shown in Figure 9, Western blot analysis showed that vGluT-1 was neither modulated during development (CP, 1.08 ± 0.06 vs. AD, 1.12 ± 0.11, n = 4, Student's t-test, P = 0.78), nor in the experimentally induced models of adult plasticity (FLX, 1.11 ± 0.08 vs. AD, 1.12 ± 0.11, n = 4, Student's t-test, P = 0.90; EE, 1.03 ± 0.01 vs. SC, 0.93 ± 0.05, n = 4, Student's t-test, P = 0.98). As for vGAT, while no modulation was detected during development (CP, 0.92 ± 0.08 vs. AD, 0.91 ± 0.08, n = 4, Student's t-test, P = 0.89), a significant decrease of approximately 50% was observed in fluoxetine-treated adult mice (FLX, 0.45 ± 0.05 vs. AD, 0.91 ± 0.07, n = 4, Student's t-test, P < 0.05), and a decrease of approximately 48% in mice raised in enriched environment (EE, 0.54 ± 0.01 vs. SC, 1.03 ± 0.05, n = 4, Student's t-test, P < 0.05), when compared to controls. In order to show a possible modulation of the relation between the expression of the two markers, the ratio between the value obtained with anti-vGluT-1 antibody and that obtained in the same sample with the anti-vGAT antibody was calculated (Fig. 9C). The data indicated that the vGluT-1/vGAT ratio was not modulated during development (CP, 1.21 ± 0.12 vs. AD, 1.28 ± 0.18, n = 4, Student's t-test, P = 0.79). On the contrary, this ratio increased by approximately 97% following fluoxetine treatment (FLX, 2.52 ± 0.09 vs. AD, 1.28 ± 0.18, n = 4, Student's t-test, P < 0.05) and approximately by 112% in mice raised in the enriched environment (EE, 1.91 ± 0.0 vs. SC, 0.90 ± 0.07, n = 4, Student's t-test, P < 0.05), when compared to controls.
Modulation of Vglut-1 and Vgat in Models of Vc Plasticity. (
Discussion
Recent evidence has shown that epigenetic mechanisms (histone PTMs, noncoding RNAs, DNA methylation) are related to the control of cognitive processes in several brain areas.18–24 Particular attention has been given to the analysis of histone PTMs, specifically lysine acetylation. A specific lysine acetylation pattern on histone H3 and H4 has been associated with different forms of long-term memory formation in the hippocampus, 22 prefrontal cortex, 53 and amygdala.54, 55 Furthermore, an imbalance of histone acetylation/deacetylation has been associated with different neuropsychiatric and neurodegenerative disorders, aging, and drug abuse.56–61 As the pharmacological modulation of histone acetylation was shown to influence numerous biological processes, deacetylase inhibitors are under intensive study for their possible use as clinical treatments in neurodegenerative as well as inflammatory and cancer diseases.35, 36
In the VC, which is a brain area considered a paradigmatic model for the study of molecular mechanisms controlling plasticity, recent evidence has suggested the participation of all the main epigenetic processes in defining plasticity levels. Regarding histone acetylation in particular, in vivo pharmacological treatment with deacetylase inhibitors reinstated plasticity in the adult rodent VC and allowed for amblyopia recovery. 26, 27 Moreover, it has been shown that a developmental reduction of light-induced histone acetylation correlates with the decline of plasticity. 26
In the present work, we aimed at contributing to the characterization of specific lysine histone acetylation in both developmental and experimentally induced adult plasticity experimental conditions in mice raised in normal light-dark conditions, exposed to darkness, and re-exposed to light. The acid extraction method was selected for Western blot experiments to obtain VC samples enriched in basic proteins (histones). While this is a classical and widely used methodology, the quality and reliability of the extraction strategy was further verified by electrophoresis, Western blot, and mass spectrometry analysis. Salt extraction is an alternative strategy that possibly protects and maintains other histones PTMs with respect to the acid extraction. 48 However, in our hands, acid extraction yielded higher amount of histones than with salt extraction, and the presence and maintenance of phosphorylated and acetylated histones was confirmed.
In the first part of this work, we showed that acetylation of both H3 and H4 histones physiologically declines with age. These data are the first obtained in the VC of mice raised in normal light-dark conditions and correlate with very recent data obtained for H3 acetylation in rats. 37 Another work showed that mono-acetylation of H4 diminishes with age in the cerebral cortex of rats. 62 Contrary to our data, no significant modulation of H3 acetylation was observed in that study. This may be due to technical reasons, as in that work mono/multi-acetylated histone forms were separated by AUT (acetic acid/urea/triton) gel electrophoresis while we used selective antibodies recognizing histones exclusively when acetylated in specific lysine residues.
In order to study the modulation by visual experience of specific signaling pathways possibly involved in defining experience-dependent plasticity processes, we used a conventional protocol. Mice were maintained in darkness, and then a part of them was re-exposed to light for a short period (90 minutes), which is compatible with histone acetylation time course in brain structures. 22 We showed that histone acetylation is reduced by exposing mice to darkness and that LRE restores acetylation to levels similar to what was found in mice raised in NLC. This effect was observed exclusively in CP mice but not in AD ones, in agreement with previous results. 26 While we observed a stronger modulation by visual experience of H4 acetylation, previous work had shown that H3 acetylation is modulated more than H4. 26 This may be due to the use of different company antibodies, as well as to the specific lysine residue recognized by the antibodies in use. Whereas the anti-AcH3 antibodies recognize the same Lys9 residue, the anti-AcH4 antibodies are different (present work: Lys8; 26 : Lys5, 8, 12, 16). Nevertheless, a recent work showed that when Lys8 acetylation occurs, also the other H4 lysine residues are found in an acetylated state. 63 In order to confirm the data obtained by Western blot analysis, we performed immunohistochemical experiments to study light-induced histone acetylation in the VC of CP mice. The results obtained are in agreement with our Western blot study, showing an increase of histone acetylation that is stronger for H4 than for H3 histone. The distribution of AcH3 and AcH4 positive cells in the mouse VC shown here was similar to what was described previously for phosphorylated histone H3. 26
In the second part of this work, we used two experimental models known to increase the plasticity levels in the adult VC and to allow recovery from visual defects (fluoxetine administration and EE). The experimental conditions used in the present work were exactly the same as those used in studies analyzing ocular dominance plasticity at functional level in monocularly deprived mice (fluoxetine; 44 EE11, 52). We showed that H3 and H4 lysine acetylation is higher in the VC of treated mice than in controls and that visual experience modulates the acetylation index of both H3 and H4 histones exclusively in the restored plasticity conditions. Similar results were obtained in the two conditions of adult restored plasticity (fluoxetine and EE), indicating that this is a common molecular mechanism. This is the first evidence suggesting a possible role of such epigenetic modification as a mechanism mediating the reactivation of experience-dependent plasticity in the adult mouse VC. Our results are in agreement with data obtained in the VC of rats showing that EE induces an increase of H3 acetylation when compared to rats maintained in SC. 37 Other reports focusing on epigenetic mechanisms regulating cortical plasticity have shown that FLX in the adult rats induces an increase of H3 Lys9 acetylation at the BDNF (brain-derived neurotrophic factor) promoter, which is a neurotrophin critical in the control of cortical plasticity, and a decrease in H3 Lys27 tri-methylation at the promoter of the transcription factor NPAS4 (neuronal PAS domain protein 4), which was recently identified as a mediator of cortical plasticity.25, 64
Our results showed that H3 and H4 lysine acetylation is upregulated in correlation with both developmental and adult restored models of experience-dependent cortical plasticity, suggesting that this epigenetic mechanism is a common factor shared by the two conditions. Besides a recent work showing a similar modulation of H3 acetylation in the rat VC during development and in the adult by EE, 37 to our knowledge this is the first work directly comparing epigenetic mechanisms in different plasticity models of the mouse VC during development and in the adult.
Finally, we studied the expression of the vesicular transporters vGluT-1 and vGAT in the developmental and restored adult plasticity models of the mouse VC. We showed that vGluT-1 is not modulated in the different experimental conditions used, while VGAT is modulated in fluoxetine-treated and environmentally enriched adult mice. vGluT-1 is one of the three members of the vesicular glutamate transporters and more abundant at the cortical level,65–67 thus it is considered a reliable marker of intracortical excitatory terminals. 68 vGAT, also known as VIAAT (vesicular inhibitory amino acid transporter), is able to transport both glycine and GABA neurotransmitters, 69 and is classically used as a good marker of inhibitory cortical terminals.70, 71 Our observation that vGluT-1 and vGAT are not modulated between the CP and adult is in agreement with previous results. In fact, it has been shown that the expression of both transporters increases during cortical development and reach a plateau (around P30 for vGluT-1, and around P15 for vGAT) before or at the same age used in the present work (P28), which is then maintained in the adult.72, 73 Considering the restored adult plasticity conditions, we showed that, contrary to vGluT-1, vGAT is downregulated in the mouse VC by both fluoxetine and EE. Contrasting results have been obtained on the modulation of vesicular transporters by fluoxetine. In fact, an upregulation, downregulation, or no modulation has been observed for both vGluT-1 and vGAT at the cortical level (vGluT-1: upregulation; 74 downregulation; 75 no modulation, present work; vGAT: upregulation; 76 downregulation, present work; no modulation 75 ). This may be due to species differences, the fluoxetine doses, or other technical reasons. Our data on mice raised in EE are partially in agreement with previous results obtained in the rat VC. In fact, it has been recently shown that both vGluT-1 and -2 markers of excitatory terminals are upregulated, while vGAT is downregulated. 77
The balance between the excitatory and the inhibitory tone (E/I) has been suggested as a central player in the control of plasticity levels in the VC.14, 15 The ratio between vGluT-1 and vGAT might not be a good candidate representing the higher level of plasticity in the CP, where excitatory prevails on inhibitory tone,6, 78 with respect to low plasticity adult stages. As synaptic transmission is an extremely complex process where numerous molecular factors participate, it is likely that other proteins may better represent the expected imbalance between the two systems. On the contrary, the reduction of the inhibitory tone obtained by experimental treatments reopening plasticity in the adult possibly occurs via a down-regulation of several molecules controlling inhibition, among which we and others showed that vGAT is included.
The genes and factors that are controlled by histone acetylation that define VC plasticity levels are still largely unknown. It is likely that some of these are genes determining the cortical E/I balance. It has been shown that FLX in adult rats induces an increase in BDNF expression, which is paralleled by increased acetylation status at its promoter regions. 25 It is known that BDNF in the adult influences the E/I balance by decreasing GABAergic transmission.10, 79 A recent study has shown that histone acetylation directly modulates the E/I balance, reducing inhibitory synaptic strength and increasing N-methyl-D-aspartate receptor (NMDAR)-mediated long-term plasticity in adult mice. 80 In agreement with these findings, we observed a correlation between the upregulation of histone acetylation and the downregulation of vGAT in adult mice, suggesting that this is a possible mechanism through which epigenetic processes modulate cortical plasticity. 81
Conclusion
The extremely complex and specific combination of histone PTMs—the histone code—plays a fundamental role in the final determination of transcriptional activity.82, 83 In addition to this complexity, recent advances in the field obtained by high-throughput mass spectrometry (electron-transfer dissociation and collision-induced dissociation) have identified new histone PTMs in the adult mouse brain and described new rules of combination among these PTMs on individual histone proteins. 84
In the field of VC plasticity still is little known, and the present results along with others 41 contribute to the understanding of the neuroepigenetic control of this process. As for PTMs, only the H3 and H4 histones have been analyzed, with particular attention to Lys9—14 acetylation, Ser10 phosphorylation, and Lys4 di-methylation of H3, and to Lys5, 8, 12, 16 acetylation of H4, all of which are considered activators of transcription. As for repressors of transcription, only the Lys27 tri-methylation has been studied in the VC (Table 1).
The determination of the ensemble of histone PTMs as well as the identification of the different combinations altering the accessibility to the DNA transcriptional machinery is a crucial step for understanding the control of gene expression. While a general picture on the epigenetic mechanisms regulating VC plasticity has been recently suggested, 41 little evidence has accumulated up to now. Thus, still much effort is needed to characterize the differential control of gene expression possibly contributing to the different levels of cortical plasticity.
Author Contributions
Conceived and designed the experiments: FMR. Analyzed the data: GV, BP, NB, and FMR. Wrote the first draft of the manuscript: FMR. Contributed to the writing of the manuscript: GV, BP, NB, and FMR. Agreed with manuscript results and conclusions: GV, BP, NB, and FMR. Jointly developed the structure and arguments for the paper: GV, BP, NB, and FMR. Made critical revisions and approved the final version: FMR. All the authors reviewed and approved the final manuscript.
Supplementary Materials
Footnotes
Acknowledgments
The authors wish to thank W. Martínez-LóUpez and V. Bervejillo (Instituto de Investigaciones BiolóAgicas Clemente Estable, Montevideo, Uruguay) for providing CHO cells, Domingo Rilla (Laboratorio Gador S.A., Montevideo, Uruguay) for providing fluoxetine-hydrochloride, Rosario Durán (Institut Pasteur, Montevideo, Uruguay) for technical support in mass spectrometry analysis, Flavio Zolessi and Andrea Villarino (Facultad de Ciencias, UdelaR, Montevideo, Uruguay) for experimental support.