
Abstract
We explored differential protein expression profiles in the mouse forebrain at different stages of postnatal development, including 10-day (P10), 30-day (P30), and adult (Ad) mice, by large-scale screening of proteome maps using two-dimensional difference gel electrophoresis. Mass spectrometry analysis resulted in the identification of 251 differentially expressed proteins. Most molecular changes were observed between P10 compared to both P30 and Ad. Computational ingenuity pathway analysis (IPA) confirmed these proteins as crucial molecules in the biological function of nervous system development. Moreover, IPA revealed Semaphorin signaling in neurons and the protein ubiquitination pathway as essential canonical pathways in the mouse forebrain during postnatal development. For these main biological pathways, the transcriptional regulation of the age-dependent expression of selected proteins was validated by means of in situ hybridization. In conclusion, we suggest that proteolysis and neurite outgrowth guidance are key biological processes, particularly during early brain maturation.
Introduction
While at birth the mammalian brain is anatomically and physiologically immature, it gradually develops during the first few weeks and months of postnatal life. Spontaneous neuronal activity- and experience-dependent neuronal stimulation induce specific activity patterns in the brain, which contribute to the establishment of sensory perception and behavior. Over time, neuronal networks are fine-tuned, resulting in the adequate processing of environmentally-encoded information that enables the animal's sensory-guided behavior, eg, the acquisition of new skills. A substantial degree of anatomical reorganization or structural plasticity is required, which can be achieved through processes such as neuronal migration and differentiation and the strengthening, remodeling and elimination of synapses. 1 Critical periods are characterized by maximal plasticity early in postnatal life when external sensory stimuli have a tremendous impact on the developing brain. 2 These critical periods are preceded by a time window in which the neuronal circuits are refined by molecular determinants and spontaneous activity. 3 Once the brain has matured, a latent plasticity persists throughout life. 4 9 This observed difference in the degree of plasticity makes it important to understand which proteins and pathways drive postnatal plasticity and limit plasticity as the brain matures. 10 Additionally, elucidating the molecular mechanisms enabling plasticity and driving normal brain development will provide new insights into brain disorders, including cell migration disorders such as lissencephaly11,12 and the reeler mutation in mice.13,14
To identify potential mediators of early developmental brain plasticity, we analyzed and compared the forebrain proteomes of 10-day-old (P10), 30-day-old (P30) and adult (Ad) mice using two-dimensional difference gel electrophoresis (2-D DIGE) and mass spectrometry. Using Ingenuity pathway analysis (IPA) software we identified ‘Semaphorin signaling in neurons’ and ‘Protein ubiquitination pathway’ as the main biological processes involving differentially identified proteins. Subsequently, 13 candidate proteins with a suggested role in one of these biological pathways were validated by visualizing their temporal mRNA distribution pattern within the mouse forebrain using in situ hybridization (ISH).
Materials and Methods
Materials
Chemicals were purchased from Merck-Eurolabo (Leicestershire, UK). CHAPS, sodium dodecyl sulfate (SDS), and urea were from Sigma-Aldrich (St. Louis, MO, USA). Dithiothreitol (DTT) from Serva (Heidelberg, Germany). Tris was from ICN (Costa Mesa, California, USA). All solutions, equipment, and software for 2-D DIGE were purchased from GE Healthcare (Little Chalfont, UK) unless stated otherwise. The fluorescent Cy-dyes were synthesized in-house 15 according to the method described by Ünlü et al. 16
Subjects
P10, P30, and 5-month-old adult (Ad) C57BL/6J mice (Janvier Elevage, Le Genest Saint Isle, France) were group housed in standard cages with wood-shaving bedding. The housing environment was temperature and humidity controlled with an 11-h light/13-h dark cycle and food and water were available ad libitum. All experiments were conducted in accordance with the European Communities Council Directive (2003/65/EC) and were approved by the Institutional Ethical Committee of KU Leuven (Animal facilities, KU Leuven).
Animals were anaesthetized with Nembutal (60 mg/kg, intraperitoneally) and killed by cervical dislocation. Brains were immediately collected and olfactory bulbs, cerebellum, and brain stem were removed. Brains were snap-frozen in 2-methylbutane at a temperature of -40°C and stored at -70°C.
2-D DIGE
Sample preparation
For 2-D DIGE (P10, n = 4; P30, n = 3; Ad, n = 3), forebrain tissue was transferred to lysis buffer containing 7 M urea, 2 M thiourea, 4% w/v CHAPS, 1% w/v DTT, 40 mM Tris base, pH 8, and Complete Protease Inhibitor Cocktail (Roche Diagnostics, Basel, Switzerland). Brain tissue was homogenized on ice, briefly centrifuged at 13,000 X g, sonicated, and the proteins were completely solubilized for 1 h at room temperature. Proteins were sonicated and centrifuged for 20 min at 13,000 X g at 4°C to precipitate large cell debris. The supernatant was dialyzed against HPLC-grade water to remove residual salt using a membrane with a 500-Da cut-off and aliquots were stored at —70°C. Protein concentrations were determined using a modified Bradford method. 17
Analytical gels
For each forebrain protein extract, a 50-μg aliquot was labeled with either propyl-Cy3 or methyl-Cy5 dissolved in dimethylformamide (DMF). Samples were incubated for 30 min on ice in the dark to achieve minimal labeling of proteins with approximately 200 pmol dye and the highest signal-to-noise ratio and maximal number of labeled spots. Labeling was terminated by addition of 1 μL lysine (10 mM) for 15 min on ice in the dark. As an internal standard, equal fractions of all mouse brain samples were pooled and labeled with 200 pmol Cy2 dissolved in DMF per 50 μg of protein. The labeled samples were mixed for each experimental group prior to 2-D analysis.
Prior to isoelectric focusing (IEF), the strips were rehydrated overnight at room temperature in DeStreak Rehydration Solution containing 0.5% v/v IPG buffer pH 3-11 non-linear (NL) in a reswelling tray covered with paraffin oil. IEF was carried out in 24-cm long pre-cast Immobiline DryStrips over a pH range of 3-11 (non-linear) on an Ettan IPG phor Cup Loading Manifold system (GE Healthcare) according to the manufacturer's instructions. Briefly, after placing the rehydrated strips face-up in the ceramic manifold, sample cups were placed on top of the rehydrated IPG strip close to its anodic end. Samples containing 150 μg of protein were loaded into the cups, followed by placement of paper wicks and electrodes at the anodic and cathodic ends of the strips. Actual run conditions were 300 V for 3 h, 600 V for 3 h, followed by a 6-h gradient to 1000 V, a 3-h gradient to 8000 V, and 4 h at 8000 V for a total of approximately 75-85 kVh (at 50 μA/ strip). After IEF, strips were stored at —70°C. After thawing, they were equilibrated twice for 15 min by gentle manual shaking in a solution containing Tris-HCl buffer (1.5 M, pH 8.8), 6 M urea, 34.5% v/v glycerol, and 10% w/v SDS. For the first and second equilibration steps, 1% w/v DTT and 4.5% w/v iodoacetamide were added, respectively. IPG strips were run on 1.5-mm thick SDS-polyacrylamide gels (12.5% T; 2.6% C) in the Ettan DALT twelve system for 30 min at 30 mA, followed by 24 h at 15 mA/gel at 13°C. The 2-D DIGE gel plates were rinsed with HPLC-grade water.
Image analysis and statistics
After electrophoresis, the gels containing the CyDye-labeled proteins were scanned with the Ettan DIGE Imager, the images were cropped with Imager software 1.0, and the results were further analyzed using the DeCyder 2-D differential analysis software package v6.5. All gel image triplets were processed using the DeCyder Batch processor. For spot detection, the estimated number of spots for each co-detection procedure was set to 2500. The best internal standard image (Cy2 labeled samples) based on the number of detected spots and overall similarity of the protein spot pattern with that of other gels was assigned as the “Master” and used as a template. On the remaining internal standard images, protein spots were all matched to the master gel to ensure that the same spots were compared between gels. In the biological variation module (BVA), matching of the protein spots across five gels was performed after extensive landmarking and automatic matching. Next, the match was checked manually to determine the accuracy of the match process. Dividing each Cy3 or Cy5 spot volume by the corresponding Cy2 (internal standard) spot volume within each gel gave a standard abundance, thereby correcting for inter-gel variations.
Next, statistical analysis was performed within the BVA module of the Decyder software. A Student's t-test was applied to assess variability between P10, P30, and adult forebrain samples in between groups. Spots of interest (present on all 15 images) were defined as being significantly differentially expressed when P ≤ 0.01 (Student's t-test), and were subsequently identified by mass spectrometry (MS).
Preparative gels and protein identification
Preparative gels were run under the same conditions as described above, with either 1 or 2.5 mg of protein from a single sample applied on each gel. Samples were labeled with 400 pmol Cy5. Gels were scanned in the Ettan DIGE Imager, and proteins were subsequently visualized using the Bio-Safe Coomassie stain (Bio-Rad, Hercules, CA, USA) according to the manufacturer's instructions. By comparing the Coomassie Brilliant Blue (CBB)-stained spot pattern with the corresponding Cy5 protein pattern, spots showing differential fluorescent levels on the 2-D DIGE gels were removed from the preparative gel, using a sterile razor blade. All subsequent steps were carried out under a laminar flow hood in dust-free conditions to prevent keratin contamination of the samples. Identical spots from different gels were pooled. Tryptic digestion was carried out as previously described by Van den Bergh et al.15,18
For MALDI peptide mass fingerprint (PMF) analysis, tryptic peptides were desalted and concentrated using C18 ZipTips (Millipore, Billerica, MA, USA) following the manufacturer's procedure. Next, 0.8 μL of the sample was loaded onto the plate prespotted with 0.8 μL sample loading matrix (a solution of alpha-cyano-4-hydroxycinnamic acid dissolved in 50% ACN/50% ethanol). MALDI-TOF spectra were acquired in the positive-ion reflectron mode on a Reflex IV and on an Ultrafex II mass spectrometer (Bruker Daltonics, Billerica, MA, USA). Near spot calibration was performed using a peptide calibration standard for MS (ref. 206195, Bruker Daltonics). MALDI mass spectra were processed automatically using the FlexAnalysis software version 2.4 (Bruker Daltonics). Searching was done in the Swiss-Prot database with taxonomy restricted to Mus musculus, with carbamidomethyl cysteine as fixed and oxidized methionine as a variable modification, one missed cleavage site allowed, and trypsin as enzyme. For protein identification, a 95% confidence interval threshold (P < 0.05) was set.
For nano-liquid chromatography (LC)-MS/MS analysis, MS/MS was performed on a nano-ESI orthogonal acceleration quadrupole-TOF (Q-TOF) mass spectrometer (nano-ESI Q-TOF, Micromass, Cary, NC, USA). Automated LC-MS/MS analyses were run on an UltiMate Nano LC System (LC Packings, Waltham, MA, USA), with a Switchos Micro Column Switching module, or on an Ultimate 3000 Nano LC System (Dionex Corporation, Waltham, MA, USA) coupled on-line to a Q-TOF (Micromass). Samples were diluted to a volume of approximately 12 μL in 5% ACN v/v, 0.1% FA v/v. Samples were filtered using Ultrafree-MC filters (Millipore) to remove residual gel particles. The total volume of each sample was pipetted in an LC autosampler vial. Then microliters of this peptide solution was loaded on the precolumn (C18 Pep-Map100, I.D.:300 μm x 5 mm, 3 μ m, 100 Å (P/N 160454), LC Packings) and reverse phase eluted over the capillary column (C18 PepMap100, I.D.:75 μm x 15 cm, 3 μm, 100 Å (P/N 160321), LC Packings) at a flow rate of 150 nL/ min. The column outlet was coupled to the Q-TOF through a stainless steel tip (Proxeon, San Mateo, CA, USA) at 1600-2200 V The ionized peptides in the range of 400-1200 m/z were automatically selected and fragmented using predefined collision energy profiles. LC-MS data were processed using the ProteinLynx automated routine (Masslynx 4.0 Global, Waters Corp, Milford, MA, USA) and submitted to the Mascot MS/ MS ion search engine using the same parameters as for analysis of the MALDI-TOF data. For peptide identification, a 95% confidence interval threshold (P < 0.05) was set.
The molecular functions, subcellular locations, and processes of the differentially expressed proteins were determined using Gene Ontology via Protein information resource: http://pir.georgetown.edu/.
Western blotting
Sample preparation
For Western analysis, the brain tissue (P10, n = 3; P30, n = 3; Ad, n = 3) was homogenized in 1–1.5 mL lysis buffer (2% w/v SDS, 50 mM Tris-HCl, 10% glycerol, pH 6.8) containing 40 μL protease inhibitor (Complete Protease Inhibitor Cocktail tablets, Roche). Samples were sonicated and heated at 70°C during 5 min, followed by 15 min of centrifugation at 13,000 x g Next, protein concentration was determined using the standard Lowry method by means of the Micro BCA Protein Assay Reagent Kit (Perbio).
Western analysis
To validate the 2-D DIGE results, the expression differences of 3 proteins (dynamin 1 or Dyn1, fascin 1 or FSCN1, and neuron-specific gamma enolase or ENOG) were analyzed by Western blotting. The optimal loading concentrations were determined using a protein dilution series ranging from 0.5 to 20 μg, resulting in a good signal-to-noise ratio within the linear range of the imaging system. After the addition of 5 μL Reducing Agent (10x, Invitrogen, Carlsbad, CA, USA) and 2 μL of LDS sample buffer (4x, Invitrogen), the samples were denatured (10 min, 70°C). Proteins were separated on 4-12% Bis-Tris NuPage gels (Invitrogen) and transferred to a Sequi-Blot polyvinylidene fluoride membrane (Bio-Rad). The membrane was blocked for 1 h at room temperature with 5% ECL-blocking agent (GE Healthcare) in Tris-saline (FSCN1 and DYN1; 0.01 M Tris, 0.9% NaCl, 0.1% Triton X-100, pH 7.6) or Tris-stock (ENOG; 0.05 M Tris, pH 7.6) and incubated overnight with primary antibodies against DYN1 (1:2000, goat Ab sc-6402, Santa Cruz Biotechnolgies, Santa Cruz, CA, USA), FSCN1 (1:20,000, mouse Ab MAB3582, Chemicon, Temecula, CA, USA), and ENOG (1:5000, mouse Ab sc-21738, Santa Cruz). The next day, the blots were washed with Tris-saline (3 x 5 min), incubated for 30 min with a horseradish peroxidase (HRP)-conjugated secondary antibody (goat anti-mouse-HRP, 1:2000, DAKO, Carpinteria, CA, USA or donkey anti-goat-HRP, 1:50,000, Santa Cruz); rinsed with Tris-saline (5 x 7 min) and Tris-stock (1 x 5 min). Immunoreactivity was detected using chemiluminescence detection (ECL-plus, GE Healthcare) on Hyperfilm ECL (GE Healthcare). The immunoreactive protein bands were semi-quantitatively evaluated by densitometry with ImageMaster 1D prime (GE Healthcare). For each postnatal age and protein of interest, the measured optical densities of 3 mice were averaged.
In situ hybridization
Sample preparation
For ISH (P10, n = 6; P30, n = 6; Ad, n = 7), coronal sections (25 μm) were cut on a cryostat (Microm HM 500 OM), mounted on 0.1% poly-L-lysine (Sigma-Aldrich)-coated slides, and kept at -30°C until hybridization.
Oligonucleotide probes
Identification of relevant biological functions and canonical pathways through the use of IPA.
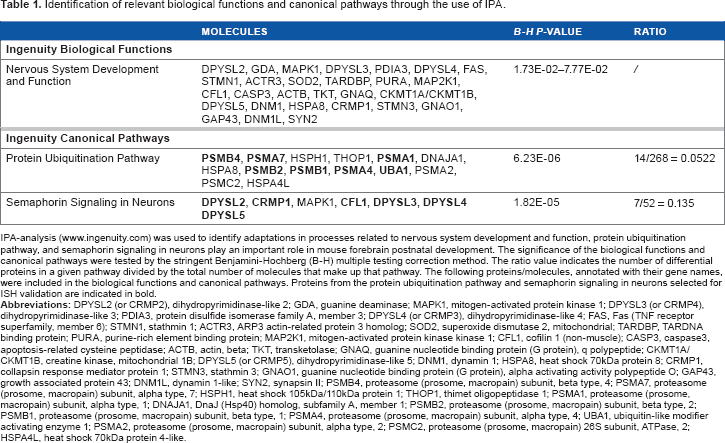
IPA-analysis (www.ingenuity.com) was used to identify adaptations in processes related to nervous system development and function, protein ubiquitination pathway, and semaphorin signaling in neurons play an important role in mouse forebrain postnatal development. The significance of the biological functions and canonical pathways were tested by the stringent Benjamini-Hochberg (B-H) multiple testing correction method. The ratio value indicates the number of differential proteins in a given pathway divided by the total number of molecules that make up that pathway. The following proteins/molecules, annotated with their gene names, were included in the biological functions and canonical pathways. Proteins from the protein ubiquitination pathway and semaphorin signaling in neurons selected for ISH validation are indicated in bold.
ISH
To localize mRNA transcripts in mouse forebrain-ISH was performed using method previously established in our laboratory.21–23 Briefly, coronal sections were post-fixed in 4% v/v paraformaldehyde in 0.12 M phosphoric acid in phosphate-buffered saline (PBS; 0.1 M, pH 7.4, 30 min, 4°C; 0.9% NaCl), dehydrated (50% v/v, 70% v/v, 98% v/v, 100% v/v, 5 min), and delipidated (100% v/v chloroform, 10 min). The mouse specific synthetic probes were end-labeled with 33 P-dATP (NEN) using terminal deoxynucleotidyl transferase (Invitrogen). Unincorporated nucleotides were removed using miniQuick Spin columns (Roche). The radioactive labeled probe was mixed with hybridization cocktail (50% v/v formamide, 4x standard saline citrate, 1x Denhardt's v/v solution, 10% w/v dextran sulphate, 100 μg/mL Herring sperm DNA, 250 μg/mL w/v tRNA, 60 mM w/v dithiothreitol, 1% w/v N-lauryl-sarcosine, 26 mM NaHPO4, pH 7.4) and applied to a series of dehydrated sections with overnight incubation at a temperature of 37°C. The next day, the sections were rinsed in 1x standard saline citrate buffer at 42°C, air-dried, and exposed to an autoradiographic film (Kodak). The specific exposure time for each oligonucleotide probe is listed in Supplemental Table 1. Films were developed in Kodak D19 developing solution and fixed in Rapid fixer (Ilford Hypam, Dallas, TX, USA). Autoradiographic images were scanned (CanoScan LiDE 600F, Canon) and compiled in Adobe Photoshop (version 9.0.2, San Jose, CA, USA).
Results
In this study we investigated age-dependent differences in protein expression during forebrain development by means of 2-D DIGE. Hereto, proteome maps of the mouse forebrain were analyzed at three postnatal time points: P10, P30 and Ad.
Of the approximately 2000 spots present on the gels, 218 spots were differentially expressed during forebrain development (Figs. 1A, 2) with a total number of 195, 194 and only 61 differential spots for P10/P30, P10/Ad and Ad/P30 (pair-wise comparisons) respectively. Forty-four of these 218 spots (20%) were differentially expressed between all postnatal ages. Remarkably, there was an extensive overlap of 135 differential spots between P10/P30 and P10/Ad, while each of these comparisons only shared a limited number of 3 and 6 differential spots with Ad/P30, respectively (Fig. 1B). Combined, these data indicate that P30 and Ad forebrain are relatively similar at the molecular level, while they both differ to a large extent from P10 forebrain.
Overview of differentially expressed protein spots in mouse forebrain development Gel view of the differentially expressed spots for the selected proteins implicated in ‘Semaphorin signaling in neurons’ and ‘Protein ubiquitination pathway’. 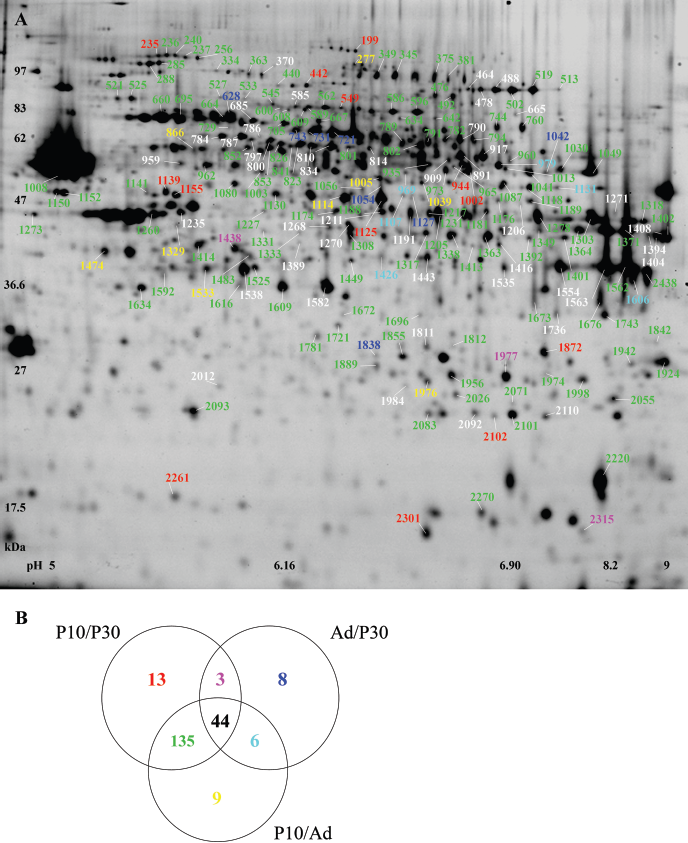

Altogether, 214 of these differential spots (98%) were excised resulting in the reliable identification of 251 unique proteins using mass spectrometry (Supplemental Tables 2, 3). The most pronounced developmentally-induced alterations were detected for Collapsin response mediator protein 4 (CRMP4, spot 787), showing a 40- fold downregulation in Ad compared to P10, and for Caspase 3 (Casp3, spot 1696), with a 14-fold lower expression in P30 compared to P10 (Supplemental Table 2). For 2-D DIGE method validation the postnatal expression levels of 1 protein with a decreasing expression pattern, i.e. FSCN1, and 2 with an increasing expression pattern, i.e. DYN1 and ENOG, were confirmed by Western analysis (Fig. 3).
Western analysis as validation of 2-D DIGE results. List of the 6 selected genes/proteins implicated in ‘Semaphorin signaling in neurons’ summarizing the spot number, differential expression ratios, sequence coverage, subcellular localization, and molecular functions. List of the 7 selected genes/proteins implicated in ‘Protein ubiquitination pathway’ summarizing the spot number, differential expression ratios, sequence coverage, subcellular localization, and molecular functions.


To reveal key biological functions and pathways comprising the differentially identified proteins we implemented the IPA software package. 24 Since the number of differentially expressed proteins at P10 differed most drastically from those at P30 and Ad, we restricted the IPA analysis to the list of proteins that were differentially expressed at this time point towards a better understanding of early brain development. IPA confirmed ‘Nervous system development and function’ as a main biological function (Table 1), thereby validating our experimental approach. In addition, ‘Semaphorin signaling in neurons’ and ‘Protein ubiquitination pathway’ were highlighted as essential canonical pathways operative in the mouse forebrain during postnatal development (Tables 1–3; Fig. 2).
The spatial and temporal (P10, P30, and Ad) changes in the mRNA distribution patterns of 13 genes encoding for proteins involved in these pathways were visualized throughout the postnatal mouse forebrain via ISH to verify transcriptional/translational regulation of expression (Figs. 4, 5; Tables 2, 3; Supplemental Table 1). Figure 4 illustrates the mRNA distribution of 6 genes/proteins involved in ‘Semaphorin signaling in neurons’, i.e. cofilin 1 (cfl1) and collapsin response mediator protein 1–5 (crmp1–5). At P10, a very strong hybridization signal is widely distributed throughout the forebrain, often including all major subdivisions like cortex, hippocampus, hypothalamus and thalamus. The transition from P10 to P30 is characterized by a strong decline in expression for most of the mRNAs, resulting in rather similar distribution patterns for P30 and Ad forebrain. Age-specific mRNA expression profiles related to proteolysis (Fig. 5) were shown for 7 genes/proteins, i.e. proteasome subunit alpha 1, 4, 7 (psma1, 4 and 7), proteasome subunit beta 1, 2, 4 (psmb1, 2 and 4), and ubiquitin-like modifier activating enzyme 1 (uba1). For some of the genes/proteins (psma4 and psmb2) the RNA hybridization patterns appeared already restricted to the hippocampus at P10. For several ubiquitin proteasome family members a layer-specific mRNA expression level in the cortex was observed. In general, hybridization signals in mouse forebrain tended to decrease towards P30 and Ad.

Differential mRNA distribution of 6 proteins implicated in Semaphorin signaling in neurons. In general, mRNA expression for cfl1, and crmp1–5 was higher in p10 forebrain compared to P30 and Ad brain. Corresponding oligonucleotide sequences and swiss-Prot entries can be found in Supplemental Table 1. Major brain subdivisions are indicated (Cx, neocortex; DG, dentate gyrus; H, hippocampus; Hyp, hypothalamus; Th, thalamus). Scale bar = 2 mm.

Differential mRNA distribution of 7 proteins implicated in the protein ubiquitination pathway. Forebrain development is accompanied by a clear decrease in the mRNA expression of proteolysis-related proteins, ie, psma1, 4, 7, psmb1, 2, 4, and uba1, from P10 to P30 and Ad. Corresponding oligonucleotide sequences and Swiss-Prot entries can be found in Supplemental Table 1. Subcortical structures correspond to those indicated in Figure 4. S and I indicate supra- and infragranular layers of the neocortex, respectively, and highlight the switch in relative intensity with age. Scale bar = 2 mm.
Discussion
In the present study, we applied 2-D DIGE to identify proteins relevant to different stages of postnatal mouse brain development. This experimental design enabled the identification of 251 differentially expressed proteins over the course of forebrain development. Numerous neuronal proteins were present in this list of developmentally regulated proteins, including CRMP2, 25 CRMP4,25,26 DYN1, 27 ENOG, 28 4-Aminobutyrate aminotransferase, 29 Growth associated protein 43, 30 Neurolysin, 31 Septin 5, 32 and Vdac1 Protein. 33 A major part of the mapped proteins are already associated with developmental processes (Supplemental Tables 2, 4), but to our knowledge L-3-hydroxyacyl-coenzyme A dehydrogenase (HAD) and Pyridoxal kinase have not been linked to development. The enzyme HAD is involved in the metabolism of fatty acids 34 and Pyridoxal kinase is implicated in vitamin B6 metabolism. 35
Different energy substrates are available to cells in the brain during the different developmental stages, 36 and different metabolic enzymes will be involved during development. Interestingly, the correlation of a distinct set of proteins to Semaphorin signaling in neurons and Protein ubiquitination pathway, ie, neurite outgrowth guidance and proteolysis, respectively, characterize these biological processes as relevant to early brain development.
Distinct proteomic changes after P10
The aim of this study was to identify key proteins involved in mouse brain development. The analysis comprised three developmental stages: P10, P30, and Ad. At P10, the peripheral sensory organs had not responded significantly to sensory experiences and therefore brain maturation was likely to continue progressing, mainly in a sensory-independent manner, while at P30, neuronal circuits became extremely sensitive to sensory experiences and therefore easily adapt accordingly. Although the adult brain is plastic, it is certainly characterized by less pronounced structural adaptations in response to environmental stimuli. At the proteome level, our results confirmed the differences in mouse forebrain between the three developmental stages, with the most striking changes in protein expression observed between P10 and each of the older developmental stages, ie, P30 and Ad.
We suggest that this proteomic contrast in P10 versus P30 and Ad mouse forebrain can be attributed to the brain growth spurt. 37 This transient period of accelerated brain growth is caused by the rapid expansion of dendritic arbors from newly differentiated neurons throughout the brain in order to provide the required surface area to accommodate new synaptic connections. In the murine brain, this process starts at approximately P1, peaks at about P10–12, and lasts until the 3rd/4th postnatal week. 37 40
Neurite outgrowth guidance
Axonal growth, guidance, and branching are all key elements of neuronal development. Moreover, axonal arborization is a critical step in the establishment of precise neural circuits. Thalamocortical axons start invading mouse cortex around birth and elaborate their arbors over the following 2–3 weeks.41,42 A threefold increase in the branch density of thalamocortical axons was reported between P5–6 and P14–19 in the mouse cortex. 43 Furthermore, during the third postnatal week, practically no change in thalamocortical axons in comparison to earlier postnatal periods was observed. 43
Several proteins with a prominent differential expression at P10 showed Semaphorin signaling in neurons as a functional classification. Coflin1 (COF1) is an actin-associated protein, which regulates actin dynamics in the growth cone. 44 Besides COF1, this canonical pathway also included all 5 members of the CRMP family (Tables 1, 2). This CRMP family of neuron-enriched phosphoproteins has been implicated in guidance and outgrowth of neuronal axons. 45 48 More specifically, CRMP2 mediates the collapse of neuronal growth cones when they encounter Semaphorin 3A, the most potent repulsive molecule inhibiting or repelling neurite outgrowth.49,50 We identified CRMP2 in 13 different spots (Table 2). Altogether, three CRMPs (1, 2, and 4; Tables 1, 2) were present in more than one spot, which mirrors extensive age-dependent changes in their posttranslational modifications or the existence of splice variants. 51 53
Previous studies for CRMPs on mouse brain 53 57 and other species15,18,58–61 also reported an age-dependent expression in mammalian brain. Byk et al 62 illustrated an identical mRNA expression pattern for CRMP1, 3, and 4 in the rat brain, characterized by an age-dependent decrease. Also, comparable distribution patterns for CRMP1, 2, 4 and 5 in cat brain were described by Cnops and coworkers. 59 In general, CRMP levels in the adult brain are reduced and are mainly expressed in areas that retain a certain form of plasticity and/or neurogenesis including the hippocampus and the ventricular zone. 63 Moreover, CRMP expression in the adult brain stresses the importance of axonal outgrowth possibly functioning as a mechanism of repair and regeneration of adult neurons.60,61,64
Proteolysis
The protein ubiquitination pathway was highlighted as a second prominent functional process in our IPA analysis. Most proteins belonged to the ubiquitin proteasome system, including proteasome associated proteins (PSA1, 4, and 7; PSB1, 2, and 4) and ubiquitin-activating enzyme E1 X (UBA1). Whereas the ubiquitin proteasome system has long been recognized as one of the major cellular pathways controlling protein turnover, only recently has it emerged as a key regulator of synaptic development and function. 65 Therefore, regulation of proteasome activity could play an important role in the modification of specific synapses in response to external stimuli. In accordance, proteasomal activity in the brain diminishes during the natural aging process. 66 68 Moreover, Yashiro and coworkers 68 showed that ubiquitin protein ligase E3A is vital for maintaining plasticity during experience-dependent neocortical maturation. However, the precise molecular mechanisms by which proteolysis causes synaptic changes remain elusive.
Conclusion
The present study examined changes in the proteome of the mouse forebrain before, during, and after the period of maximal adaptation to sensory experience to identify potential mediators of brain development and plasticity. The large range of proteins that are up- and/or downregulated with age under-score the diversity and complexity of processes that must be coordinated in order to establish and consolidate the mature cellular network. Our findings discriminate the P10 forebrain from the P30 and adult and reveal neurite outgrowth guidance and proteolysis as functional processes typical of early brain development. Our protein list extends previously reported molecular pathways associated with developmental brain plasticity and therefore provides additional key information for future research towards the development of new treatments for developmental and adult brain disorders.
Author Contributions
Conceived and designed the experiments: BVdP, GVdB, LA. Analyzed the data: BVdP, GVdB, SC, AL, LA, TTH. Wrote the first draft of the manuscript: BVdP. Contributed to the writing of the manuscript: BVdP, LA, AL, TTH. Agree with manuscript results and conclusions: BVdP, LA, AL, GVdB, SC, TTH. Jointly developed the structure and arguments for the paper: BVdP, LA, AL, TTH. Made critical revisions and approved final version: LA, AL, TTH.
Disclosures and Ethics
As a requirement of publication the authors have provided signed confirmation of their compliance with ethical and legal obligations including but not limited to compliance with ICMJE authorship and competing interests guidelines, that the article is neither under consideration for publication nor published elsewhere, of their compliance with legal and ethical guidelines concerning human and animal research participants (if applicable), and that permission has been obtained for reproduction of any copyrighted material. This article was subject to blind, independent, expert peer review. The reviewers reported no competing interests.
Supplemental Data
Footnotes
Acknowledgements
We gratefully thank Ria Van Laer and Lieve Geenen for expert technical assistance and Prof. Dr. Geert Baggerman for sharing knowledge.