
Abstract
In vivo 13C magnetic resonance spectroscopy (MRS) enables the investigation of cerebral metabolic compartmentation while, e.g. infusing 13C-labeled glucose. Metabolic flux analysis of 13C turnover previously yielded quantitative information of glutamate and glutamine metabolism in humans and rats, while the application to in vivo mouse brain remains exceedingly challenging. In the present study, 13C direct detection at 14.1 T provided highly resolved in vivo spectra of the mouse brain while infusing [1,6-13C2]glucose for up to 5 h. 13C incorporation to glutamate and glutamine C4, C3, and C2 and aspartate C3 were detected dynamically and fitted to a two-compartment model: flux estimation of neuron-glial metabolism included tricarboxylic acid cycle (TCA) flux in astrocytes (Vg = 0.16 ± 0.03 µmol/g/min) and neurons (VTCAn = 0.56 ± 0.03 µmol/g/min), pyruvate carboxylase activity (VPC = 0.041 ± 0.003 µmol/g/min) and neurotransmission rate (VNT = 0.084 ± 0.008 µmol/g/min), resulting in a cerebral metabolic rate of glucose (CMRglc) of 0.38 ± 0.02 µmol/g/min, in excellent agreement with that determined with concomitant 18F-fluorodeoxyglucose positron emission tomography (18FDG PET).We conclude that modeling of neuron-glial metabolism in vivo is accessible in the mouse brain from 13C direct detection with an unprecedented spatial resolution under [1,6-13C2]glucose infusion.
Introduction
13C magnetic resonance spectroscopy (MRS) is a powerful tool that enables direct measurement of brain metabolic fluxes in vivo in humans and in animal models. The low natural abundance of the 13C isotope (1.1%) has been exploited by infusing 13C-labeled substrates, used as tracers, to explore the metabolic fate of the substrate through metabolic pathways of interest by measuring the progressive labeling of the downstream metabolic products. Specifically, given the central role of glucose (Glc) in brain energetics, [1-13C]glucose and [1,6-13C2]glucose have been used to assess brain metabolism and neurotransmission mainly through the measurement of the progressive enrichment of glutamate (Glu) and glutamine (Gln) in the positions C4, C3, and C2.1–3 From the separate detection of Glu and Gln 13C peaks, it is possible to assess the rate of the tricarboxylic acid (TCA) cycle, the pyruvate carboxylase pathway (PC), the Glu and Gln cycle through neurotransmission, and the exchange between 2-oxoglutarate (OG) and Glu.
Alternatively, brain glucose metabolism can be measured with 18F–fluorodeoxyglucose positron emission tomography (18FDG PET) allowing the determination of local cerebral metabolic rate of glucose (CMRglc). The use of 18FDG in vivo enables the local estimation of total glucose consumption in oxidative and non-oxidative pathways, however without details on further steps in those biochemical pathways, since it does not provide distinction between different labelled metabolic products (chemical specificity). This extension is made possible when using NMR spectroscopy with introduction of stable isotopes, in particular 13C MRS.
Although in recent years metabolic modeling of in vivo 13C MRS data has been successful in describing the compartmentalized metabolism between neuronal and glial cells,4–8 the applicability of highly detailed models is often limited by the intrinsic low sensitivity of the technique, especially in small volumes, as it is the case for mouse brain. Using direct detection of 13C nuclei, a large number of 13C resonances are potentially accessible since the wider chemical shift range associated with 13C spectra compared to indirect detection via 1H nuclei results in well resolved 13C peaks, however, at the cost of a more significant chemical shift displacement error. Nevertheless, when taking advantage of the smaller 1H chemical shift range to perform the localization in the 1H channel, detection of broadband localized 13C MRS in vivo spectra in the rat brain after infusion of [1,6-13C2]glucose was shown to be feasible at 9.4 Tesla by using 1H-localisation and a semi-adiabatic DEPT sequence. 9 Indirect 1H-[13C] MRS detection is an alternative that leads to an increased signal-to-noise ratio (SNR) given the higher gyromagnetic ratio of 1H, however at the expense of the smaller 1H chemical shift range, which limits the distinct detection of Glu and Gln C3 and especially C27,10,11 resonances.
More recently, direct 13C detection and localization in the 1H channel at ultra-high magnetic fields were combined with a neuro-glial modeling scheme 4 leading to an extended characterization of the fluxes related to energy metabolism and neurotransmission between neurons and glia in the rat brain. 6 The separate detection of Glu and Gln at the position C4 and C3 is the minimal prerequisite to distinctly quantify cell-specific, i.e. astrocytes versus neurons metabolism with minimal assumptions, as was earlier shown for [1-13C] or [1,6-13C2]glucose infusion protocols. 12 However, the inclusion of Glu and Gln labeling in the position C2 is typically necessary for two-compartment modelling with minimal a priori constraints on glial TCA cycle (Vg) and pyruvate carboxylase rate (VPC) with infused 13C-labeled glucose. The addition of other time courses such as aspartate (Asp) labelling generally increases the robustness of the model.6,12 The separate measurement of Asp, Glu and Gln at the position C2 remains only feasible through direct detection due to the increased spectral dispersion especially at high magnetic fields. The importance of the inclusion of C3 and C2 Glu/Gln time courses in the modeling arises from the influence of VPC in their progressive labeling: in fact, this chemical reaction leads to labeling accumulation in the position C2 of Glu and Gln while diluting the positions C3 from the incorporation of a 12C.
Besides the sensitivity limitation given by the small volume of the mouse brain compared to larger rodents, the experimental protocol brings additional challenges given the difficulty in performing serial blood sampling during the acquisition. Finally, the reduced size of brain structures entails more pronounced magnetic susceptibility variations that will potentially affect the linewidth and consequently the SNR of the spectra. Nonetheless, extending the application of 13C MRS to the study of mouse brain and eventually applying metabolic modeling could open the way to the characterization of brain metabolism in different animal models within genetically engineered mice.
To our knowledge, in vivo 13C MRS in the mouse brain was performed only once using direct detection and infusion of [1,6-13C2]glucose, 13 however without metabolic modelling interpretation, remaining otherwise mainly limited to rat studies.5,6,14,15 In the present study, we aimed to combine state of the art techniques in 13C detection in the mouse brain with metabolic modelling of such data for the quantification of neuro-glial fluxes. High-quality 13C MRS spectra in volumes as small as 112 µL were needed for the measurement of turnover curves of Glu, Gln and Asp with sufficient temporal resolution to be analyzed with a two-compartment model of brain metabolism accounting for distinct neuronal and astrocytic metabolism. 4 Minimal modelling assumptions resulted in a detailed characterization of mouse brain metabolism. For this purpose, a dedicated high sensitivity 13C/1H surface coil for mice was designed and used in conjunction with a semi-adiabatic polarization transfer sequence to overcome the limitations given by RF field inhomogeneity. CMRglc values derived with PET upon 18FDG administration in the same brain region were used to provide a cross-validation of the metabolic flux analysis obtained from 13C MRS metabolic modeling. The feasibility of detailed in vivo dynamic 13C MRS in mice potentially opens the way to its applicability to a number of transgenic models available or in smaller brain regions, reaching a new standard in spatial resolution with 13C direct detection.
Materials and methods
All animal experimentation procedures were carried out in compliance with the local ethical guidelines (EXPANIM, Expérience sur animaux-SCAV, Service de la consommation et des affaires vétérinaires, Switzerland) and approved by the Veterinary Office of the Canton Vaud. Experimental procedures were reported in compliance with the ARRIVE guidelines.
In vivo 13C NMR spectroscopy
Six male mice (Swiss NUDE, eight weeks old, 28–30 g, Charles River, L’Arbresle Cedex, France) were used for the 13C MRS experiments. The mice were housed in filter-top cages, with a 12/12-h light-dark cycle, one mouse per cage. Mice were provided with bedding material, enrichment, and nesting material. They were fasted overnight for 7 h with free access to water before studies. Mice were anesthetized with isoflurane (1–1.5%) for tail vein catheter insertion for substrate administration. Respiration rate (∼100 bpm) was monitored continuously during mouse anaesthesia (SA Instruments Inc., NY, USA) and isoflurane level adjusted accordingly. After surgical preparation, mice were transferred in the magnet and placed in a home-made holder that allows fixing the head stereotactically with the help of a bite bar/nose cone and ear rods (Rapid Biomedical, Rimpar, Germany). Body temperature was kept stable (37.0–37.5℃) with the use of a circulating water hose and continuously monitored using a home-built rectal temperature probe. Experiments were performed in a 14.1 Tesla, 26-cm horizontal bore magnet (Varian, Palo Alto, CA/Magnex Scientific, Oxford, UK), using a home-built 9-mm(13C)/15-mm(1H quad) surface coil as receiver and transmitter. The magnet is equipped with actively shielded gradients of (12-cm inner diameter, Magnex Scientific, Oxford, UK) allowing a maximum gradient strength of 400 mT/m in 120 µs. An image acquired with a fast spin-echo sequence was performed in order to position the voxel (TR/TE = 5000/13 ms, FOV = 18 × 18 mm, slice thickness 1 mm, 4 averages). Magnetic field inhomogeneity was minimized by optimizing first and second-order shims with FAST(EST)MAP 16 (21–29 Hz on localized water peak). A 1H spectrum was collected in the same voxel as for the dynamic 13C MRS prior to the adjustment of 13C MRS parameters and substrate injection, using a short-TE localized SPECIAL sequence 17 (TR/TE = 4000/2.8 ms) in order to obtain total metabolite concentrations. Direct detection was achieved through a semi-adiabatic DEPT polarization transfer sequence (TR = 2.5 s, interpulse delay of 3.8 ms (optimized for JCH = 130 Hz), 45° for the last 1H pulse for the simultaneous detection of CH, CH2, CH3 groups) combined with 1H localization. 9 A small sphere filled with 99% 13C-enriched formic acid was placed on the top of the coil in order to provide a reference signal both for 13C offset frequency and B1 calibration in the 13C channel, taking into account the changes in coil loading and distance from the measured voxel to the coil. After the calibration, the infusion protocol started with an initial 5-min exponential bolus of 99% enriched [1,6-13C2]glucose, followed by 5 h of continuous infusion of 70% enriched [1,6-13C2]glucose (20% mass per volume solution). The bolus volume per animal weight was 4.01 mL/kg; and the total volume of continuous infusion was 1.99 mL/kg/h. These bolus and continuous infusion rates were established from bench experiments and tail vein blood sampling, where the infusion rate was varied in order to maintain glycemia levels at ∼ 300 mg/dL. Localized 13C spectra were acquired from a volume of 112 µL (3.6 × 6.9 × 4.5 mm3) covering most of the brain but avoiding lipid contamination from the scalp (Figure 2(c)). Spectra were acquired continuously over 5 h in blocks of 10.6 min. Shimming was repeated every 32 min in order to keep the linewidth constant.
Spectra quantification of 1H and 13C spectra was performed using LCModel. 18 Normalization procedure of spectra for absolute quantification of 13C metabolite concentrations is described as Supplementary Information. Normalization for RF efficiency on resonances at different frequency offsets as well as for the different efficiency of the DEPT transfer for CH and CH2 groups was achieved applying a correction factor derived from a natural abundance spectrum acquired on a phantom filled with non-labeled compounds (Glu, Gln, Asp) and scanned under identical experimental conditions.
18FDG positron emission tomography
2-Deoxy-2-18F-fluoro-D-glucose (18FDG) was delivered to the CIBM from the commercial 18FDG production facility at the Center for Radiopharmacy at the University Hospital in Zurich, Switzerland. 18FDG was synthesized using aminopolyether supported nucleophilic fluorination of the complex 1,3,4,6-tetra-O-acetyl-2-trifluor-methanesulfonyl-β-D-mannopyranose (mannose triflate) as precursor, and the aminopolyether potassium complex [K/2.2.2]+18F− as phase-transfer catalyst. This process involved: (a) the addition of mannose triflate into the 18F- with acetonitrile; (b) hydrolysis to remove the protective acetyl groups to form 18FDG; and (c) purification of the final 18FDG product. The injectate was composed by the following components: the active pharmaceutical ingredient 18FDG, the nuclide [18F] Fluorine and the pharmaceutical additives: NaH2PO4.2H2O (1.2 mg/ml), Na2HPO4.2H2O (4 mg/ml), NaCl (7.5 mg/ml), and Na2S2O3.5H2O (1.3–1.9 mg/ml).
Six healthy male NUDE mice (33.4–35.4 g) were used for the PET experiments. Mice were anesthetized for tail vein catheter insertion (25G home-made catheter). Initial values of glycemia were obtained at the same time, prior to administration of 18FDG. List-mode acquisitions were obtained with a single field of view centered on the body midsection, allowing the inclusion of the brain and inferior vena cava, and initiated with i.v. injection of 18FDG (1.6 ± 0.3 MBq/g body weight; mean ± SD; volume of injectate 50–400 µL) through the tail vein catheter within the first 10 s of the PET scan, followed by 100–150 µL of saline chase solution. Imaging was performed using an avalanche photodiode micro-PET scanner (LabPET4, GammaMedica, Sherbrook Canada). Mice were maintained under 1% isoflurane anaesthesia in oxygen delivered at 0.9 L/min using a face mask with constant monitoring of temperature and breathing rate. An energy window of 250–650 keV and a coincidence timing window of 22.2 ns were used for the detection of photons at 511 keV resulting from annihilated electron-positron pairs. For image reconstruction, a built-in iterative maximum likelihood expectation maximum-based image (MLEM) reconstruction algorithm was used in a cylindrical volume of 46 mm in diameter and 7 cm in length. Voxel size measured 0.5 × 0.5 × 1.18 mm3, giving a typical resolution of <1.2 mm at the center of the FOV.
For temporal histogramming, the following time frames (F) were used: 24 F of 5 s duration; 6 F of 30 s duration; 5 F of 2 min duration; and 7 F of 5 min duration. All post-processing of images was performed using PMOD 2.95 software (PMOD Technologies Ltd, Switzerland).
The image-derived input function (IDIF) was determined from the time activity curves (TAC) of 18FDG in the blood at the level of the inferior vena cava. 19 Briefly, the volume of interest (VOI) drawn for the input function consisted in four adjacent regions of interest (1 mm2 surface and 1.18 mm thickness) in axial slices in correspondence of the vena cava. Their location was established based on visual inspection of the maximum intensity projection image in the coronal plane where the flow of 18FDG was observed during the bolus. The brain tissue TACs (tTACs) were selected from mid-brain and were of the same volume and shape as the region scanned during 13C MRS (Figure 5). The measured radioactivity was corrected for the 18F radioactive decay (relative to the start of the acquisition).
Metabolic modeling of 13C MRS data
13C MRS dynamic data were modelled following a neuro-glial compartmentalized scheme, as previously shown.
4
Two-compartment scheme for glucose metabolism and label scrambling from [1,6-13C2]glucose into the different carbon positions of the measured amino acids are summarized in Figure 1.
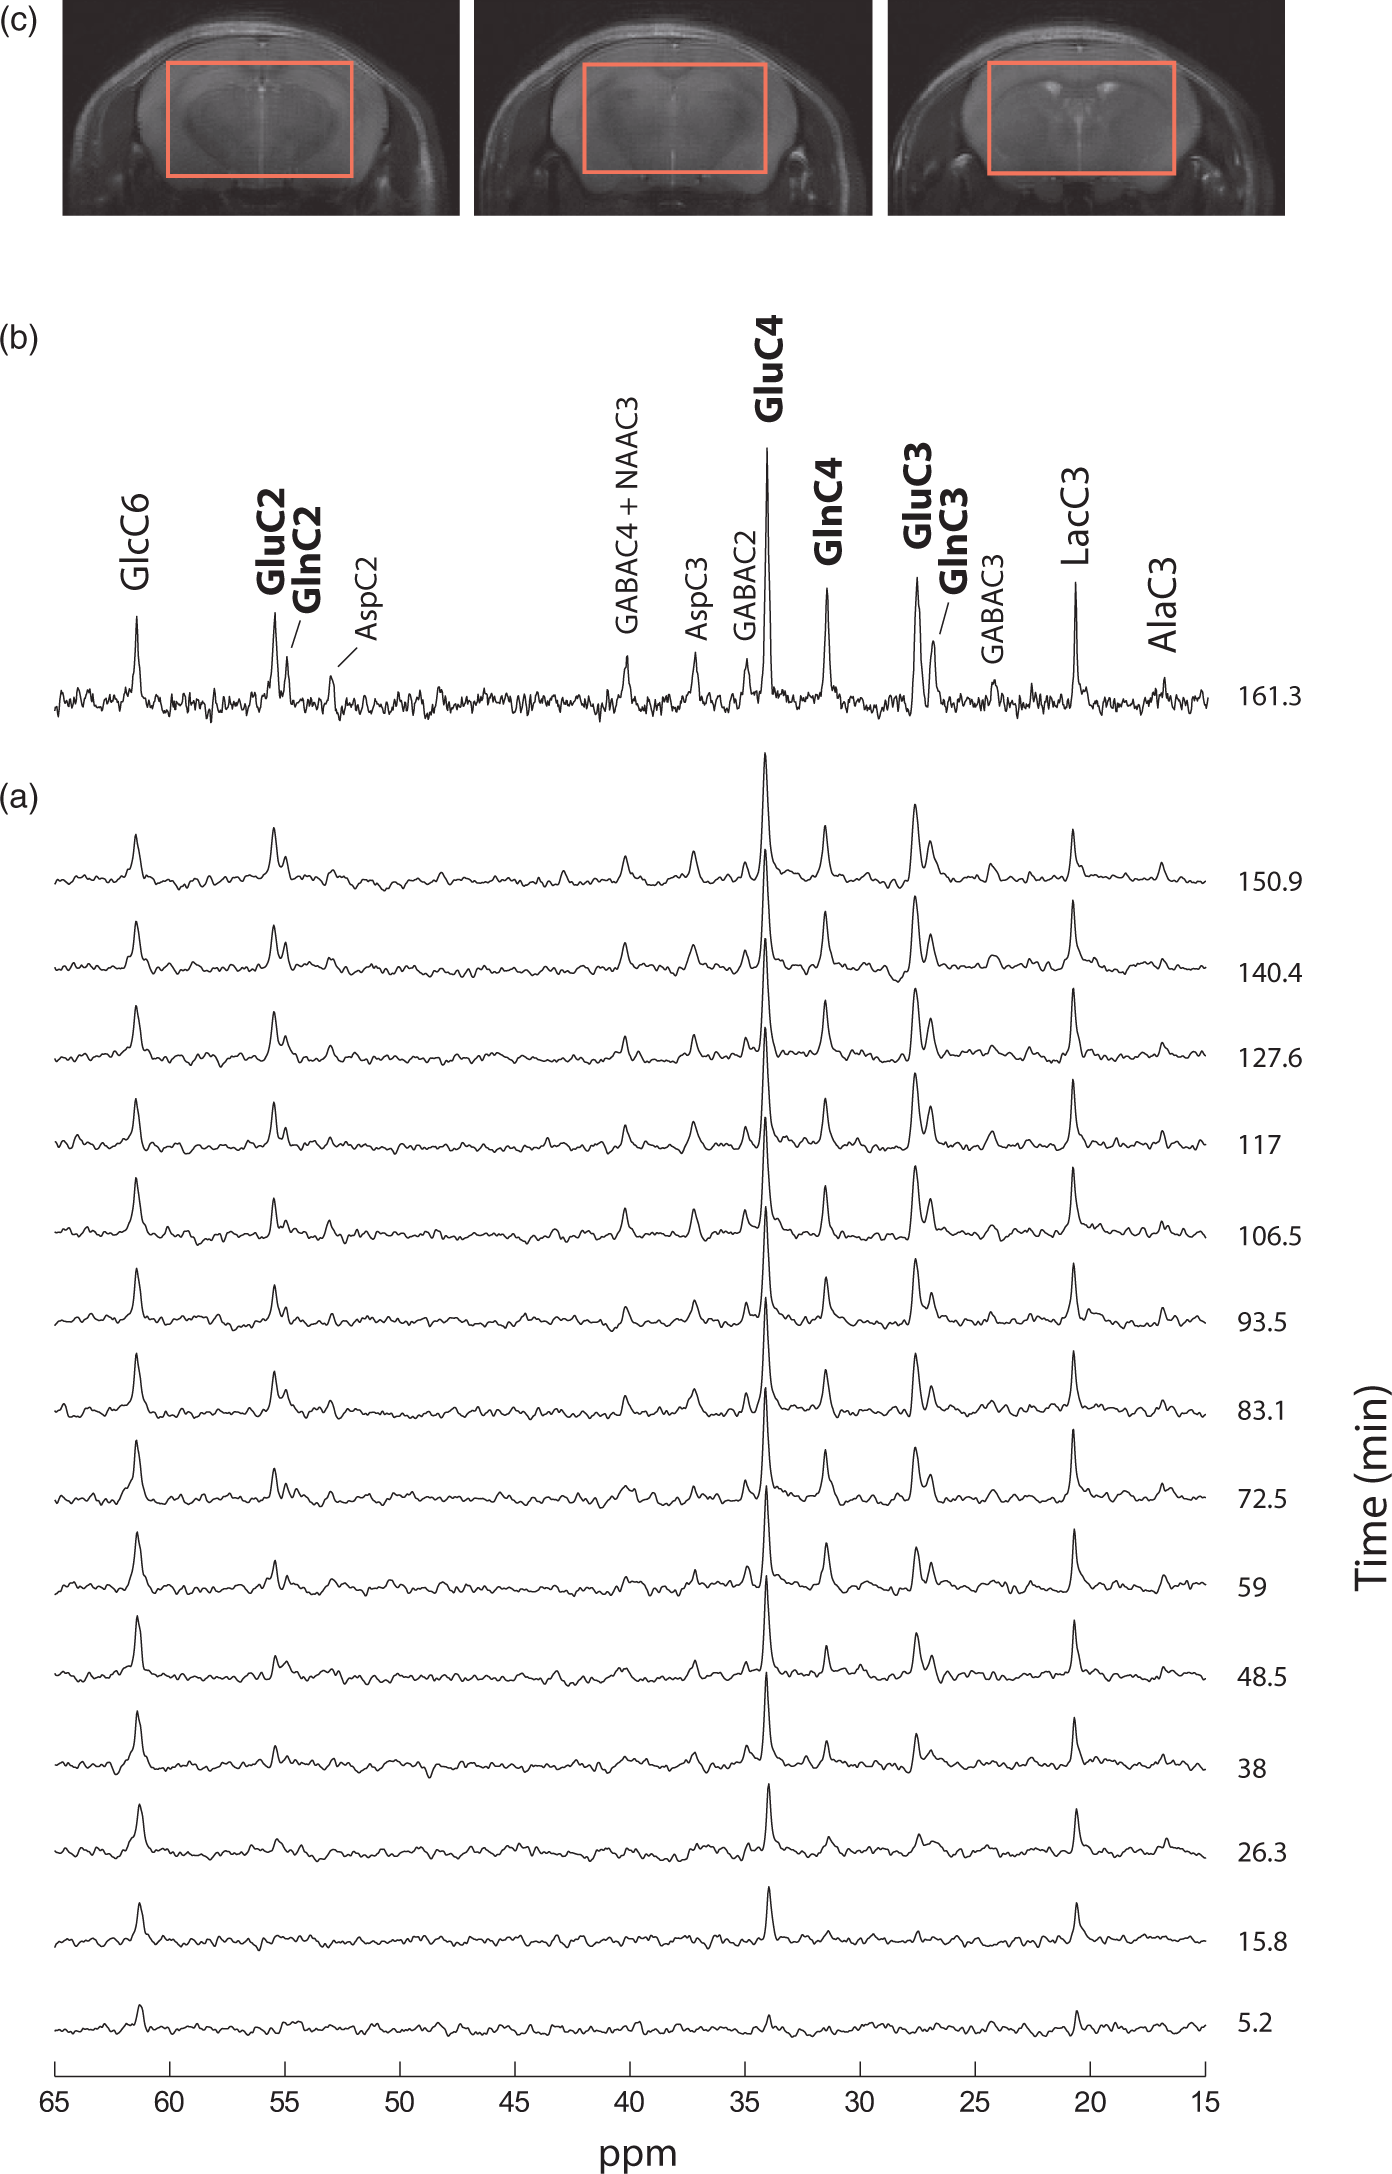
(a) Two-compartmental model of neuro-glial metabolism in the brain used to describe 13C label transfer upon [1,6-13C2]glucose infusion in the present study. Glucose is rapidly taken up by brain tissue from the blood stream after passing through the blood–brain barrier. Glycolysis converts it into pyruvate (Pyr) which is not detectable in vivo due to its small pool size. Given the rapid exchange between Pyr and lactate (Lac) as compared to the TCA cycle flux, they are considered as an indistinguishable pool that is in turn diluted by VLdil (inflow from blood-borne lactate) and loses 13C label through Vout (outflow towards blood). In both compartment, Pyr is converted into acetyl-CoA (AcCoA), which is entering the TCA cycle. The glial compartment is characterized by conversion of Pyr into oxaloacetate (OAA) through pyruvate carboxylase (VPC) and by glial specific substrates Vdilg. Conversion of AcCoA in 2-oxoglutarate (OG) leads to glutamate (Glu) synthesis in both compartments through the transmitochondrial flux Vx (Vx + VPC in the glial compartment). After a synaptic neurotransmitter release, Glu is rapidly taken up from the synaptic cleft by glial cells at an apparent neurotransmission rate (VNT), converted into glutamine (Gln) through the action of glutamine synthetase (VGS) and released in the extracellular space where it is mainly taken back by neurons for conversion into Glu and refilling of the neurotransmitter vesicles, completing the Glu/Gln cycle. Alternatively, Gln is released in the extracellular space generating a net efflux (Vefflux) which is compensated by de novo biosynthesis of TCA cycle intermediates in the glial compartment through VPC. Aspartate (Asp) labeling is essentially attributed to the neuronal compartment from the direct exchange with OAA through Vx in the malate/aspartate shuttle. (b) 13C labeling scheme from [1,6-13C2]glucose (Glc1,6) metabolism through glycolysis and TCA cycle. Metabolites visible at steady-state in typical in vivo scans are marked in bold. Glc1,6 leads to C3 labeling in pyruvate (Pyr3). Alanine transaminase (ALT) and lactate dehydrogenase (LDH) regulate the labeling transfer to alanine C3 (Ala3) and lactate C3 (Lac3), respectively. Alternatively, Pyr3 labels the C4 position in 2-oxoglutarate (OG4) and glutamate (Glu4) and consequently in glutamine (Gln4), through the TCA cycle and further through glutamate/glutamine cycling. Multiple turns of the TCA cycle (grey lines) eventually lead to a progressive labeling of the positions C3 and C2 according to the scheme. VPC (dashed line) brings additional labeling at the position C2 as well as a dilution at the position C3 of OG, reflected in glutamate and glutamine and representing a distinctive feature for glial compartment TCA metabolism. GABA C4 (GABA4), C3 (GABA3), and C2 (GABA2) are synthetized from glutamate C2 (Glu2), C3 (Glu3), and C4 (Glu4), respectively, through GABAergic neurotransmission (VGAD). The transmitochondrial flux Vx regulates the exchange between oxaloacetate and aspartate that will in turn label N-acetyl aspartate (NAA). Only the positions C2 and C3 of aspartate (Asp2, Asp3) and NAA (NAA2, NAA3) are visible in the observed chemical shift range. NAA is also labeled at the position C6 (NAA6) from acetyl-CoA (AcCoA2). Typical 13C MRS spectra acquired at 14.1 Tesla in a volume of 112 µL and a time resolution of 10.2 minutes. (a) Spectra collected after the bolus of 99%-enriched [1,6-13C2]glucose and during continuous infusion for the first 150 mins with a temporal resolution of 10.2 min. Spectral SNR is enhanced by exponential apodisation (lb = 25 Hz). (b) Spectrum acquired at 160 min following the bolus during 10.2 minutes (SNR = 11; lb = 9 Hz). (c) Three consecutive coronal slices (1 mm thick) of a T2-weighted image acquired prior to 13C MRS experiments showing voxel localization in the middle brain (3.6 × 6.9 × 4.5 mm3).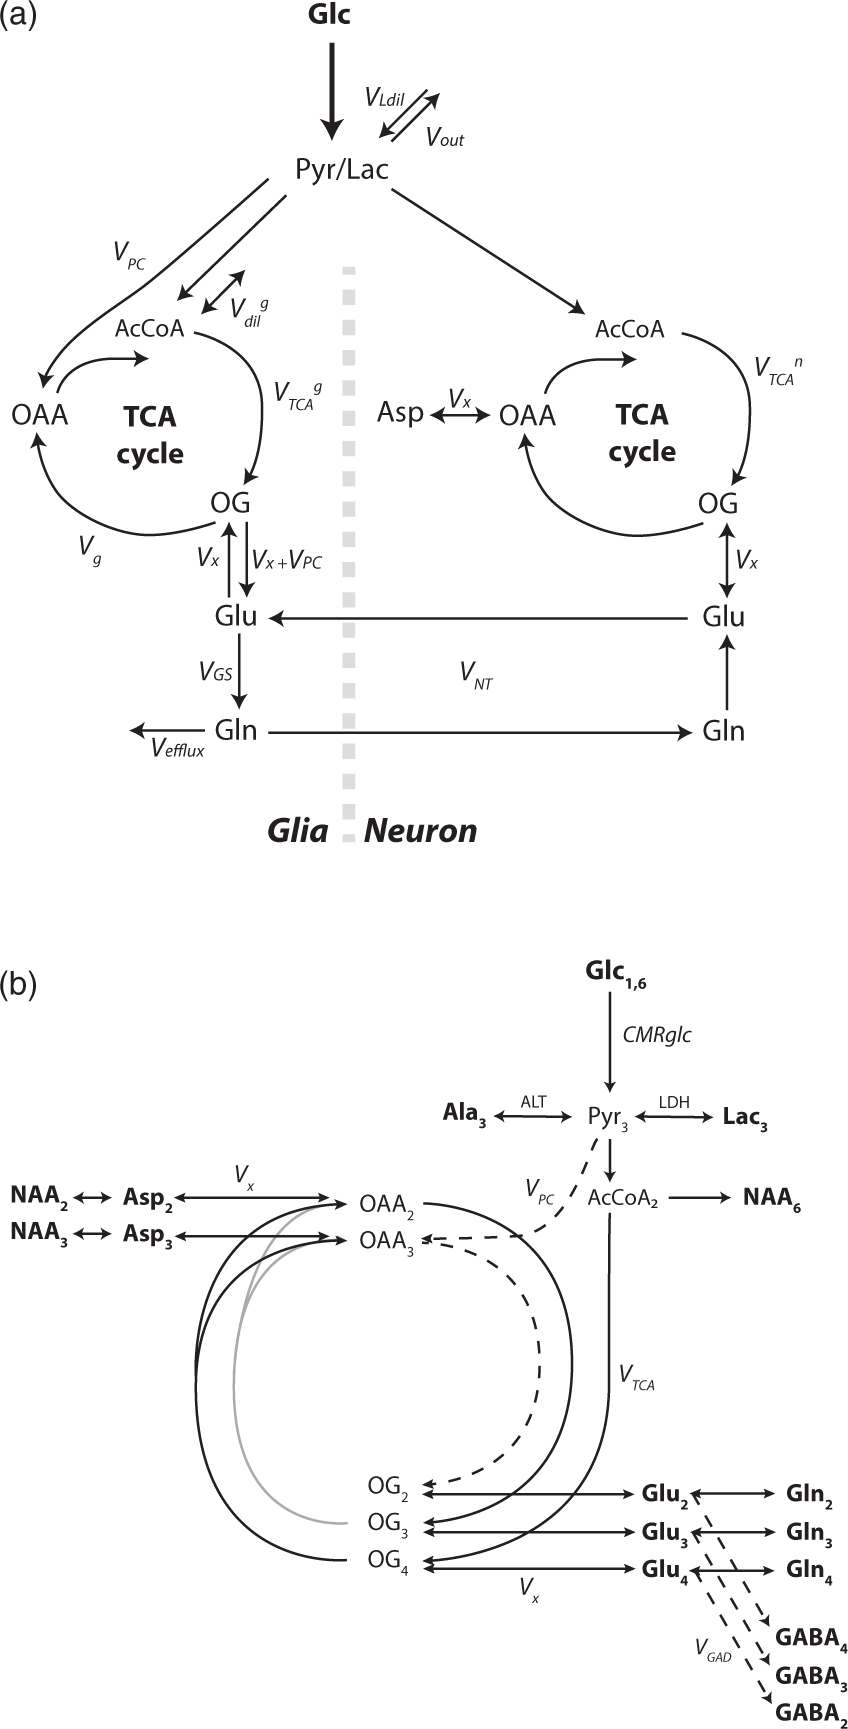
The two-compartment scheme considers glucose as the main brain energy substrate, where it is rapidly transported from the blood stream through the blood–brain barrier (BBB) into the cerebral tissue compartment. There, glycolysis metabolizes glucose into pyruvate (Pyr) which is, in turn, in rapid exchange with the lactate (Lac) pool through lactate dehydrogenase (LDH) thereby converting labeling in C1 and C6 positions of glucose into C3 of Pyr and lactate. 13C labeling is diluted at this node due to exchange with blood lactate (VLdil). Moreover, the model accounts for a small lactate efflux for contribution to non-oxidative pathways (Vout). Label from Pyr flows into neuronal and glial TCA cycles: PC activity is essentially localized in the glial compartment
20
contributing to the replenishment of TCA cycle intermediates, while influx of glial-specific substrates is considered through a dilution flux at the level of Acetyl-CoA (AcCoA) in the glial compartment
6
(Vdilg). Label at the level of AcCoA flows through the TCA cycle to 2OG that is in exchange across the mitochondrial membrane with Glu in both compartments. In the further part of the TCA cycle, 13C can flow alternatively from OG to oxaloacetate (OAA) for further cycling. The glial TCA cycle flux VTCA
The set of differential equations that characterize the 13C labelling dynamics in the presented two-compartment model was derived from the reaction pathways in the neuronal and the glial compartments as described above at metabolic steady-state (see Supplementary Information). The input function was generated as a step function with 70% glucose fractional enrichment (FE).
13C time courses obtained from spectral quantification of individual animals were first averaged over all the subjects. The values of the metabolic fluxes characterizing the two-compartment model (Vtcan, Vg, Vx, VPC, VNT, Vdilg, and Vout) were determined in a two-step process. First, the set of differential equations was at first iteratively solved with a Runge–Kutta method and solutions were fitted to the measured 13C FE turnover curves by adjusting the metabolic flux values (regression parameters) using a Levenberg–Marquardt algorithm for non-linear regression. FE curves were weighted in the regression cost function by the inverse of their variance, based on their respective noise level, to avoid bias in the parameters regression. In the second step, the precision of the estimated fluxes was determined by Monte Carlo (MC) simulation of the 13C FE time courses (N = 300). 22 Briefly, after the estimation of the metabolic fluxes by the weighted regression method, the fluxes were employed to generate a collection of noise-free 13C FE turnover curves, also used to evaluate the noise level in each turnover curve by subtraction: N sets of artificial 13C turnover curves were generated by adding N realizations of Gaussian noise with corresponding noise level to the noise-free model curves. A probability distribution for each metabolic flux is then obtained by fitting the N sets of artificial turnover curves. The standard deviation (SD) of each distribution determines the uncertainty on the estimated fluxes.
Metabolic modeling of 18FDG kinetics in PET experiments
The time activity curves of 18FDG acquired from the blood and the brain over a 50 min duration were processed using Patlak graphical analysis,
23
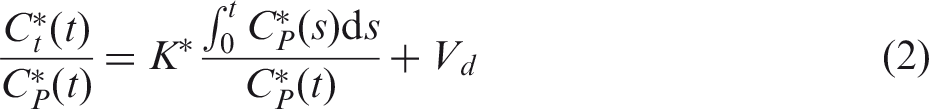
allowing an estimation of CMRglc from the slope of the resulting linear segment for each animal. The model predicts that for a time t > t*, a linear relationship will be established between

Biological systems can be studied with a Patlak analysis under the essential condition of irreversible trapping of the tracer under study, meaning that once 18FDG is metabolized in the cell (i.e. it undergoes phosphorylation), de-phosphorylation is not possible (k*4 = 0). This assumption can be considered valid for a scanning duration shorter than 27 min in the mouse brain.25–27 On the other hand, the time point t* defines the time delay that is necessary to reach equilibrium in FDG transport that will hence become unidirectional. In the IF, t* is the time point characterized by a nearly zero-slope in the curve after the bolus peak. Passed that time, FDG radioactivity concentration in blood will continue to decrease due to a combined effect of FDG uptake by major organs and muscles, as well as kidneys and bladder (frequently referred to as product loss). Specific t* of 5 min was chosen to allow sufficient time for reaching equilibrium in the exchange between plasma and tissue compartment.
The complete equation for the Patlak regression line is
Results
In vivo 13C MR spectra were obtained dynamically from mouse brain in six animals for up to 5 h during infusion of [1,6-13C2]glucose, in a volume of interest of 112 µL (Figure 2(c)). 13C MRS spectra acquired during the first 2.5 h with a temporal resolution of 10.6 min showed excellent sensitivity and spectral resolution in the selected VOI, reaching an SNR of eight after only 160 min (Figure 2(b)). GlcC6, LacC3 and GluC4 peaks rose in magnitude from the first 5 min, reflecting a prompt increase of blood glucose 13C level. Other amino acid resonances were increasingly visible during the first hour (Figure 2(a)). Spectral resolution was such that Glu and Gln peaks were well separated in all carbon positions C4, C3, and C2.
Steady-state spectra acquired during 92 min after 3.5 h of [1,6-13C2]glucose infusion, showed outstanding SNR (>20) and spectral resolution (FWHM = 15 Hz) allowing detection of 17 distinct resonances (Figure 3(a)) that account for a wide range of brain metabolites involved in glucose glycolytic catabolism and oxidation, synthesis of aminoacids and neurotransmitters. GlcC6 was the first peak to appear followed by LacC3 (Figure 2(a)), labeled from PyrC3 as AlaC3 (Figure 1(b)). Although cerebral alanine (Ala) has a relatively small pool size compared to Lac, AlaC3 became visible during the first hour (Figure 2(a)) and appeared clearly in steady-state spectra (Figure 3(a)). GABA is the primary neurotransmitter involved in inhibitory signaling and is directly synthetized by GABAergic neurons from Glu. Therefore, label in positions C4, C3, and C2 of Glu is transferred to GABAC2, C3, and C4, respectively, resulting in the appearance of fairly prominent peaks given its relatively large pool size in the striatum (3.1 ± 0.2 µmol/g, mean ± SD, as measured from the pre-infusion 1H MRS scan). Asp is labeled from OAA through the Vx exchange flux (Figure 1(b)) in its four carbon positions. However, only the C2 and C3 positions, namely at 53.2 and 37.4 ppm, fall within the detectable chemical shift range. Finally, Asp acts as a precursor for NAA labeling in C2 and C3, while the C2 carbon of AcCoA is the label precursor for NAAC6. NAA peaks in these three positions were clearly detected in steady-state spectra (Figure 3(a)). High spectral resolution allowed distinct detection of multiplets at the position C3 and C4 of Glu and Gln (Figure 3(b)). This feature allowed the calculation of the FE of GluC3 at steady-state and therefore the rescaling of 13C concentrations in the spectra (see Supplementary Information).
(a) 13C MRS in vivo spectrum representative of typical data acquired at steady state (3.5 h after the bolus; SNR = 24) for 92 min in the selected VOI (Figure 2(c)). (b) Multiplet resolution reached at the positions C4 and C3 of Glu and Gln. Doublet and singlet at the position C2 of GABA are also visible at 35.2 ppm.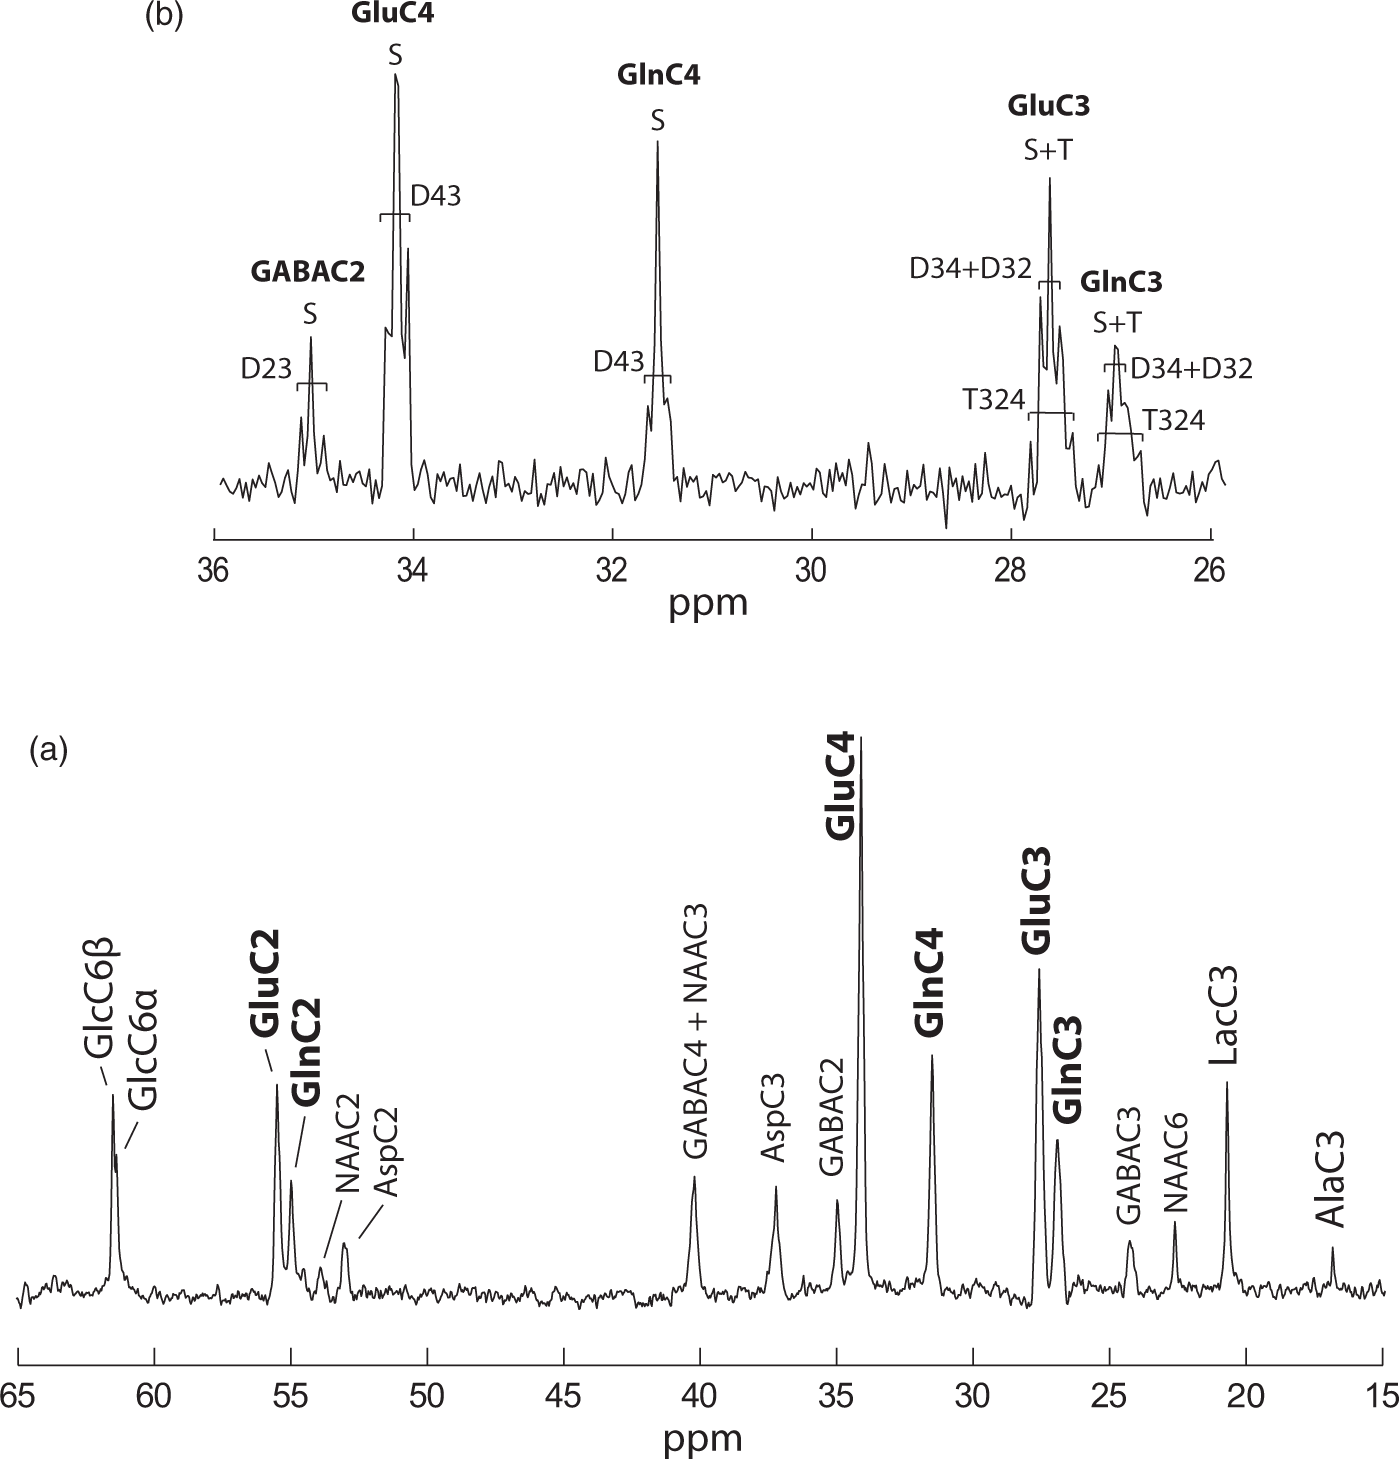
The fairly tight SD of the FE curves (Figure 4) demonstrated high reproducibility between animals. Maximal FE in GluC4 and GlnC4 reached 50% and 37%, respectively, at steady-state, while positions C3 were at 40% and 32%, respectively, indicating that the latter were likely diluted by PC activity. The lower FE of carbons C4 compared to glucose (70%) is the direct consequence of the dilution flux at the level of the lactate pool (Vout) which will equally influence Glu and Gln, while incorporation of glial-specific substrates (Vdilg) results mostly in the dilution of Gln curves. Moreover, PC introduces additional labeling in the positions C2 of Glu and Gln: this was observable from a higher FE of 44% and 41% at steady-state, respectively, compared to the C3 carbons. Experimental curves of Glu C4, C3, and C2, Gln C4, C3, and C2 and AspC3 were fitted by the two-compartmental model for brain metabolism (Figure 1(a)). The following metabolic fluxes were determined (Table 1): neuronal TCA cycle (VTCAn = 0.56 ± 0.03 µmol/g/min), glial TCA cycle (Vg = 0.16 ± 0.03 µmol/g/min), PC activity (VPC = 0.041 ± 0.003 µmol/g/min), transmitochondrial flux (Vx = 0.18 ± 0.02 µmol/g/min), apparent neurotransmission (VNT = 0.084 ± 0.008 µmol/g/min), dilution in the Lac pool (Vout = 0.20 ± 0.02 µmol/g/min) due to non-oxidative utilization of glucose or incorporation of other unlabeled substrates and dilution in the glial pool (Vdilg = 0.23 ± 0.05 µmol/g/min) due to glial-specific substrates. CMRglc(ox) (0.38 ± 0.02 µmol/g/min) was determined as (VTCAn + VTCAg + VPC)/2.
Fractional enrichment curves of Glu and Gln at the position C4, C3, and C2 and Asp C3 as fitted to the neuro-glial compartmental model (Figure 1(a)). The black solid line represents the best fit as obtained by least square fitting. Dashed lines represent SD range determined from MC simulation for each experimental curve. Metabolic fluxes estimated in the mouse brain in vivo. Note: Metabolic fluxes (expressed in µmol/g/min) determined from metabolic modeling of experimental data, based on the scheme shown in Figure 1. Errors express SD derived from MC simulation with a set of N = 300 artificial set of curves for Glu, Gln, and Asp. CMRglc(ox) is calculated as (VTCAn + VTCAg + VPC)/2. VTCAn: rate of neuronal TCA cycle; Vg: rate of glial TCA cycle; VPC: pyruvate carboxylase rate; Vx: transmitochondrial flux rate; VNT: apparent rate of glutamatergic neurotransmission. (a) Example of Patlak graphical analysis on a single 18F-FDG PET experiment. Linear fit performed between 5 and 27 min is shown with a solid black line. A significant k*4 activity is visible in the last points from a concave inflection of the Patlak plot. (b) Reconstructed PET images from the middle brain showing the respective ROIs in four consecutive coronal slices (reconstructed voxel size 0.5 × 0.5 × 1.18 mm3). (c) Example of 18FDG kinetics after the bolus injection: red dots show the image-derived input function (IDIF) determined from the vena cava while black squares correspond to the tissue time activity curve (tTAC) measured in the brain VOI.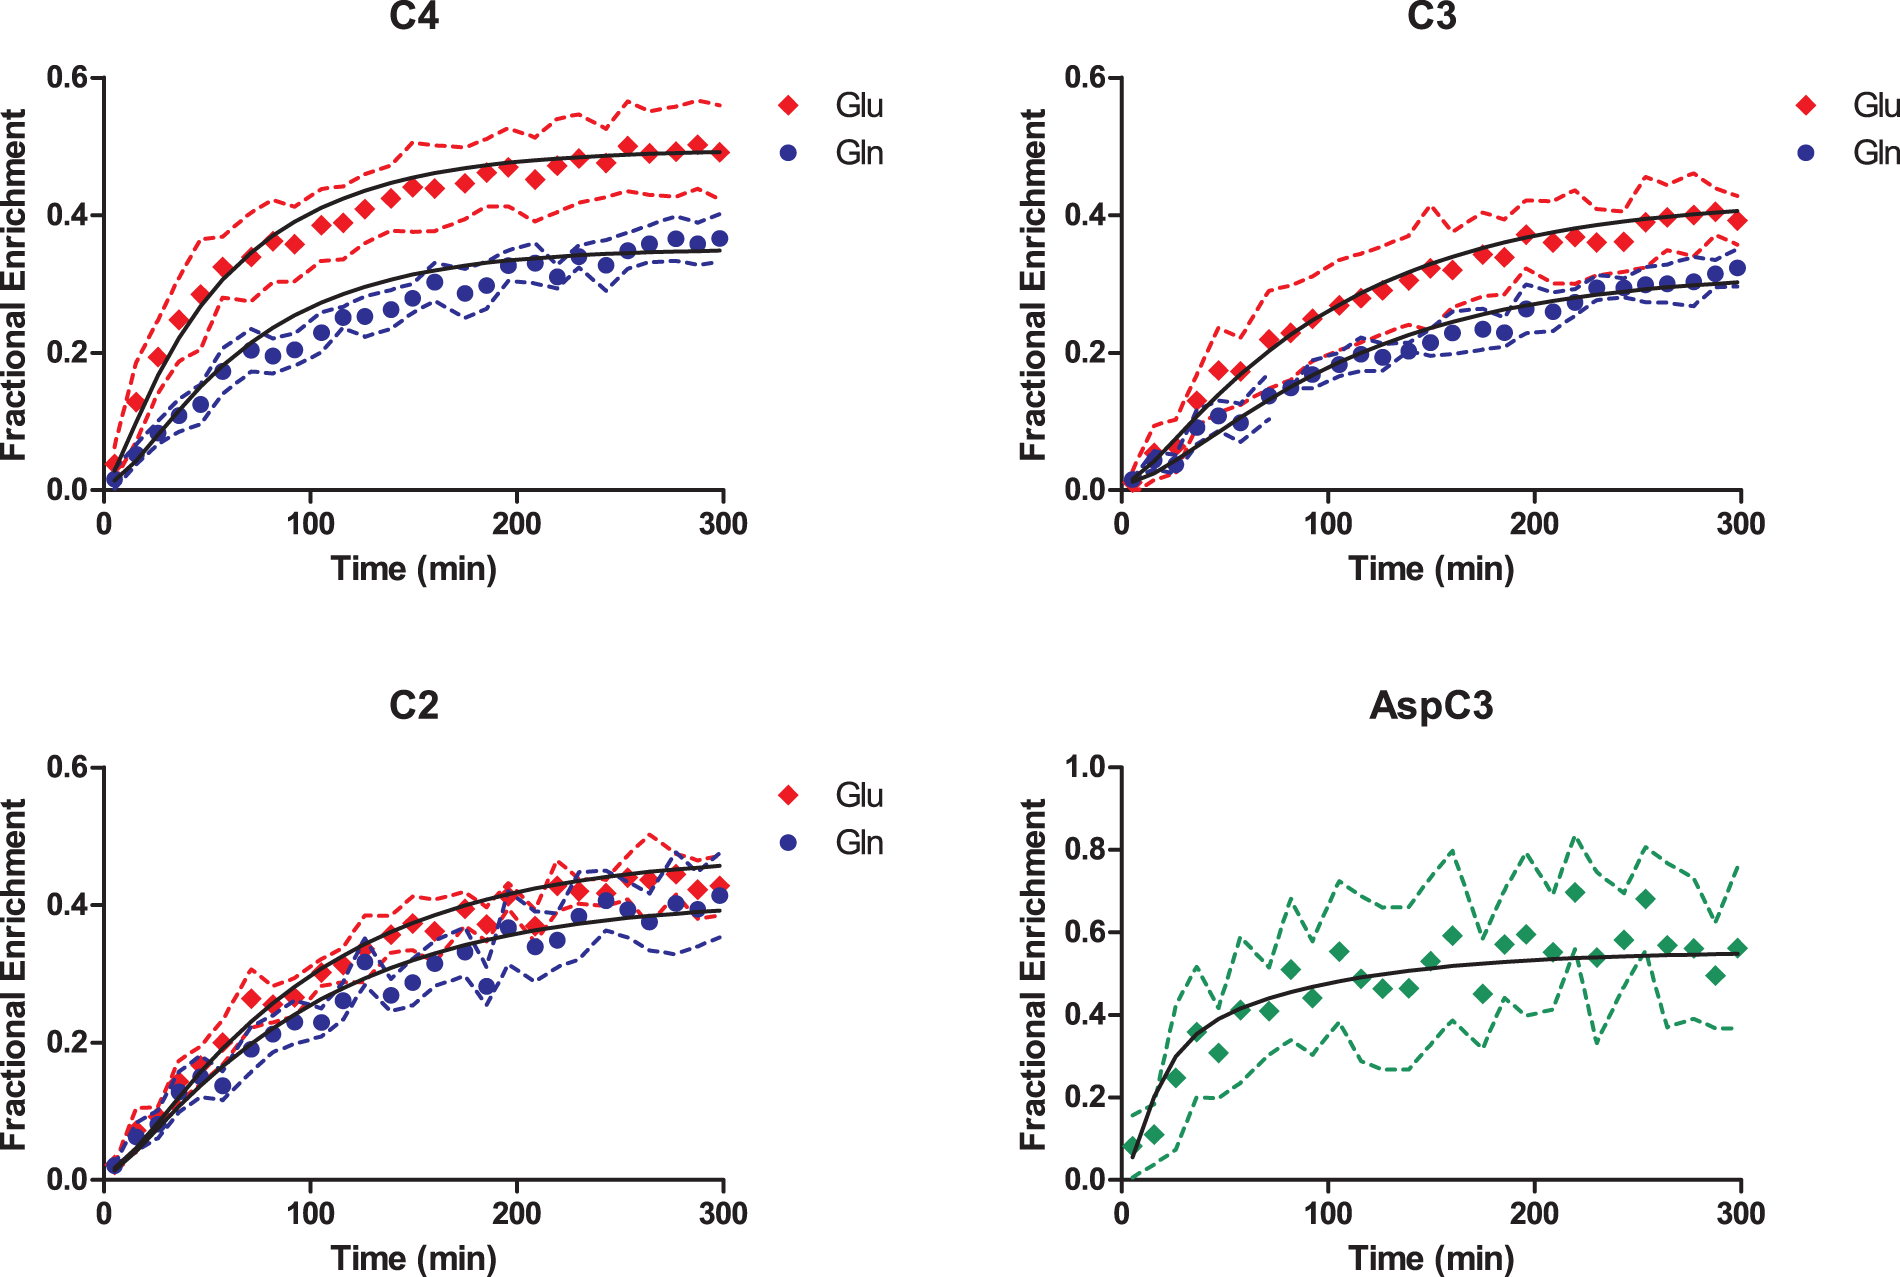

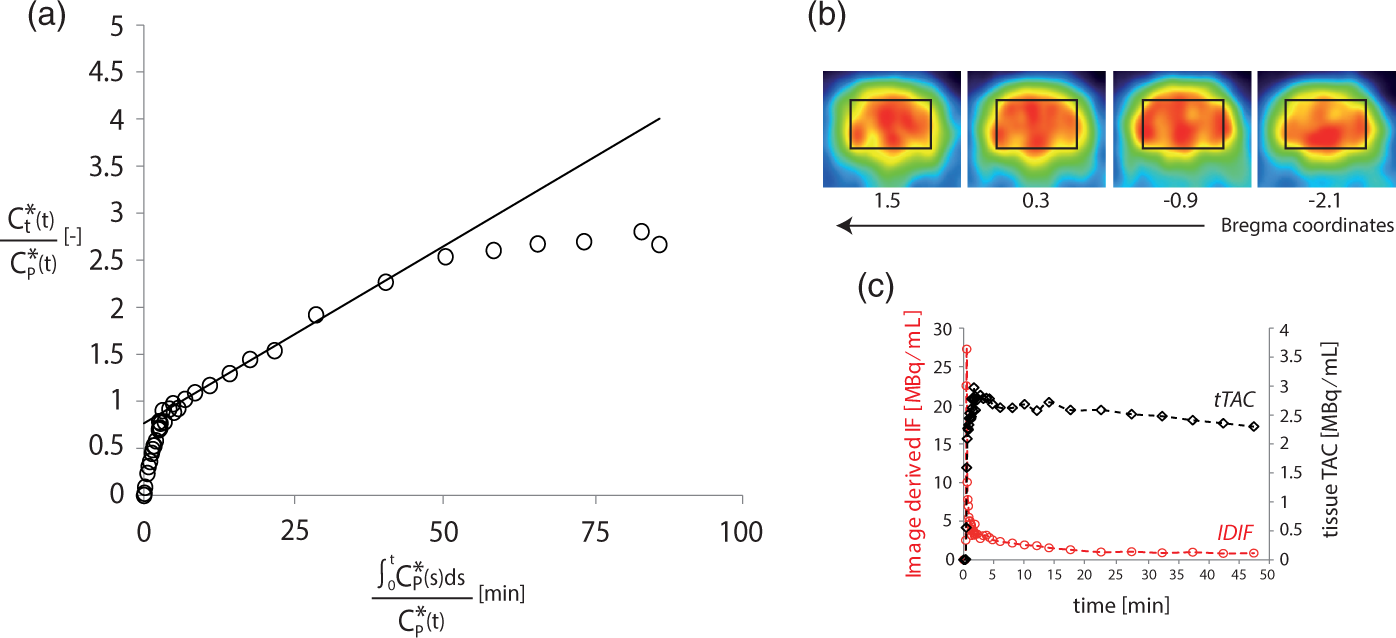
To determine the total CMRglc independently from 13C MRS experiments, we used 18FDG PET. Specifically, CMRglc rates in mice brain were determined by metabolic modeling of 18FDG uptake with Patlak graphical analysis, dynamically detected in a group of six mice. Data were quantified in a voxel corresponding to the one used for 13C MRS located in the mid brain (Figure 5(b)). Examination of linearity in Patlak plots between 5 and 27 min from the injection led to quantification of CMRglc for each animal. R2 values (0.92–0.99) were examined to evaluate the goodness of the fit in the selected time frame. Averaging of CMRglc over the entire group resulted in a global value of 0.4 ± 0.1 µmol/g/min (mean ± SD).
Discussion
In the present study, direct detection 13C MRS spectra were applied from the mouse brain to quantify compartmentalized metabolism between neurons and glial cells. Monte Carlo simulation showed that metabolic rates were precisely determined, including the fluxes specific to the glial compartment (maximal error of 19% on Vg).
The high spectral quality attained was achieved by integrating state of the art 13C direct detection 9 and shimming techniques 16 at ultra-high field (14.1 Tesla), combined with the use of an optimized homemade 1H-13C surface coil. The excellent sensitivity achieved in an exceptionally small volume (i.e. 112 µL, Figure 2(c)) allowed separate detection of three aliphatic carbons of Glu and Gln (C4, C3, and C2) up to 13C-13C multiplet resolution (Figure 3(b)) as well as the measurement of a wide range of brain metabolites linked to glucose metabolism in the brain, as Asp, GABA, NAA, Ala, and Lac. All peaks were separately resolved (Figure 3(a)) with the only exception of GABAC4 and NAAC3 that have very similar chemical shifts (respectively 40.2 and 40.3 ppm), thus appearing inevitably overlapped, even at this field strength.
Direct detection technique further allowed separate detection of Glu and Gln in the position C2 that are commonly overlapped in indirect 1H-[13C] MRS detection.7,10,11,28,29 VPC enables de novo synthesis of carbon skeletons entering the TCA cycle specifically in the glial compartment and introduces additional labeling at the level of Gln C2, while diluting the C3 position. Thus, the distinct detection of GlnC2 and GluC2 time courses is of great importance when aiming for robustness in metabolic modeling of neuro-glial interactions with minimal assumptions.6,12
The high temporal resolution of the measurements, i.e. 10.6 min (Figure 2), allowed for mathematical modeling of neuro-glial metabolism, based on labelling of Glu and Gln at the carbon positions C4, C3, and C2 and Asp at the position C3. The measurements were assessed to be highly reproducible between individual animals, as seen from the relatively narrow SD intervals of the group-averaged 13C turnover curves. This was ascribed to the implementation of the standardized infusion protocol and reproducible experimental conditions, despite the inaccessibility of plasma glucose level during infusion.
Metabolic fluxes
The present study represents to our knowledge the first attempt of mathematical modeling of cerebral metabolism in mice based on in vivo 13C-labeling experiments with direct 13C detection. Previous studies4–6,14,15 have applied similar techniques to the human and rat brain gaining important insights on cerebral metabolic compartmentation, whereas cerebral metabolism in mice has only been described by ex vivo measurements 30 or by 13C indirect detection 11 subsequently analysed by simplified one-compartment model of brain metabolism. While indirect detection gave access to real-time information on the pool size during infusion, 11 including the input function, 11 direct detection reduces the peak overlap and increases the number of dynamically detectable metabolites carbon positions. In the present model, 1H MRS spectra enabled the determination of metabolites pool size in vivo to derive FE values for each metabolite included in the metabolic modeling, by assuming constant pool size over the experiment.
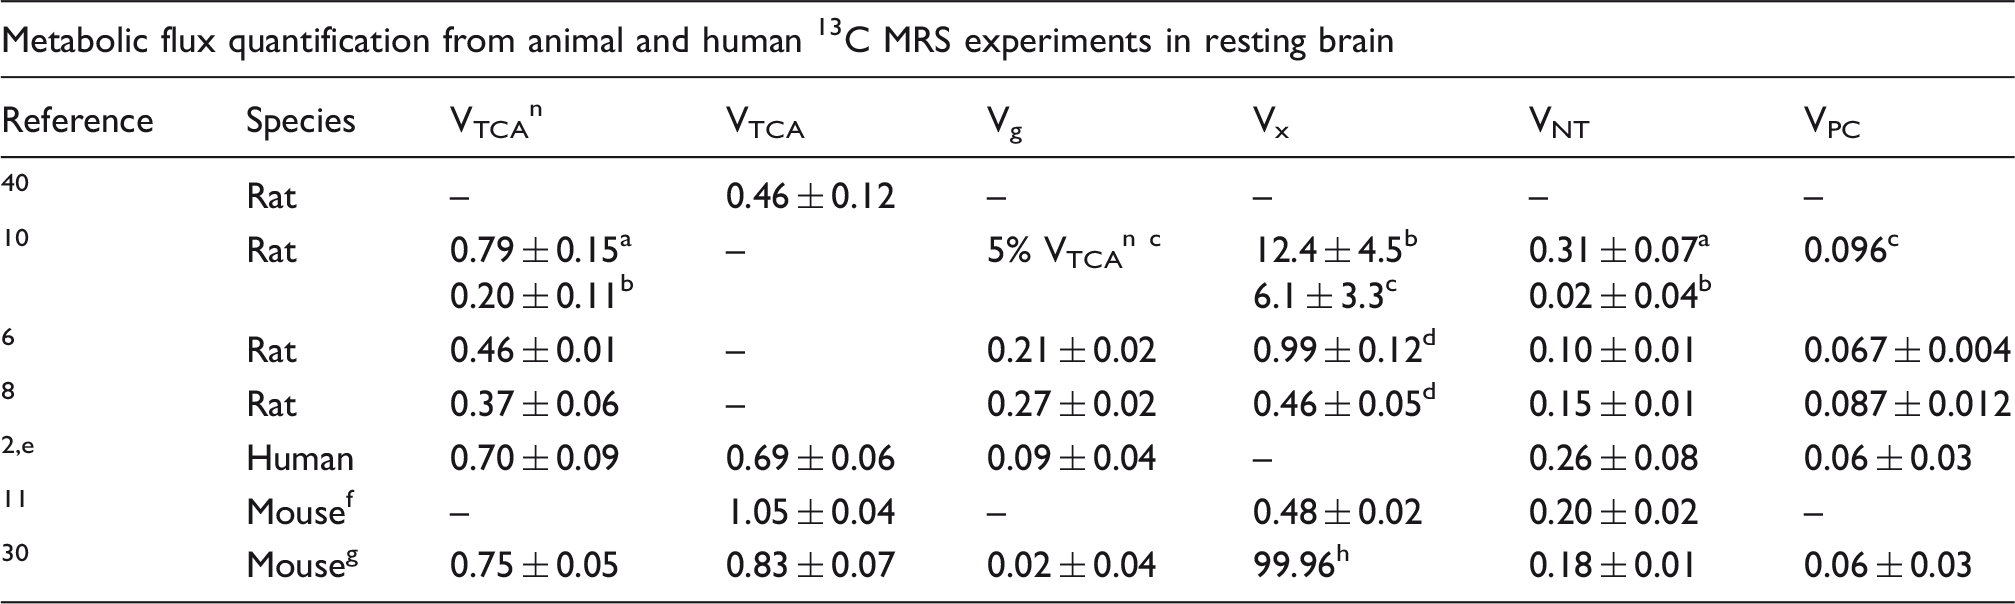
Review of the previously published values of metabolic fluxes (µmol/g/min ± SD).
Grey matter, glial TCA cycle fixed at 5%VTCAn, VPC fixed at 0.096 µmol/g/min.
White matter, glial TCA cycle fixed at 5%VTCAn, VPC fixed at 0.096 µmol/g/min.
Fixed values or modeling constraint.
Transmitochondrial flux between 2OG and Glu in neurons.
Mean and SD from published results in 13C MRS experiment in resting awake human subjects in midline occipital/parietal lobe.
Spectra acquired in the cortex and striatum, VNT was set to exchange rate between Glu and Gln (Vgln).
Analysis of brain extracts from the striatum; three-compartment model is assumed, distinguishing between GABAergic and glutamatergic neurotransmission (VNT refers to glutamatergic neurotransmission).
Iterated values in the modeling procedure.
Note: Fluxes are quantified from 13C in vivo experiments in humans, monkeys, rats, and mice. Since available published metabolic fluxes quantified in vivo in mice are limited, values from mice extracts were included. 30 Results are derived from the whole brain if not stated otherwise.
TCA: tricarboxylic acid; VTCAn: rate of neuronal TCA cycle; VTCA = VTCAn + Vg + VPC: average of TCA cycle rates among neurons and glia; Vg: rate of glial TCA cycle; VPC: pyruvate carboxylase rate; Vx: transmitochondrial flux rate; VNT: apparent rate of glutamatergic neurotransmission.
The transmitochondrial exchange flux Vx was comparable to VTCAn, similar to previous studies.3,11,6,15,31 This implies that the malate-Asp shuttle is a major mechanism of label transfer across the mitochondrial membrane, as discussed previously. 3
The metabolic fluxes determined in this study represent an average over the examined VOI and are thus expected to be mostly influenced by metabolic exchanges in the central part of the brain, mainly the striatum. VNT can vary considerably through different brain regions and is typically higher in regions dominated by excitatory synapses (i.e. cortex) characterized by higher rates of glucose oxidation. 30 Conversely, the striatum is known for the higher level of GABA (and therefore likely higher role of GABAergic neurotransmission) when compared to cortex, hippocampus and cerebellum30,32 and the lower rate of excitatory neurotransmission compared to other regions in the mouse brain. 30 Therefore, the rate VNT found in this study reflected this pattern and was consistent with previously published values in rats in vivo.8,6 Glial TCA cycle rate and PC rate were in agreement with previously published values in rats (Tables 1 and 2), with VPC being one order of magnitude smaller than Vg.
Beyond these observations, metabolic rates could be dependent on the specific strain used in the experiment and possibly from the use of anaesthetics.33,34 However, a deeper understanding of these aspects is far from being attained given the limited number of studies available on the topic.
In our study, the levels of brain Lac (4.3 ± 0.8 µmol/g), enabled the measurement of Lac enrichment turnover, as early as 5 min after the start of the infusion. 1H MRS studies of metabolite concentrations in the mouse brain indicated a higher cerebral Lac concentration in this species 32 compared to rats, 35 especially in the striatum, where levels as high as 5 µmol/g were reported in C57BL/6 mice. 32 Given this relatively low concentration in rats (usually below 2 µmol/g in the rat striatum 35 ), Lac peaks are often barely detectable in 13C MRS studies under physiological conditions upon infusion of labeled glucose,9,6 whereas a complete time course was registered in the mouse brain by 13C indirect detection. 11 Therefore, in such experiments, which give access to dynamic information of the Lac pool size, the 13C Lac signal could in principle be used as input function of the mathematical modeling, as previously demonstrated 11 . However, in 13C direct detection studies, it is generally not recommended to determine dynamically the Lac FE curve by assuming a constant pool size for Lac, since volatile anaesthetics36,37 and nearly hyperglycemic plasma concentrations of glucose could induce fluctuations of total Lac concentration over the course of the experiment and would similarly influence Ala. Increasing pool size of the measured metabolites does not represent an obstacle to the measurement of metabolic fluxes, as non-steady-state regime can be taken into account in the modeling when real-time information on metabolite pool size is accessible.8,11
CMRglc determined by 18FDG PET experiments
Total cerebral glucose consumption was evaluated by simplified 18FDG kinetic modeling: the linear regression method applied in Patlak plots for each animal enabled the determination of the CMRglc in the VOI matched to that of 13C MRS, under the fundamental assumption of irreversible FDG-6P kinetics. Patlak graphical analysis 23 is advantageous in evaluating the net glucose uptake by the brain given the simplicity of the linear regression method when separate information on the transport of FDG to the cellular compartment and its phosphorylation are not necessary. The temporal range examined was fixed between 5 and 27 min, similar to previously published procedures in mice.25,27 The first few minutes are in fact influenced by equilibration between plasma and tissue FDG, while the last time point included was set to be before 30 min in order to minimize the influence of k*4 (dephosphorylation of FDG-6P). FDG-6P reaches typically a plateau 20 min after FDG bolus injection, resulting in a non-negligible effect of dephosphorylation mostly between 30 min and the end of the experiments.25–27 The effect of a non-negligible dephosphatase activity was discernible from the decline of the Patlak curve in the four time points corresponding to 30 to 50 min (Figure 5(a)).
Linear relationships were established in the aforementioned time frames as justified from R2 values for each linear fit (0.92–0.99). Reported values and their variability for CMRglc in the brain were comparable to other FDG PET studies in mice under isoflurane.26,27,38,39
The value of CMRglc(ox) derived from the amino acids turnover using 13C MRS (0.38 ± 0.02 µmol/g/min) is comparable to CMRglc quantified from PET experiments. However, a slightly higher glucose metabolism measured by 18FDG PET is consistent, given that glucose can be in part metabolized by glycolysis to lactate and to a smaller extent to glycogen (18FDG PET measures CMRglc(total)).
For the present study, we conclude that cerebral brain metabolism can be assessed in vivo in mice with direct 13C MR spectroscopy at 14.1 Tesla. Given the high spectral quality obtained in the chosen volume of detection (112 µL), we expect that sufficient SNR could be obtained in the near future in volumes as small as 60 µL for the detection of C4, C3, and C2 resonances of Glu and Gln, giving access to the detection of regional glucose metabolism in astrocytes and neurons. The FE time courses available from those labeled metabolites allowed us for the first time to obtain a complete two-compartmental description of brain energy metabolism in mice.
Funding
The author(s) disclosed receipt of the following financial support for the research, authorship, and/or publication of this article: This work was supported by Centre d’Imagerie BioMédicale (CIBM) of the UNIL, UNIGE, HUG, CHUV, and EPFL, the Leenaards, Jeantet Foundations and Grant FP7-PEOPLE-2010-ITN-264780.
Declaration of conflicting interests
The author(s) declared no potential conflicts of interest with respect to the research, authorship, and/or publication of this article.
Authors’ contributions
Marta Lai: Conception of the experimental designs, acquisition of in vivo 13C MRS data, experiments, and preliminary studies. Contribution to post-processing, data analysis, and interpretation of experiments. Drafting of the manuscript and figures. Critical manuscript revising. Approval of the manuscript final version.
Bernard Lanz: Conception of the experimental designs, acquisition of in vivo 13C MRS data, experiments, and preliminary studies. Design and realization of the home-built 13C coil. Adaptation/extension of mathematical modeling fitting code. Contribution to post-processing, data analysis, and interpretation of experiments. Critical manuscript revision. Approval of the manuscript final version.
Carole Poitry-Yamate: Conception of the experimental 18FDG PET protocol design, performed 18FDG PET scans, post-processing, data analysis, and data interpretation. Critical manuscript revision. Approval of the manuscript final version.
Jackeline F. Romero: Animal technical support during acquisition of in vivo 13C MRS data and preliminary studies. Animal monitoring before and during experiments. Manuscript revising. Approval of the manuscript final version.
Corina M Berset: Animal technical support involving tail vein catheterization of mice planned for non-invasive 18FDG PET. Animal monitoring before and during experiments. Manuscript revising. Approval of the manuscript final version.
Cristina Cudalbu: Conception of the experimental designs and contribution to preliminary studies. Contribution to data analysis and interpretation. Critical manuscript revising. Approval of the manuscript final version.
Rolf Gruetter: Conception of the experimental designs. Conception of metabolic modeling scheme. Data analysis and interpretation. Critical manuscript revising. Approval of the manuscript final version.
Footnotes
References
Supplementary Material
Please find the following supplemental material available below.
For Open Access articles published under a Creative Commons License, all supplemental material carries the same license as the article it is associated with.
For non-Open Access articles published, all supplemental material carries a non-exclusive license, and permission requests for re-use of supplemental material or any part of supplemental material shall be sent directly to the copyright owner as specified in the copyright notice associated with the article.