
Abstract
Bone responds with increased bone formation to mechanical loading, and the time course of bone formation after initiating mechanical loading is well characterized. However, the regulatory activities governing the loading-dependent changes in gene expression are not well understood. The goal of this study was to identify the time-dependent regulatory mechanisms that governed mechanical loading-induced gene expression in bone using a predictive bioinformatics algorithm. A standard model for bone loading in rodents was employed in which the right forelimb was loaded axially for three minutes per day, while the left forearm served as a non-loaded, contralateral control. Animals were subjected to loading sessions every day, with 24 hours between sessions. Ulnas were sampled at 11 time points, from 4 hours to 32 days after beginning loading. Using a predictive bioinformatics algorithm, we created a linear model of gene expression and identified 44 transcription factor binding motifs and 29 microRNA binding sites that were predicted to regulate gene expression across the time course. Known and novel transcription factor binding motifs were identified throughout the time course, as were several novel microRNA binding sites. These time-dependent regulatory mechanisms may be important in controlling the loading-induced bone formation process.
Background
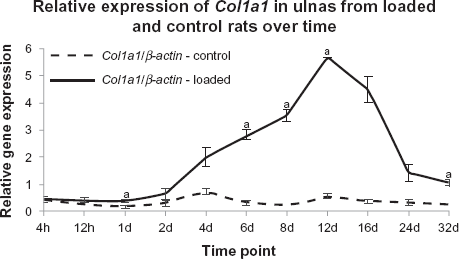
Mechanical loading affects signaling pathways and gene expression in bone,1,2 and bone responds to loading by increasing bone formation. The time course of bone formation after initiating mechanical loading is well characterized. New osteoblasts appear on the bone surface 24 to 48 hours after initiating mechanical loading 3 and bone formation is observed within 96 hours of loading. 4 Bone formation increases between 5 and 12 days after starting loading, 4 but after 6 weeks of loading bone formation returns to baseline levels. 5 These data indicate that applied mechanical loading to bone results in osteoblast recruitment followed by matrix production, which lasts for around five weeks before declining to baseline levels. 6
We hypothesize that the regulatory mechanisms that govern loading-induced gene expression are time dependent. Although there are many regulatory mechanisms that affect the relationship between gene expression and protein expression, we are interested in studying transcription and microRNA regulation as a first step toward better understanding regulation of gene expression in a mechanical loading model. An important consequence of mechanotransduction in bone is transcription factor regulation, as transcription factors bind to motifs in the promoter regions of genes and directly affect gene expression. 7 MicroRNAs are non-coding, single stranded molecules that are approximately 22 base pairs in length. MicroRNAs act at the post-transcriptional level by binding to the 3′ untranslated region (UTR) of mRNA, inducing degradation, and downregulating gene expression. MicroRNA regulation is important in development and in many normal biological processes, but has also been implicated in cancer, cardiovascular diseases, immune function, and fetal alcohol syndrome.8–11 MicroRNA regulation has also been implicated in osteoblast differentiation, 12 but it has not yet been studied in the context of mechanical loading in bone.
Techniques such as promoter motif analysis can be used to relate gene expression with biological function and begin to unravel the complexity of biological systems at the level of gene regulation. We studied regulatory mechanisms using MotifModeler, which is a model-based algorithm that predicts which transcriptional regulatory mechanisms govern gene expression in response to a biological event.7,11,13 MotifModeler creates a linear model of gene expression based on fold change differences between control and experimental conditions, and regulatory factors (ie, transcription factor binding motifs [TFBMs] and microRNA binding sites [MBSs]) are scored based on how well they fit the model. MotifModeler has been used to study regulatory mechanisms in several biological conditions and disease states, including fetal alcohol syndrome 11 and androgen dependent and independent prostate cancer. 13
The goal of this study was to identify the time-dependent regulatory mechanisms that governed mechanical loading-induced gene expression in bone. We determined the time sequence of regulatory activities and predicted several TFBMs and MBSs that were important in controling the loading-induced bone formation process.
Methods
Animals
Adult female Lewis rats were purchased from Charles River Laboratories, Inc. The animals were fed standard rat chow and water
Mechanical loading
A standard model for bone loading was employed in which the right forelimb was loaded axially for three minutes per day, while the left forearm served as a non-loaded, contralateral control.14–16 Prior to loading, animals were anesthetized with 3.0% isoflurane administered at a flow rate of 1.5 L/min. Compressive load was applied as an oscillating Haversine waveform for 360 cycles at a frequency of 2 Hz using a Bose ElectroForce 3200 Series electromechanical actuator (EnduraTEC). The peak load achieved during loading was 13 N, which has previously been shown to be anabolic. 14 Rats were subjected to loading sessions every day, with 24 hours between sessions. The study groups listed above are referenced to the number of days (or hours) after the first bout of bone loading was applied. For example, animals in the 4h, 12h, and 1d groups were loaded once and sacrificed 4 hours, 12 hours, or 24 hours later, respectively. Animals in the 2d group were loaded on two consecutive days and were sacrificed 24 hours after the last loading session. Animals in all other groups were loaded for the indicated number of days and sacrificed 24 hours after the last loading session. At the appropriate time point, animals were anesthetized with isoflurane and euthanized by cervical dislocation.
RNA isolation
The shafts of the right and left ulnas were dissected, freed of all soft tissue, snap frozen in liquid nitrogen, and stored at –80 °C until RNA isolation. RNA was extracted using Trizol (Invitrogen) and RNeasy Mini Kits (Qiagen, Inc.). Frozen ulnas were placed into a mortar containing liquid nitrogen and crushed with a pestle. The crushed bones were immediately transferred into a 2 ml tube containing 1 ml of Trizol, homogenized for 20 seconds using a Tissue Tearor homogenizer (Cole-Parmer), incubated on the bench top for 30 minutes, and centrifuged. The supernatant was removed and used to isolate RNA. RNA was isolated using RNeasy Mini Kits according to the manufacturer's instructions, and RNA was treated with a DNA-free kit (Ambion) to remove any residual DNA. RNA quality and quantity were determined using a spectrophotometer (NanoDrop). A limitation of our model is that we used the whole ulna to extract RNA. Multiple cell types are included, including osteoblasts, osteocytes, and bone lining cells.
Quantitative real time PCR
Three matched (control and loaded samples from the same animal) ulna RNA samples from each time group were used for quantitative real time PCR (qPCR) experiments. RNA was reverse transcribed using the Superscript III kit with oligo(dT) primers (Invitrogen). cDNA was diluted to a concentration of 2.5 ng/μl and used in qPCR reactions. A portion of the rat collagen type 1 alpha 1
Exon arrays and analysis
Quality control for RNA included a spectrum from A220 to A350 run on a NanoDrop spectrophotometer, a native 1% agarose gel stained with ethidium bromide to detect contaminating DNA, and electrophoresis using an Agilent Bioanalyzer to examine RNA. The quality of RNA samples was assessed using 260:280 ratio, and a high quality sample was defined as having a minimum ratio of 2.00. Only four RNA samples had 260:280 ratios less than 2.00, and these samples were chosen to optimize the quantity of total RNA as well as the quality. The range of 260:280 ratios of all samples used was 1.96–2.31.
Affymetrix GeneChip® Rat Exon 1.0 ST Arrays were used to analyze gene expression in loaded and control ulnas. These particular exon arrays had over 4 million individual features and over 1 million probe sets, which represent the transcribed rat genome. The Rat Exon 1.0 ST exon arrays use approximately four probe sets to represent a single exon, and approximately 40 probe sets to represent a gene.
Five matched (control and loaded samples from the same animal) ulna RNA samples from each time group were used for exon array analysis. One exception to this was the 12d group, where only four matched samples were used. The highest quality matched samples, in terms of 260:280 ratio, with the largest quantity of total RNA were chosen for analysis using exon arrays. A total of 108 exon arrays were used, as RNA from the control and loaded ulnas from 54 individual animals were analyzed on separate arrays.
The exon array hybridizations were carried out using the facilities of the Center for Medical Genomics (CMG) at Indiana University School of Medicine. Samples were labeled and hybridized using the Affymetrix WT protocol (GeneChip® Whole Transcript [WT] Sense Target Labeling Assay Manual Version 4, Affymetrix). All processing was done in balanced batches. Labeling was done in batches of 22 samples which included the RNA from a matched sample from each time group. The exon arrays were scanned using the GeneChip® Scanner 3000 using Affymetrix GeneChip® Operating System (GCOS). Data were exported for analysis in the Partek® Discovery Suite™ (Partek Inc.). 17
Raw exon array data were obtained from the CMG and imported into Partek for further analysis. Core probe sets included RefSeq transcripts and full length mRNAs, and were chosen for analysis because they were annotated with the most confidence. Probe sets were normalized using the following settings recommended by Partek for exon array analysis: robust multiarray average (RMA) background correction, quantile normalization, log probes using base 2, and median polish probe set summarization.18–20 After normalization and summarization, the probe sets represented over 8,000 genes. A list of differentially expressed genes and fold change values was created for each time point for input into MotifModeler. A differentially expressed gene was defined as having a
Raw data and analyzed data were MIAME compliant, 21 were deposited in the National Center for Biotechnology Information (NCBI) Gene Expression Omnibus database, 22 and are accessible through GEO Series accession number GSE22286 (http://www.ncbi.nlm.nih.gov/geo/query/acc.cgi?acc=GSE22286).
MotifModeler
Analysis of regulatory regions for differentially expressed genes was conducted using MotifModeler. MotifModeler is a model-based algorithm that predicts which regulatory mechanisms govern gene expression in response to a biological event.7,11,13 MotifModeler repeatedly tests random subsets of all possible regulatory elements (ie, TFBMs and MBSs) of a fixed size in the regulatory regions of genes and identifies those that best fit a linear model of gene expression based on fold change. TFBMs and MBSs are included in the same linear model, and those with scores beyond three standard deviations of the mean were considered statistically significant.
MotifModeler determines if predicted regulatory elements are stimulatory or inhibitory and identifies the predicted regulatory elements by matching them with known sequence data. MotifModeler input included lists of differentially expressed genes at each time point, and MotifModeler output included predicted positive TFBMs that promoted transcription, negative TFBMs that inhibited transcription, transcription factor(s) that bound to each motif, and the target gene in which these motifs were present. In addition, MotifModeler identified MBSs that were predicted to regulate gene expression and the target genes in which they were present. Data on rat microRNAs is limited, so the miR2Disease database was used to infer function about the human microRNAs corresponding to the rat microRNAs predicted by MotifModeler. 23 miR2Disease is a manually curated database that aims to provide a comprehensive resource of microRNA deregulation in human disease.
The primary assumption of MotifModeler is that the combinatorial action of many regulatory factors regulates gene expression and determines whether or not a gene is transcribed.7,24 A limitation of MotifModeler is that it evaluates small portions of the gene in the 5′ regulatory region and 3′ UTR. Enhancers, silencers, and other regulatory elements outside of these regions may be important in transcriptional regulation as well but cannot be identified. In addition, the positions of the regulatory elements might not be known in poorly annotated genes so MotifModeler may analyze a region of the gene that does not contain regulatory regions.
Immunohistochemistry
Immunohistochemistry was used to qualitatively validate a MotifModeler prediction at the protein level. Five matched whole bone ulna samples (loaded and control ulna from the same animal) were used at 1d, and four matched whole bone ulna samples were used at 4d. We chose these time points to allow sufficient time for protein synthesis to occur after mechanical loading. The shafts of the right and left forearms with intact bones (ulna and radius), and muscle were dissected and fixed in 10% neutral buffered formalin (NBF) for 48 hours. The fixed forearms were decalcified in a 70:30 solution of 10% ethylenediamine tetraacetic acid (EDTA) and 4% phosphate buffered formalin (PBF) for four weeks. After decalcification, forearms were embedded in paraffin and sectioned at the ulnar midshaft at 5μm. The sections were dried, deparaffinized, reacted for endogenous peroxidase activity, blocked, and incubated in primary antibodies to detect STAT3 (product number 9132, Cell Signaling Technology). STAT transcription factors are known to be important in mechanotransduction. Several STAT motifs were predicted, and we chose to qualitatively validate expression of STAT3 as it is known to play an important role in bone formation. 25 Secondary antibody labeling and detection were accomplished using the Vectastain Elite ABC kit (Vector Labs, Inc.) with diaminobenzidine as the chromogen. The immunolabeled sections were left without counterstain and coverslipped. Matched samples were included on the same slide. This experimental design limits the influence of staining/processing artifacts. Within a matched sample, the non-loaded ulna served as a control for comparison to the loaded ulna.
Results
Col1a1 expression
qPCR was used to measure
Transcription mechanisms—TFBMs
MotifModeler was used to predict which TFBMs and MBSs might play important roles in regulating loading-induced gene expression. TFBMs are present in the promoter region of genes, and act to induce (ie, positive TFBMs) or inhibit (ie, negative TFBMs) transcription when their associated transcription factors bind. Although motifs can be positive or negative to act as inducers or inhibitors of transcription, respectively, Figure 2 shows that the majority of the 44 predicted motifs were positive. Transcription factors may bind to multiple TFBMs, and MotifModeler predicted multiple TFBMs for certain transcription factors. For example, the STAT5B transcription factor can bind to the STAT5B and STATx motifs in the oncostatin M receptor (
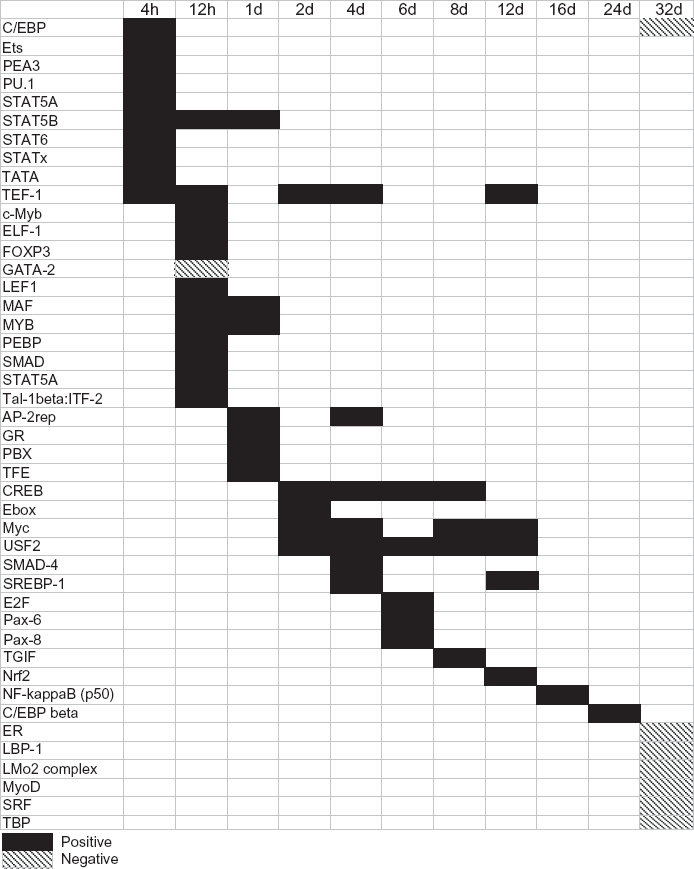
The pattern of predicted TFBMs changed over time. Different TFBMs were associated with different time points. More TFBMs were predicted at early time points, and fewer TFBMs were predicted at later time points. Positive TFBMs promoted transcription and are represented by solid black boxes, while negative TFBMs inhibited transcription and are represented by boxes with diagonal black lines.
Predicted motifs and the associated transcription factors that bind and potentially influence expression of target genes at various time points.
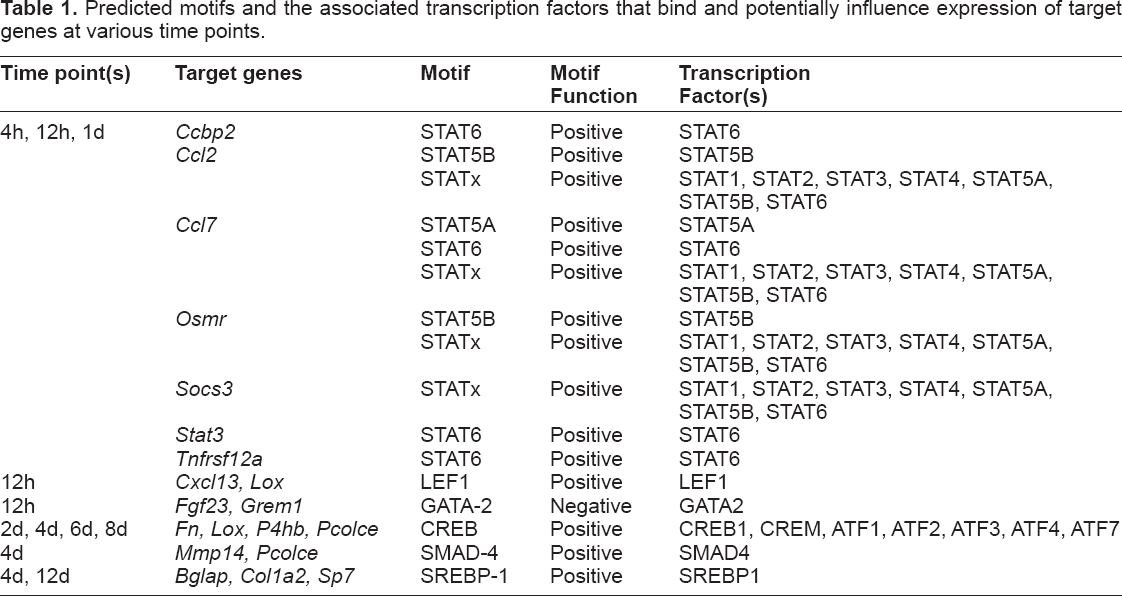
The pattern of predicted motifs changed over time. Several STAT motifs were predicted to regulate chemokine target genes at 4h, 12h, and 1d, including chemokine binding protein 2 (
The LEF1 motif was predicted to be positive at 12h, and is of interest because one of the transcription factors that binds to it is lymphoid enhancer binding factor 1 (LEF1). LEF1 is part of the Wnt/β-catenin signaling pathway, which is known to be important in mechanotransduction and enhances the sensitivity of osteoblasts and osteocytes to loading.
26
The LEF1 motif was present in chemokine (C-X-C motif) ligand 13
The CREB-related transcription factors are important for bone formation, specifically ATF4, which is required for collagen synthesis by mature osteoblasts.27,28 The CREB motif was predicted to be positive at 2d, 4d, 6d, and 8d. The transcription factors that bind to the CREB motif include cAMP responsive element binding protein 1 (CREB1), cAMP responsive element modulator (CREM), activating transcription factor 1 (ATF1), ATF2, ATF3, ATF4, and ATF7. The CREB motif was present in the promoter of an important matrix gene, fibronectin 1 (
SMAD-related motifs are of interest because SMADs interact with the transforming growth factor beta (TGF-β) signaling pathway, which is important in osteoblast differentiation and bone formation.
29
The SMAD-4 motif was positive at 4d, and the SMAD4 transcription factor can bind the SMAD-4 motif. The SMAD-4 motif was present in two genes involved in matrix turnover, matrix metallopeptidase 14 (
The SREBP-1 motif is bound by the sterol regulatory element binding transcription factor 1 (SREBP1). The SREBP-1 motif was predicted to regulate expression of genes related to matrix formation and osteoblast differentiation at 4d and 12d, including bone gamma-carboxyglutamate (gla) protein (
Eight predicted motifs were negative, and seven of these were predicted at 32d, when the system was less responsive to loading and had shifted from bone forming to baseline bone maintenance. No negative motifs were predicted during matrix formation, which occurred primarily between 4 and 12 days after starting loading (Fig. 2). The GATA-2 motif was predicted to be negative at 12h, and the GATA2 transcription factor binds this motif to inhibit transcription. This motif was present in fibroblast growth factor 23 (
Transcription mechanisms—MicroRNA
MicroRNAs were studied because they act at the post-transcriptional level and induce degradation by binding to the 3′ UTR of target mRNA. MotifModeler predicted that 29 MBSs regulated gene expression across the time course, and 27 of these were positive regulators of gene expression (ie, microRNA binding to these MBSs within target genes was inhibited by loading, and target gene expression increased) (Fig. 3). No negative microRNAs were predicted during matrix formation, and no MBSs were predicted to regulate gene expression at 32d.
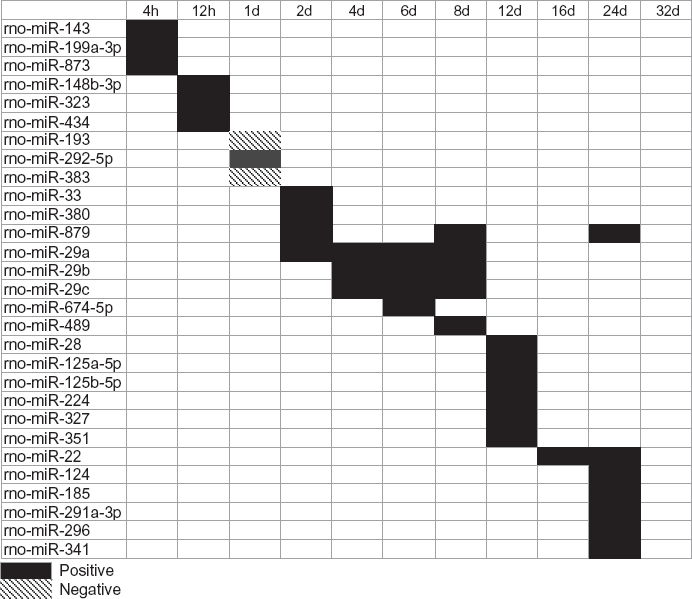
The pattern of predicted MBSs changed over time. Different microRnAs associated with the MBSs were predicted at different time points. Positive MBSs promoted post-transcriptional activity by inhibiting microRnA binding to target gene mRnA and are represented by solid black boxes, while negative MBSs inhibited post-transcriptional activity and are represented by boxes with diagonal black lines.
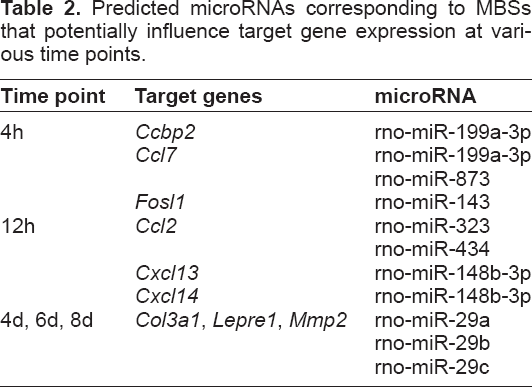
The pattern of predicted MBSs changed over time, similar to the pattern of TFBM prediction. At 4h, microRNAs associated with predicted MBSs included rno-miR-143, rno-miR-199a-3p, and rnomiR-873. These microRNAs were predicted to regulate expression of chemokine target genes
Predicted microRnAs corresponding to MBSs that potentially influence target gene expression at various time points.
Immunohistochemistry
Several STAT motifs were predicted to positively regulate cytokine target genes at 4h, 12h, and 1d. STAT3 is known to play an important role in bone formation and mechanotransduction, 25 and immunohistochemistry was used to qualitatively validate STAT3 protein expression. Immunohistochemistry revealed a qualitative increase in STAT3 expression in a loaded bone at 4d compared to the non-loaded bone (control) from the same animal (Fig. 4).
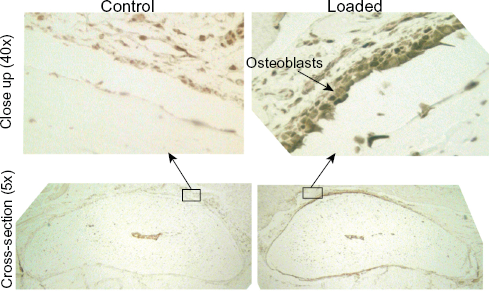
STAT3 expression was qualitatively increased at 4d. A representative matched sample at the 4d time point showed that STAT3 positive osteoblasts and osteocytes (indicated by the brown stain) were present in the loaded ulna (right) but not in the control ulna (left).
Discussion
The TFBMs and MBSs predicted to regulate loading-induced gene expression followed time-dependent patterns over the time course. Several known and potentially novel TFBMs and MBSs were identified.
MotifModeler predicted that 44 unique TFBMs were important in regulating loading-induced gene expression across the time course. The pattern of motif prediction changed over time, and the majority of predicted motifs were positive (ie, promoted transcription) rather than negative (ie, inhibited transcription). Many STAT motifs were predicted at 4h, 12h, and 1d. STAT transcription factors are known to be important in mechanotransduction; for example, signaling through STAT3 plays an important role in bone formation. 25 The STAT motifs were all positive and were present in the promoter regions of several genes, including chemokines and cytokines (Table 1). To validate MotifModeler predictions, we used immunochemistry to detect STAT3 expression at an early (1d) and later (4d) time point (Fig. 4). Although STAT3 was predicted to be important at 4h, an increase in its expression was not detected until 4d. It is possible that the 1d time point was too early to detect a change in STAT3 protein-level expression or that one loading session was not sufficient to increase STAT3 expression.
An interesting novel motif was SREBP-1, and its potential role in regulating bone formation is not clear. SREBP1 is a transcription factor that binds sterol regulatory elements (SREs) and is involved in insulin and leptin regulation, lipogenesis, adipocyte development, and cholesterol homeostasis.31–34 A specific isoform, SREBP1-c, plays a role in obesity by influencing fatty acid metabolism and peroxisome proliferator-acti-vated receptor gamma (PPARG), which is an adipogenic transcription factor.32,35 Recently, it was shown that SREBP-1 transcription factors play a role in myogenesis, myoblast differentiation, and muscle atrophy through interaction with transcriptional repressors basic helix-loop-helix domain containing, class B, 2 (BHLHB2) and BHLHB3. 36 While our data showed that muscle-related genes were downregulated with mechanical loading, 30 SREBP-1 was not predicted by MotifModeler to downregulate muscle genes.
MotifModeler predicted that 29 MBSs regulated gene expression at the post-transcriptional level, and 27 of these were positive (ie, microRNA binding to these MBSs within target genes was inhibited by loading). MicroRNA regulation is important in development and many normal biological processes, but has not yet been studied in the context of bone formation. We determined which MBSs might be important in regulating gene expression, and we identified the specific target genes in which the MBSs were present. For example, MBSs for rno-miR-29a, rno-miR-29b, and rno-miR-29c were predicted by MotifModeler at 4d, 6d, and 8d to regulate
In conclusion, we determined the time sequence of regulatory activities in a bone subjected to mechanical loading and predicted several TFBMs and MBSs that are important in controling the loading-induced bone formation process. To our knowledge, the role of microRNA regulation in bone formation has not yet been investigated and the list of predicted microRNAs could include several novel regulatory mechanisms for loading-induced bone formation.
Footnotes
Acknowledgements
The authors thank Mingxiang Teng for assistance with data analysis and Keith Condon for tissue processing. Exon array hybridization was carried out in the Center for Medical Genomics, which is supported in part by the Indiana Genomics Initiative at Indiana University (INGEN®, which is supported in part by the Lilly Endowment, Inc.). The authors thank the director of the CMG, Howard Edenberg, and also Jeanette McClintick for performing the hybridizations and help with analysis. This work was supported by National Institute of Arthritis, Musculoskeletal and Skin Diseases grant AR46530 and National Institutes of Health grants M01 RR-00750 and P01 AG-18397.
Author(s) have provided signed confirmations to the publisher of their compliance with all applicable legal and ethical obligations in respect to declaration of conflicts of interest, funding, authorship and contributorship, and compliance with ethical requirements in respect to treatment of human and animal test subjects. If this article contains identifiable human subject(s) author(s) were required to supply signed patient consent prior to publication. Author(s) have confirmed that the published article is unique and not under consideration nor published by any other publication and that they have consent to reproduce any copyrighted material. The peer reviewers declared no conflicts of interest.