
Abstract
Recent study has identified the
Introduction
Next generation sequencing (NGS) technologies allow large-scale sequencing at a very low cost. 1 Several technologies on the market are competing for producing massive reads at the lowest cost. Some of the well-known technologies are Illumina, Titanium, Applied Biosystems, and Helicos BioScience HeliScope, capable of producing a million reads. 2 The NGS has revolutionized genetics studies of RNA-Seq for transcriptome analysis and ChIP-Seq for DNA-proteins interaction. 2 As a result, ChIP-Seq becomes an essential tool for studying gene regulation and gene expression, while RNA-Seq becomes an alternative for studying diseases and mutations. 3 ChIP-Seq, or chromatin immunoprecipitation followed by sequencing, is a technique for genome-wide annotation of protein and DNA interaction as well as histone modifications. 4 Unlike its predecessor, ChIP-chip, ChIP-Seq provides higher spatial resolution, dynamic range, and genomic coverage; thus, it has higher sensitivity as well as specificity for protein binding site identification than its predecessor. 5 Moreover, ChIP-Seq can be utilized for analyzing any species with a sequenced genome, since it is not limited by the availability of an organism-specific microarray 5 Because of its advantages for offering higher resolution, less noise, and better coverage, in conjunction with the declining of sequencing cost, ChIP-Seq has grown to be an essential instrument for studying gene regulation as well as epigenetic mechanisms. 4
RNA-Seq is the mRNA sequencing technology that provides high-precision measurement for the levels of transcripts and their isoforms. 3 Thus, it allows the entire transcriptome to be analyzed with a very high-throughput and a quantitative approach. 3
In this work, we investigated two histone marks: H3K4me3 and H3K4me1, which have been used for identifying the
The
We also investigated the functional relationship between mouse liver and mouse embryonic stem cell (mESC) by H3K4me3 and by H3K4me1 using ChIP-Seq. The analysis has been performed by comparing the expressed genes in mouse liver with the expressed genes in mESC for identifying the overlapping genes in both and the non-overlapping genes in each tissue. In addition, we identified the non-overlapping genes in RNA-Seq for mouse liver and for mESC, and verified them using the public Ensemble gene database from NCBI. 15 The verification uncovered the novel genes in RNA-Seq for mouse liver and for mESC. We also further identified the expressed genes in RNA-Seq for liver and for mESC.
Methods
Tools
Our experiments have been performed on a cluster machine and on a PC that has 2 GB of RAM and a 2.19 GHZ processor. The cluster machine has 1 head node and 23 compute nodes. Each node has 24 GB of RAM and 24 2.66 GHZ processors. All experiments have been performed on a single node of the cluster. We used Model-based Analysis of ChIP-Seq (MACS) version 1.4 for identifying the binding sites in ChIP-Seq. 16 MACS uses a dynamic Poisson distribution to calculate the peaks for identifying the binding sites. 16 The reason we used MACS is that it provides the largest number of peaks compared to other tools, and offers high sensitivity and accuracy for peak detection. 17 We employed TopHat version 2.0.8 for identifying the splice junctions in RNA-Seq because of its speed efficiency. 18 We exploited the multi-threaded option in TopHat for utilizing 24 processors within the node. TopHat is a fast read-mapping algorithm, which uses the ultrafast Bowtie aligner for aligning reads from RNA-Seq to the reference genome. 18 We used Cufflinks version 2.0.2 for obtaining the genes and their transcript abundances from RNA-Seq. 19 Cufflinks assembles aligned transcripts from TopHat and estimates their abundances using Fragments Per Kilobase of transcript per Million fragments mapped (FPKM).19,20 We employed Cufflinks as it provides the maximum precision for estimating transcript abundances. 21 Again, we took advantage of the multi-threaded option in Cufflinks for utilizing 24 processors within the node. MACS, TopHat, and Cufflinks are open-source software. MACS is only available for Linux, while TopHat and Cufflinks are available for both Mac OS and Linux. MACS, TopHat, and Cufflinks were installed on the cluster machine. We used ChIPpeakAnno version 2.8.0, 22 which is available from Bioconductor, for identifying nearby genes from the peaks obtained from MACS. ChIPpeakAnno is written in R language and can be installed from R. We employed ChIPpeakAnno because of its ease of use for obtaining nearby genes. ChIPpeakAnno was installed on a laptop PC for our experiments. We used Microsoft Access 2007 for storing the results and reference files. We implemented SQL language for our comparison and analysis.
Datasets
The procedure for preparing the mouse liver and mESC datasets described by Shen et al. has been followed in this study. 23 Mouse liver tissue has been harvested from 8-week adult male C57B1/6 mice. Mouse ESCs have been extracted from E14.5 C57B1/6 mouse embryos. The tissues were minced to fine pieces and prepared for sequencing. The ChIP-Seq sequencing has been carried out on Illumina Genome Analyzer II with 500 μg chromatin and 5 μg antibody. The antibodies used for the datasets in our ChIP-Seq experiment was H3K4me3 (Millipore 05–745) and H3K4me1 (Abeam, ab8895). RNA sequencing has been performed on Illumina Genome Analyzer II using RNA sample tissues that have been extracted from Trizol™ according to protocol (Invitrogen). The polyA+RNA have been purified with the Dynabeads mRNA purification kit (Invitrogen). 23
The undifferentiated E14 mESCs have been cultured under feeder-free conditions, as described by Xiao et al., 24 and guided differentiation has also been carried out. The antibodies used for the datasets in our ChIP-Seq experiment are H3K4me1 antibody, ChIP Grade ab8895, and H3K4me3 antibody, ChIP Grade ab1012. The ChIP-Seq sequencing has been performed on Illumina Genome Analyzer II and the sequence reads were obtained and mapped to reference genomes mm9. 24
In our ChIP-Seq experiment, we used two mouse liver datasets, GEO: GSM722761 and GEO: GSM722760, for H3K4me3 and H3K4me1 respectively, from Shen et al. 23 Each dataset contains two files in bam format that have been aligned with the mouse genome mm9 on Illumina. For the RNA-Seq experiment, we used one mouse liver dataset (GEO: GSM723772) and one mESC dataset (GEO: GSM723776) from Shen et al. 23 The liver dataset contains two files SRR207100 and SRR207101 in Sequence Read Archive (SRA) format. 23 The SRA files have been converted to fastq format using SRA Toolkit for running TopHat.18,25 The mESC dataset also contains two files, SRR207108 and SRR207109, in SRA format, were also converted to fastq format for running TopHat.18,23 Shen et al. produced two files, to ensure that their datasets would be reproducible. Thus, we used both files in their datasets and combined the unique results from both. 23
We also utilized six mESC ChIP-Seq datasets from Xiao et al, 24 for comparing with the results from ChIP-Seq for liver. Three datasets were used for histone H3K4me1: GEO: GSM881352, GEO: GSM881360, and GEO: GSM881369, for mESC E14 day 0, day 4, and day 6 respectively. Three other datasets, for histone H3K4me3, were: GEO: GSM881354, GEO: GSM881362, and GEO: GSM881371 for mESC E14 day 0, day 4, and day 6 respectively. 24
Design
Our experimental design contains seven experiments. The purpose of conducting these individual experiments is that it allowed us to identify highly expressed genes by promoter H3K4me3 or by both promoter H3K4me3 and enhancer H3K4me1 using different filters. It allowed us to identify the genes that carry liver functions and the genes that carry mESC functions as well as the genes that carry common functions from both. It also uncovered the genes in RNA-Seq for liver and the genes in RNA-Seq for mESC that are not presently in the Ensemble gene database at NCBI.
We performed four experiments for comparing genes in ChIP-Seq with genes in RNA-Seq for identifying highly expressed genes by histone H3K4me3 or by both histones H3K4me3 and H3K4me1. In addition, we performed two experiments for comparing genes in mouse liver with genes in mESC for histones H3K4me3 and H3K4me1. Our purpose was to identify genes that perform common functions for liver and mESC, and to identify the unmatched genes in liver and in mESC and investigate their functions using GOStat. 26 We performed an additional experiment to examine the genes in RNA-Seq for liver and the genes in RNA-Seq for mESC, identifying the genes that are expressed in each tissue. We analyzed the results in each experiment and compared them with the results from other experiments to reinforce our investigations. The details of our experimental design are as follows.
We ran MACS for ChIP-Seq datasets to obtain the output peak files.
16
These peak files were used to run
We compared the genes found from ChIP-Seq with the genes found from RNA-Seq for obtaining the overlapping and non-overlapping genes. These overlapping and non-overlapping genes have been confirmed with the Ensemble gene reference from NCBI.
15
We also performed Gene Ontology (GO) analysis on these genes.
27
Figure 1 depicts our workflow. We further compared the overlapping genes from ChIP-Seq with genes in six mESC datasets from Xiao et al.
24
We used tables in a database for storing the output files, and used SQL language for finding the overlapping and non-overlapping genes. Also, the Ensemble gene references
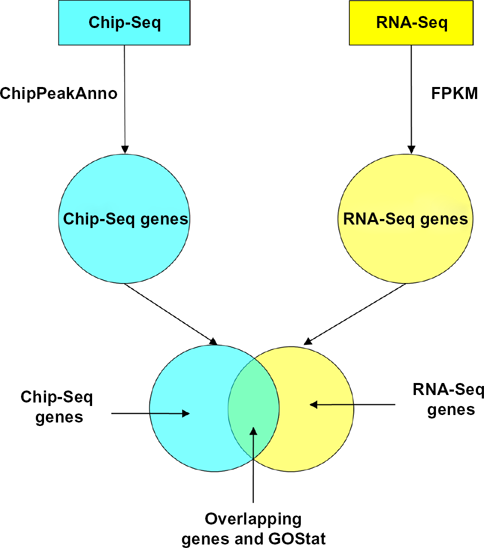
Workflow depicts general steps of the analysis using ChIP-Seq and RNA-Seq.
Experiment 1
To perform our ChIP-Seq experiment, we ran MACS on each file in the dataset for H3K4me3 and used the output peak file in bed format for running
To perform our RNA-Seq experiment, we ran TopHat on both fastq files and obtained the output splice junction files. These output files were used to run Cufflinks for acquiring two output transcripts files. We imported both output files from Cufflinks to the database and applied three different filters on each file to get a set of genes for each filter.
Filter 1: used average FPKM (for FPKM ≥ 0)
We obtained the average FPKM value for all the genes having FPKM ≥ 0 and used this average as a threshold for selecting a set of genes that have FPKM ≥ threshold. Thus, about 50% of the genes in each file were selected.
Filter 2: used all FPKM (for FPKM ≥ 0)
We selected all the genes in each file that have FPKM ≥ 0. Thus, 100% of the genes in each file were selected.
Filter 3: used ¾ (for FPKM ≥ 0)
We sorted the whole file by FPKM value in descending order and selected ¾ of the file from the top down. Thus, 75% of the genes in each file were selected.
For each filter, the genes from both files were combined into a unique list withduplicates removed. Next, the genes found from ChIP-Seq were compared with the genes found from RNA-Seq for each filter. We obtained the overlapping and non-overlapping genes and checked them against the Ensemble gene reference. Lastly, we analyzed the GOStat for the overlapping genes. 26
Experiment 2 co-localization
This experiment consisted of a co-localization between ChIP-Seq for H3K4me3 and ChIP-Seq for H3K4me1. Our purpose was to obtain highly expressed genes from both marks. We followed the same procedure for ChIP-Seq as in Experiment 1 for all files in both datasets, except we used 1 Mb distance as a filter for H3K4me1 to get nearby genes. Since enhancers can be located far away from the TSS, we used a distance of ≤1 Mb for all possible enhancers. This is not the same case for promoter H3K4me3 because the promoter usually locates within 2 kb distance from the TSS. The reason we chose the distance of 1 Mb is that we wanted to make sure that we did not miss possible long range enhancers. In fact, Lettice et al. and Sagai et al. have identified a long range Shh enhancer regulates its target gene in the distance of 1 Mb away.29,30
Subsequently, we combined the genes found from the two files in each dataset, H3K4me3 and H3K4me1, into a unique list. Then, we obtained the matched genes between H3K4me3 and H3K4me1. These matched genes were compared with the genes found in RNA-Seq from Experiment 1 using Filter 1 for obtaining the overlapping and non-overlapping genes. We verified the overlapping and non-overlapping genes with the Ensemble gene reference and performed the GOStat analysis on the overlapping genes. 26
Experiment 3
We used the same dataset for H3K4me3 and followed the same procedure as in Experiment 1 for ChIP-Seq. However, we used the distance ≤500 bp as a filter for obtaining nearby genes. Then, the genes found from ChIP-Seq were compared with the genes found from RNA-Seq using only Filter 3 for obtaining the overlapping and non-overlapping genes. Again, we checked these genes against the Ensemble gene reference and performed the GOStat analysis on the overlapping genes. 26
Experiment 4 Co-localization
This experiment was also a co-localization between ChIP-Seq for H3K4me3 and ChIP-Seq for H3K4me1. We followed the same procedure as in Experiment 2 for ChIP-Seq except we used a distance filter ≤500 bp for H3K4me3 to get nearby genes. We obtained the matched genes between H3K4me3 and H3K4me1. These matched genes were compared with genes found in RNA-Seq from Experiment 1, using Filter 1 for acquiring the overlapping and non-overlapping genes. We checked these genes against the Ensemble gene reference and performed the GOStat analysis on the overlapping genes. 26
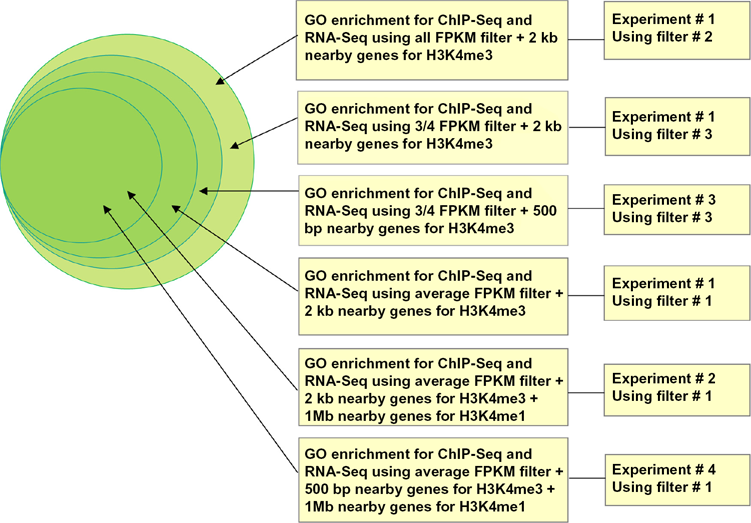
GO enrichment analysis for overlapping genes in Experiment 1 through Experiment 4. The GO enrichment level increases toward inner circle. The innermost circle has the highest GO enrichment level.
Experiment 5
We performed gene comparison between ChIP-Seq for H3K4me1 in mouse liver and ChIP-Seq for H3K4me1 in mESC. The dataset for H3K4me1 in liver was the same dataset used in Experiment 2. The datasets for H3K4me1 in mESC were three mESC datasets for H3K4me1 from Xiao et al.
24
We ran MACS and
Experiment 6
Again we performed gene comparison, this time between ChIP-Seq for H3K4me3 in mouse liver and ChIP-Seq for H3K4me3 in mESC. The dataset for H3K4me3 in liver was the same dataset as used in Experiment 1. The datasets for H3K4me3 in mESC were three mESC datasets for H3K4me3 from Xiao et al.
24
We ran MACS and
Experiment 7
In this experiment, we performed gene comparison between RNA-Seq for liver and RNA-Seq for mESC. We used one RNA-Seq dataset for liver and one RNA-Seq dataset for mESC. We identified the expressed genes for each tissue as well as the genes in mESC that are not found in the Ensemble gene reference. We compared the genes in mESC that are not found in the reference with the list of novel genes found in RNA-Seq for liver and identified additional novel genes in RNA-Seq for mESC.
Comparing results between experiments
We performed three comparisons on the results obtained from different experiments.
Case 1: compare matched genes between Experiment 1 and Experiment 2. We compared the overlapping genes in Experiment 1 using Filter 1 with the overlapping genes in Experiment 2. The comparison was performed in two steps: (1) taking the average FPKM value for the overlapping genes in each experiment, and (2) comparing these two average FPKM values. Since Experiment 2 performs co-localization of H3K4me3 and H3K4me1 marks, we expected that the average FPKM value in Experiment 2 would be higher.
Case 2: compare GOStat in Experiment 5. We used SQL language for comparing the GOStat of unmatched genes in H3K4me1 in liver with the GOStat of unmatched genes in H3K4me1 in mESC. 26
Case 3: compare GOStat in Experiment 6. We used the same procedure as in Case 2 for H3K4me3 mark. 26
Results and Discussion
Experiment 1
For each filter, we obtained the genes from ChIP-Seq and the genes from RNA-Seq, as well as the overlapping and non-overlapping genes between them. All overlapping genes and all non-overlapping genes in ChIP-Seq were found in the reference. However, a number of non-overlapping genes in RNA-Seq were not found in the reference. We manually checked a number of genes that were not found in the reference on the Entrez Gene website from NCBI. The results showed these genes had reference sequence status of validated, predicted, provisional, or inferred. Some examples are
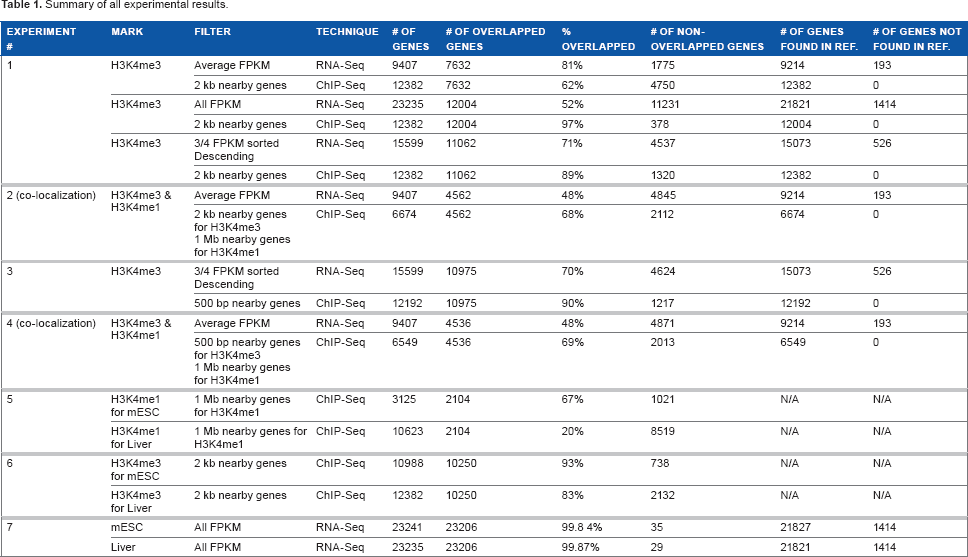
Summary of all experimental results.
Using Filter 2, we obtained the nearby genes for ChIP-Seq using 2 kb distance from the peak to TSS. These are the genes expressed by promoter H3K4me3. We also selected all of the genes for RNA-Seq using all FPKM value ≥ 0 as a threshold. The overlapping genes are expressed genes and promoter H3K4me3 supports their expression, but they are not all highly expressed. For non-overlapping genes in ChIP-Seq but not found in RNA-Seq, these are not expressed genes, though their promoters bear H3K4me3 modification. The non-overlapping genes in RNA-Seq but not found in ChIP-Seq are expressed genes but not for histone H3K4me3.
Using Filter 3, we again acquired the nearby genes for ChIP-Seq using the same 2 kb distance from the peak to TSS. These are expressed genes by promoter H3K4me3. We obtained 75% of the genes from RNA-Seq by sorting FPKM value in descending order. The overlapping genes are expressed and promoter H3K4me3 supports their expression, but they are not all highly expressed. The non-overlapping genes in ChIP-Seq but not found in RNA-Seq are not expressed genes or not strongly expressed genes, though their promoters bear H3K4me3 modification. The non-overlapping genes in RNA-Seq but not found in ChIP-Seq are expressed genes but not for histone H3K4me3.
Using Filter 1, we acquired the nearby genes from ChIP-Seq using the same 2 kb distance from the peak to TSS. These are the genes expressed by promoter H3K4me3. This time we acquired the genes from RNA-Seq using the median FPKM value as a threshold. Thus, we selected about 50% of genes that have expression level ≥ average FPKM value. The overlapping genes are expressed genes and promoter H3K4me3 supported their expression. For non-overlapping genes in ChIP-Seq but not found in RNA-Seq, these are not expressed genes or their expression level is not significant, though their promoters bear H3K4me3 modification. On the other hand, the non-overlapping genes in RNA-Seq but not found in ChIP-Seq are expressed genes but not for histone H3K4me3.
We observed the overlapping genes did not drop a lot from Filter 2 to Filter 3. However, they reduced by half from Filter 3 to Filter 1. This indicates that they are strongly expressed genes. Thus, the more we filtered, the less overlapping genes we obtained but the expression level went up. This observation is confirmed in our comparison sections.
To visualize the difference between gene expression and correlation, we included a snapshot of the UCSC genome browser
28
view of ChIP-Seq and RNA-Seq data in Additional Figure 5. This figure shows the gene
Experiment 2 co-localization
We obtained the matched genes between H3K4me3 and H3K4me1 in ChIP-Seq. These matched genes were compared with the genes found in RNA-Seq, and the overlapping and non-overlapping genes were obtained. All overlapping genes and all non-overlapping genes in ChIP-Seq were found in the reference. Nonetheless, a number of non-overlapping genes in RNA-Seq were not found in the reference. We verified a number of genes that were not located in the reference using the Entrez Gene website and the results are shown as described in Experiment 1. All comparison results are in Table 1 and Figure 3. All novel genes found are included in Additional file 3.xls.
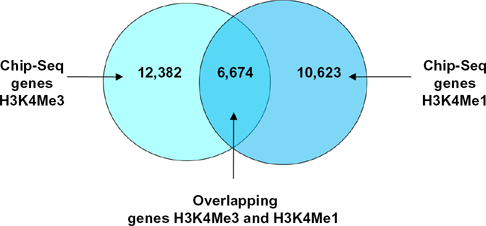
Overlapping and non-overlapping genes from co-localization between ChIP-Seq for H3K4me3 and ChIP-Seq for H3K4me1 in Experiment 2.
This experiment implemented the co-localization between promoter H3K4me3 and enhancer H3K4me1 to get the overlapping genes expressed strongly by both promoter and enhancer. We observed the number of matched genes dropped by nearly half compared to the number of promoter or enhancer genes alone. However, the expression level of these genes is stronger. We compared these matched genes with the genes found in RNA-Seq using average FPKM filter and obtained a list of overlapping genes. This overlapping genes list is smaller than the overlapping genes list found in Experiment 1 using Filter 1 because of co-localization. However, it contains even more highly expressed genes. We consistently observed the trend that the more we filtered, the fewer genes we obtained but the more strongly expressed they were.
Experiment 3
As in Experiment 1, we compared the genes found from ChIP-Seq with the genes found from RNA-Seq to obtain the overlapping and non-overlapping genes. All overlapping genes and all non-overlapping genes in ChIP-Seq were found in the reference. However, a number of non-overlapping genes in RNA-Seq were not found in the reference. We also verified a number of genes that were not located in the reference using the Entrez Gene website. The results are shown as described in Experiment 1. All comparison results are in Table 1. All the genes that are not found in the Ensemble gene reference are included in Additional file 3.xls.
We acquired the nearby genes from ChIP-Seq using 500 bp distance from the start of the peak to the TSS. These are the genes expressed by promoter H3K4me3. We also obtained 75% of the genes from RNA-Seq by sorting FPKM value in descending order. The overlapping genes are those expressed and having promoter H3K4me3 supporting their expression, but they are not all strongly expressed. This overlapping number comparing to the overlapping number from Experiment 1 using Filter 3 does not differ a lot. This indicates that the numbers of nearby genes expressed using the distance of 2 kb or 500 bp are quite similar. Hence, it confirms that most promoters are located in a distance about 2 kb or less to the TSS. The non-overlapping genes in ChIP-Seq but not found in RNA-Seq are not expressed genes or their expression level is not considerable, though their promoters bear H3K4me3 modification. The non-overlapping genes in RNA-Seq but not found in ChIP-Seq are expressed genes but not for histone H3K4me3.
Experiment 4 co-localization
As in Experiment 2, we obtained the matched genes between H3K4me3 and H3K4me1 in ChIP-Seq. These matched genes were compared with the genes found in RNA-Seq for obtaining overlapping and non-overlapping genes. Again, all overlapping genes and non-overlapping genes in ChIP-Seq were confirmed in the reference. However, a number of non-overlapping genes in RNA-Seq were not found in the reference. We also verified a number of genes that were not located in the reference using the Entrez Gene website and the results are shown as reported in Experiment 1. All comparison results are in Table 1 and Figure 4. All novel genes found are included in Additional file 3.xls.
Overlapping and non-overlapping genes from co-localization between ChIP-Seq for H3K4me3 and ChIP-Seq for H3K4me1 in Experiment 4.
This experiment implemented the co-localization between promoter H3K4me3 and enhancer H3K4me1 to get the matched genes expressed strongly by both marks. We observed the number of matched genes dropped less than a half compared to the numbers of the promoter or enhancer genes list alone. However, the expression level of the gene is even stronger. We compared these matched genes with the genes found in RNA-Seq using average FPKM filter to get the overlapping genes. The number of overlapping genes found in this experiment is slightly smaller than the number of overlapping genes found in Experiment 2 because we used a shorter distance of 500 bp to get the nearby genes. The size of the overlapping genes list reduces but it contains more highly expressed genes. Again, we observed the trend that the more we filtered, the fewer genes we acquired but the more strongly expressed they were. This was a consistent result obtained across our experiments.
Again, to visualize the difference between gene expression and correlation, we included two snapshots of UCSC genome browser
28
views of ChIP-Seq and RNA-Seq data in Figures 6 and 7, which can be found in Additional Figure 6 and Additional Figure 7. Additional Figure 6 shows the gene
GO enrichment comparison for Experiments 1–4
We performed the GOStat analysis for all overlapping genes found in Experiments 1–4.
26
We observed all the GO enrichment by GO terms and
In Experiment 1, we used three different filters to select highly expressed genes by promoter H3K4me3 with the distance ≤2 kb from the start of the peak to the TSS. In Experiment 3, we reduced the distance from ≤2 kb to ≤500 bp, and used Filter 3 for selecting strongly expressed genes by promoter H3K4me3. However, the overlapping genes result was comparable to the overlapping genes result from Experiment 1 using Filter 3. Nevertheless, it confirmed the fact that most promoters are located in the distance ≤2 kb to the TSS. These highly expressed genes found by promoter H3K4me3 are included in Additional file 1.xls. In Experiment 2, we selected highly expressed genes by both promoter H3K4me3 and enhancer H3K4me1 using the distance ≤2 kb from the start of the peak to the TSS plus applying Filter 1. To get more strongly expressed genes for both marks H3K4me3 and H3K4me1, we reduced the distance from ≤2 kb to ≤500 bp and used Filter 1 in Experiment 4. Thus, we obtained a list of more strongly expressed genes by both marks H3K4me3 and H3K4me1. These highly expressed genes found by both marks are included in Additional file 2.xls. However, these two histone marks do not always characterize highly active genes, because of the fact that there are a number of non-overlapping, very active genes found in RNA-Seq but not found in ChIP-Seq. These genes possess large FPKM values but they are not for histone H3K4me3 or for both histones H3K4me3 and H3K4me1.
Experiment 5
We compared the genes found in ChIP-Seq for H3K4me1 in mouse liver with the genes found in ChIP-Seq for H3K4me1 in mESC to obtain the overlapping and non-overlapping genes. All comparison results are in Table 1. Some GOStat results can be found in Tables 4–5 in Supplemental Tables.doc. 26
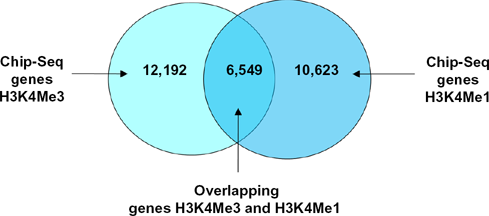
The overlapping genes are genes expressed by enhancer H3K4me1 and they have common functions in both liver and embryonic stem cells. Some common functions in GO terms include act in filament-based process and mammary gland morphogenesis, with GO IDs GO:0030029 and GO:0060443 respectively. 27 The detailed definitions of these GO terms can be found on Gene Ontology website using the GO IDs. 27 The non-overlapping genes found in H3K4me1 liver but not found in H3K4me1 mESC are genes that carry liver functions, although some still have functions related to the embryonic stem cell. Some functions in GO terms for these non-overlapping genes in liver are included in Table 4 in Supplemental Tables.doc. There are 10,623 genes found for H3K4me1 in liver and only 3,125 genes found for H3K4me1 in mESC. This indicates a large number of genes expressed by enhancer H3K4me1 that carry liver functions, compared to a smaller number of genes that carry mESC functions. The non-overlapping genes found in H3K4me1 in mESC but not found in H3K4me1 in liver are genes performing stem cell functions, although some have liver-related functions. Some functions in GO terms for these non-overlapping genes in mESC are included in Table 5 in Supplemental Tables.doc. Again, the detailed definitions can be looked up on Gene Ontology website using their GO IDs. 27
Experiment 6
As in Experiment 5, we compared the genes found in ChIP-Seq for H3K4me3 in mouse liver with the genes found in ChIP-Seq for H3K4me3 in mESC to obtain the overlapping and non-overlapping genes. All comparison results are in Table 1. Some GOStat results can be found in Tables 6–7 in Supplemental Tables.doc. 26
The overlapping genes are genes expressed by promoter H3K4me3 and with common functions in both liver and embryonic stem cells. Some common functions in GO terms include nitrogen compound metabolic process, morphogenesis of a branching epithelium, and establishment of organelle localization, with GO IDs GO:0006807, GO:0061138, and GO:0051656 respectively. 27 The complete definitions of these GO terms can be found on Gene Ontology website using the GO IDs. 27 There is a large number of overlapping genes as most of them were found in both liver and mESC. This indicates there are many genes expressed by promoter H3K4me3 that carry common functions between liver and embryonic stem cell. The non-overlapping genes found in H3K4me3 in liver but not found in H3K4me3 in mESC are genes carrying liver functions, although some still carry functions related to the embryonic stem cell. Some functions in GO terms for these non-overlapping genes in liver are included in Table 6 in Supplemental Tables.doc. The non-overlapping genes found in H3K4me3 in mESC but not found in H3K4me3 in liver are genes performing stem cell functions, although some carry liver-related functions. Some functions in GO terms for these non-overlapping genes in mESC are included in Table 7 in Supplemental Tables.doc.
Experiment 7
We compared the genes in RNA-Seq for liver with the genes in RNA-Seq for mESC to obtain the overlapping genes in both tissues and non-overlapping genes in each tissue. The non-overlapping genes in liver are those expressed for liver while the non-overlapping genes in mESC are those expressed for mESC. These genes are included in Additional file 5.xls and Additional file 6.xls, for liver and for mESC respectively. The comparison results are in Table 1. We found a number of genes in mESC that are not currently in the Ensemble gene reference. Most of these genes are found in the list of novel genes in RNA-Seq for liver, except for a few in RNA-Seq for mESC. These genes are included in the Additional file 4.xls.
Table 1 demonstrates the results obtained in each experiment. Column 2 lists the mark used. Column 3 shows the filter implemented. Column 5 lists the total number of genes acquired for each technique. Column 6 shows the number of overlapping genes obtained. Column 7 shows the overlapping percentage for each technique. Column 8 lists the number of non-overlapping genes found. Columns 9 and 10 show the number genes found in the Ensemble gene reference and the number of genes that were not found in the Ensemble gene reference respectively.
Comparing results between experiments
We performed comparisons on the results obtained from different experiments for three cases.
Case 1: compare matched genes between Experiment 1 and Experiment 2
Let
Let
We investigated whether or not
Case 2: compare GOStat in Experiment 5
We compared the GOStat of unmatched genes found in Experiment 5. 26
Let
Let
We inquired whether
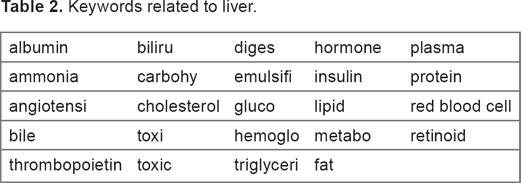
Keywords related to liver.
These functions involve the development of the embryo, such as chordate embryonic development and embryonic morphogenesis. The GOStat results for this finding are in Table 9 in Supplemental Tables.doc. 26 Thus, the findings show the liver still carries embryonic stem cell-related functions and the embryonic stem cell also carries liver-related functions.
Case 3: compare GOStat in Experiment 6
We also compared the GOStat of unmatched genes found in Experiment 6. 26
Let
Let
We inquired whether
The comparison results from case 1 again confirm that the filters we apply, the less overlapping genes we acquire, but they are more highly expressed genes. In addition, co-localization resulted in less overlapping genes but stronger expression. The comparison results from case 2 and case 3 reveal liver carries embryonic stem cell functions while embryonic stem cell carries liver-related functions.
Conclusions
We performed four experiments involving gene comparison for mouse liver between Chip-Seq and RNA-Seq. We identified highly expressed genes by his tone H3K4me3 or by both histones H3K4me3 and H3K4me1 by performing three essential steps. First, we identified the expressed genes in ChIP-Seq by using different filters on the distance from the start of the peak to the TSS. Second, we identified expressed genes in RNA-Seq by implementing different filters on FPKM value. Third, we compared the expressed genes in ChIP-Seq with the expressed genes in RNA-Seq and selected highly expressed genes by both ChIP-Seq and RNA-Seq. These highly expressed genes for histone H3K4me3 or for both histones H3K4me3 and H3K4me1 are included in Additional file 1.xls and Additional file 2.xls respectively. In addition, we performed two experiments copmrising gene comparison between mouse liver and mESC for histone H3K4me3 and for histone H3K4me1 using Chip-Seq. We compared the expressed genes in mouse liver with the expressed genes in mESC and performed the GOStat analysis on the overlapping genes in both tissues and on the non-overlapping genes for each tissue. 26 The GOStat results revealed that in mice, 26 the liver carries embryonic stem cell-related functions, while the embryonic stem cell also carries liver-related functions. Most of the embryonic stem cell-related functions carried by the liver involve embryonic development, while the liver-related functions carried by mESC involve metabolic processes of different activities. We verified the overlapping genes and non-overlapping genes from ChIP-Seq and RNA-Seq with the public Ensemble gene database from NCBL Our analysis uncovered a number of expressed genes that are not currently in the Ensemble gene reference. These genes are in RNA-Seq for mouse liver. We verified a number of these genes on the Entrez Gene website from NCBI and the results showed they are novel genes, which have reference sequence status of validated, predicted, provisional, or inferred. These genes are also included in Additional file 3.xls. Further, we identified the expressed genes for liver and the expressed genes for mESC by comparing genes in RNA-Seq for liver with genes in RNA-Seq for mESC. These genes are included in Additional file 5.xls and Additional file 6.xls for liver and for mESC respectively. Lastly, we identified a number of genes in RNA-Seq for mESC that are not presently in the Ensemble gene reference. Most of them are found in the list of novel genes in RNA-Seq for liver, except for a few that are in RNA-Seq for mESC only. These novel genes are included in Additional file 4.xls.
Footnotes
Author Contributions
NTLT designed, performed the experiments, and drafted the manuscript. C-HH directed and helped to draft the manuscript. All authors reviewed and approved of the final manuscript.
Acknowledgements
We would like to thank anonymous reviewers for their corrections and suggestions to improve our paper.
Disclosures and Ethics
As a requirement of publication author(s) have provided to the publisher signed confirmation of compliance with legal and ethical obligations including but not limited to the following: authorship and contributorship, conflicts of interest, privacy and confidentiality and (where applicable) protection of human and animal research subjects. The authors have read and confirmed their agreement with the ICMJE authorship and conflict of interest criteria. The authors have also confirmed that this article is unique and not under consideration or published in any other publication, and that they have permission from rights holders to reproduce any copyrighted material. Any disclosures are made in this section. The external blind peer reviewers report no conflicts of interest.