
Abstract
The epigenetic silencing of tumor suppressor genes (TSGs) is a common finding in several solid and hematological tumors involving various epigenetic readers and writers leading to enhanced cell proliferation and defective apoptosis. Thymoquinone (TQ), the major biologically active compound of black seed oil, has demonstrated anticancer activities in various tumors by targeting several pathways. However, its effects on the epigenetic code of cancer cells are largely unknown. In the present study, we performed RNA sequencing to investigate the anticancer mechanisms of TQ-treated T-cell acute lymphoblastic leukemia cell line (Jurkat cells) and examined gene expression using different tools. We found that many key epigenetic players, including ubiquitin-like containing plant homeodomain (PHD) and really interesting new gene (RING) finger domains 1 (UHRF1), DNMT1,3A,3B, G9A, HDAC1,4,9, KDM1B, and KMT2A,B,C,D,E, were downregulated in TQ-treated Jurkat cells. Interestingly, several TSGs, such as DLC1, PPARG, ST7, FOXO6, TET2, CYP1B1, SALL4, and DDIT3, known to be epigenetically silenced in various tumors, including acute leukemia, were upregulated, along with the upregulation of several downstream pro-apoptotic genes, such as RASL11B, RASD1, GNG3, BAD, and BIK. Data obtained from RNA sequencing were confirmed using quantitative reverse transcription polymerase chain reaction (RT-qPCR) in Jurkat cells, as well as in a human breast cancer cell line (MDA-MB-468 cells). We found that the decrease in cell proliferation and in the expression of UHRF1, DNMT1, G9a, and HDAC1 genes in both cancer cell (Jurkat cells and MDA-MB-468 cells) lines depends on the TQ dose. Our results indicate that the use of TQ as an epigenetic drug represents a promising strategy for epigenetic therapy for both solid and blood tumors by targeting both DNA methylation and histone post-translational modifications.
Introduction
Genetic abnormalities constitute the basis for the etiology of several tumors. However, in addition to genetic alterations, epigenetic modifications, including DNA methylation and histone post-translational modifications, have been shown to occur during the development of this disease.1–3 DNA methylation and histone post-translational changes frequently lead to the silencing of tumor suppressor genes (TSGs) and, consequently, contribute to carcinogenesis.4–6 Deregulated epigenetic pathways are linked to aberrant activity of readers, erasers and writers involved in these epigenetic processes. In this context, overexpression of DNA methyltransferase 1 (DNMT1), alterations in histone remodeling proteins including the overexpression of histone deacetylase enzymes (HDAC), as well as changes of histone methyltransferases (HMTs) have also been detected in many solid and hematological tumors, including acute lymphoblastic leukemia (ALL).1,7–10 Together, these epigenetic modifications are considered key events during malignant transformation, leading to the deregulation of several oncogenes and tumor suppressors. Dysregulated epigenetic changes become more and more evident in cancer and have a central role in its onset and progression, leading to an increasing demand for the identification of active inhibitory compounds. Unlike genetic modifications, such as mutation, epigenetic changes are reversible, which makes them promising targets for new anticancer drugs.11–13 In this context, DNA hypomethylating agents, such as azacitidine and decitabine, have been used in the clinic setting for decades as anticancer therapy for several tumors.14–16 Histone deacetylase inhibitors (HDACi) are also an emerging class of cancer therapies.17–20 Moreover, several lysine methyltransferases and demethylases have been identified as promising targets for pharmacological intervention.21–23 The identification of new types of DNMT and HDAC inhibitors with selective activities is essential to reduce the chemotherapy toxicity of these agents in cancer patients. Due to their anticancer properties and lower toxicity against normal cells, various natural products have been tested in vitro and in vivo with promising therapeutic effects.24–27 In this context, thymoquinone (TQ), the major biologically active compound of black seed oil, has been shown to induce apoptosis in leukemia cells in a process involving the re-expression of TSGs p16INK4A and p73, which are known to be epigenetically silenced in various cancer cells.10,28,29 TQ-induced reactivation of p16INK4A was accompanied by a significant decrease in the protein expression of the epigenetic integrator UHRF1 and its partners, DNMT1 and HDAC1. 10 Others and we have suggested that TQ could be an inhibitor of DNMT1 and HDAC1.10,11,30–33 These findings suggest that TQ could be a regulator of the “epigenetic cancer signature” by inhibiting several epigenetic players involved in the silencing of TSGs, allowing cancer cells to undergo apoptosis. The aim of the present study was to analyze the differential gene expression (DGE) of TQ-treated Jurkat (JK) cells through RNA-seq and to reveal the epigenetic signaling pathways that could be targeted to induce apoptosis in JK cells.
Materials and Methods
Cell culture and treatment
T-cell ALL JK cell line and MDA-MB-468 cell line, a human epithelial breast cancer cell line, were purchased from American Type Culture Collection (ATCC, Manassas, VA, USA). Cells were maintained in RPMI1640 media for JK and Dulbecco’s modified Eagle medium (DMEM) (UFC-Biotech, Riyadh, Saudi Arabia) for MDA-MB-468 supplemented with 15% (v/v) Fetal bovine serum (FBS), penicillin (100 IU/mL), and streptomycin (100 µg/mL). All cell lines were maintained in a humidified incubator containing 5% CO₂ at 37°C. For all treatments, a 10-mM solution of TQ (Sigma-Aldrich, Louis, MO, USA) was prepared in 10% dimethyl sulfoxide (DMSO) (Millipore, Molsheim, France) and appropriate working concentrations were prepared with cell culture medium. The final concentration of DMSO was always less than 0.1% in both control and treated conditions.
Cell proliferation assay
The effect of TQ on cell proliferation was analyzed by a colorimetric cell proliferation assay using WST-1 Cell Proliferation Reagent Kit (Sigma-Aldrich, catalog no. 11644807001). Briefly, the cells were seeded in 96-multiwell plates at a density of 104 cells/well (counted using Scepter 2.0 Handheld Automated Cell Counter, Millipore, Billerica, MA, USA; catalog no. PHCC20040) for MDA-MB-468 cells or 4 × 10⁴/well for JK cells. After 24 h of incubation, the cells were exposed to different concentrations of TQ for the desired times. Cell proliferation rate was evaluated through a rapid WST-1 reagent. After incubation for the above-mentioned time, 10 µL of the WST-1 solution were added and cells were incubated for an additional 3 h at 37°C. Finally, the absorbance was read at 450 nm with a microplate ELISA (enzyme-linked immunosorbent assay) reader (ELx800, BioTek, USA) and the results were analyzed using the Gen5 software (BioTek, Winooski,Vermont). The reaction is based on the cleavage of the tetrazolium salt WST-1 to formazan by cellular mitochondrial dehydrogenases. The quantity of formazan dye in the medium is directly proportional to the number of viable metabolically active cells. The percentage of cell viability was calculated by assuming that control (untreated) samples are 100% viable.
RNA-seq and differentially expressed gene analysis
RNA-seq was carried out as described elsewhere. 34 Jurkat cells were treated with 20 µM TQ for 24 h, as this concentration was the nearest value to the half maximal inhibitory concentration (IC50), in triplicates. 10 Total RNA was extracted using RNeasy kit (Qiagen, Valencia, CA, USA). RNA quality was assessed using Bioanalyzer RNA integrity number (RIN score > 7.0). Then, the sequencing libraries were generated (TruSeq Stranded mRNA Sample Preparation Kits; Illumina, San Diego, CA, USA) from 2.5 µg of total RNA from each of the 3 biological replicates). Single-end deep sequencing (50 bp long) was performed using Illumina HiSeq 2000 System. The adaptor sequences were removed, and the low-quality base call was filtered by FASTX-Toolkit. The obtained filtered short sequencing reads were mapped to the human genome using TopHat2 and the subsequent gene expression values were quantified using Subreads package Feature Counts function. The DGE analysis was further performed from the gene expression values after identifying the library size and appropriate data set dispersion. Differential gene expression was tested using R/Bioconductor package edgeR. Differential gene expression is determined as the Log2 Fold-Change (Log2FC) with a false discovery rate (FDR) ⩽ 0.05 (Log2FC ⩾ 0.5 or ⩽–0.5). Gene ontology (GO) analysis and BIOCARTA pathway analysis were then performed by setting all the GO terms and BIOCARTA pathway genes as background genes. Overrepresented GO terms or pathways are determined by enrichment score (EASE ⩽ 0.1, gene count ⩾ 2). The heatmap of the genes responsible for epigenetic regulation was plotted using the web tool ClustVis, as per the mentioned algorithm.
Apoptosis assay
To study the apoptosis, JK cells were seeded in 96-well plates at a density of 4 × 10⁴ cells/well, grown for 24 h, and exposed to TQ at different concentrations for 24 h. Cell apoptosis rate was assessed using the Annexin V Binding Guava Nexin Assay by capillary cytometry (Guava Easycyte Plus HP system, with absolute cell count and 6 parameters) following the manufacturer’s recommendations (Guava Technologies, Inc, Hayward, CA, USA). Guava Nexin Assay utilizes Annexin V-PE.
Real-time reverse transcription polymerase chain reaction analysis
Real-time reverse transcription polymerase chain reaction (RT-PCR) analysis was described elsewhere. 35 Briefly, the cells were treated with different concentrations of TQ for 24 h. Then, total RNA was purified and subjected to reverse transcription using Oligo(dt) (Sigma, Steinheim, Germany) and Superscript II reverse transcriptase (Invitrogen, Carlsbad, CA, USA). Quantitative real-time PCR was performed using the LightCycler 480 SYBR Green I Master Kit (Roche Diagnostics, Indianapolis, Indiana, USA) and the Mastercycler Realplex apparatus (Eppendorf, Montesson, France). The results were normalized with Glyceraldehyde-3-phosphate dehydrogenase (GAPDH) mRNA. The sequences of the primers for PCR amplification were UHRF1 (sense: 5′-GTCGAATCATCTTCGTGGAC-3′, antisense: 5′-AGTACCACCTCGCTGGCAT-3′), DNMT1 (sense: 5′-GCACAAACTGACCTGCTTCA-3′, antisense: 5′-GGCCTTTTCACCTCCATCAA-3′), HDAC1 (sense: 5′-GACAAGGCCACCCAATGAAG-3′, antisense: 5′-GCTTGCTGTACTCCGACATG-3′), G9a (sense: 5v-GGAGAAGTGACCCTGACGAA-3′, antisense: 5′-CCTCTTCCTCCTCCTCCTCT-3′), and GAPDH (sense: 5′-GGTGAAGGTCGGA-GTCAAC-3′, antisense: 5′AGAGTTAAAAGC-AGCCCTGGTG-3′). Amplicons were size controlled on agarose gel, and purity was assessed by analysis of the melting curves at the end of the RT-PCR reaction.
Statistical analysis
All data were presented as mean ± SEM of triplicates done in the same experiment or an average of at least 3 separate experiments. The differences between control and treated conditions were analyzed by Student t test (2-tailed) using GraphPad Prism 6 (GraphPad Software, San Diego, CA, USA), and the significant differences were indicated as *P < .05, **P < .01, ***P < .001, and ****P < .0001.
Results
Pro-apoptotic effects of TQ involve modulations of several writer and reader enzymes implicated in epigenetic process
We first analyzed gene expression in JK cells incubated for 24 h with 20 µM of TQ, a concentration approximately corresponding to its half-maximal activity. 10 RNA-seq was done using next-generation sequencing, as described in the “Materials and Methods” section. The data obtained from RNA-seq showed that epigenetic integrator UHRF1; DNA methyltransferases DNMT1,3A,3B; histone deacetylases HDAC1,4,9; histone-lysine N-methyltransferases KMT2,A,B,C,D,E,F; lysine-specific histone demethylase LSD2; as well as HMT G9A were all downregulated in TQ-treated JK cells (Table 1). Interestingly, several TSGs known to be epigenetically silenced in various tumors such as DLC1, PPARG, ST7, FOXO6, TET2, CYP1B1, SALL4, and DDIT3 were upregulated (Table 2), and several downstream pro-apoptotic genes such as RASL11B, RASD1, GNG3, BAD, and BIK were upregulated (Table 3).
Downregulated genes involved in epigenetic pathways in TQ-treated Jurkat cells as compared with untreated cells.
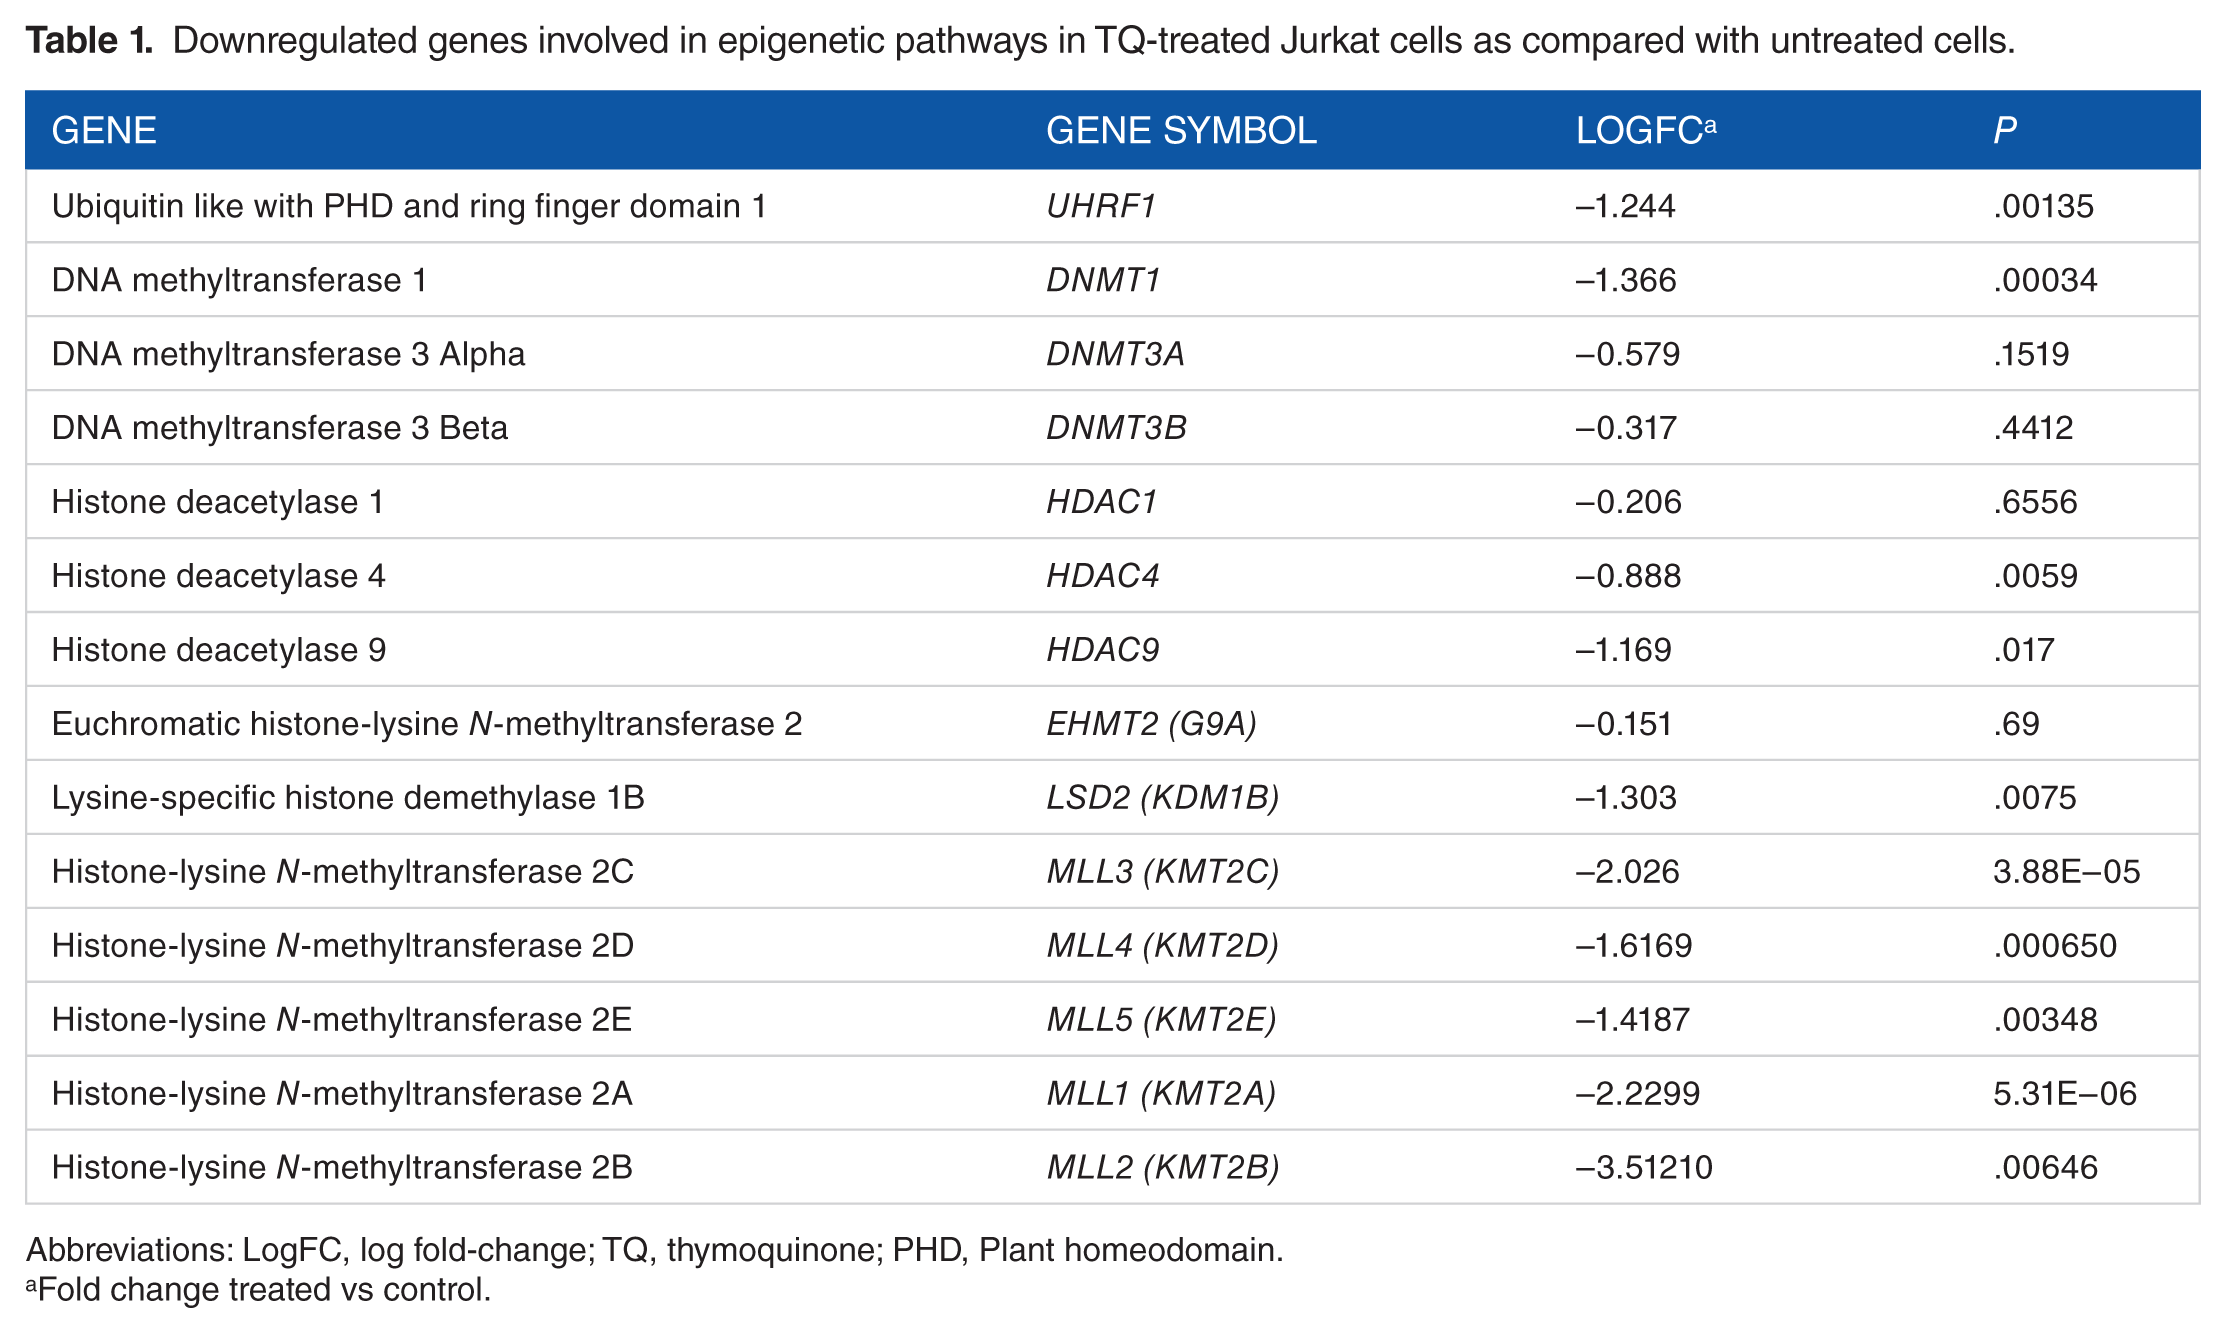
Abbreviations: LogFC, log fold-change; TQ, thymoquinone; PHD, Plant homeodomain.
Fold change treated vs control.
Upregulated tumor suppressor genes in TQ-treated Jurkat cells as compared with untreated cells.

Abbreviations: LogFC, log fold-change; TQ, thymoquinone.
Fold change treated vs control.
Upregulated pro-apoptotic genes in TQ-treated Jurkat cells as compared with untreated cells.

Abbreviations: LogFC, log fold-change; TQ, thymoquinone.
Fold change treated vs control.
These results suggest that the TQ-induced upregulation of TSGs leading to apoptosis in JK cells involves epigenetic mechanisms. The heatmap presented in Figure 1 gives an overall overview of the expression of the modulated genes with respect to both Log2FC and “P” value. The gene interactions of the different TSGs are shown in Figure 2, which represents a brief overview of the different TSG interactions indicated by different line colors. The predicted interactions were the highest (22.79%). The physical interactions between genes were found to be 22.09%, followed by genetic interactions (21.77%). The shared protein domain was found to be at 14.8%, the co-expression of the genes was at 13.99%, and co-localization of the genes was 2.74%, followed by genes involved in the pathway at 1.82%. The colors within the circles that represent each gene represent the pie chart distribution of the different biochemical reaction in which that particular gene is involved, such as DNA methylation and demethylation, histone modification, chromatin silencing, and p53 binding, in the JK cells treated with TQ.

Heatmap of significantly altered Differentially expressed genes (DEGs) showing the corresponding change in expression. The intensity of the color varies with the LogFC from −1 to +2 in TQ-treated Jurkat cells as compared with untreated cells. LogFC indicates log fold-change; TQ, thymoquinone.

Different gene interactions of the most significantly deregulated Differentially expressed genes (DEGs) are represented as strings depicting cell death and tumor suppressor genes in TQ-treated Jurkat cells as compared with untreated cells. TQ indicates thymoquinone.
TQ decreased mRNA expression of UHRF1, DNMT1, HDAC1, and G9a in cancer cells
Our previous study showed that TQ-induced apoptosis in JK cells is associated with downregulation of the protein expression of UHRF1, DNMT1, and HDAC1. 10 Thus, we studied the effect of 5 and 10 µM TQ for 24 h on cell viability and mRNA expression of UHRF1, DNMT1, HDAC1, and G9a in JK (Figure 3) and MDA-MB-468 cells (Figure 4), as a model of solid tumor, using RT-qPCR. We found that mRNA expression of target genes was significantly decreased in a dose-dependent manner in JK (Figure 3A) and MDA-MB-468 cells (Figure 4A) treated with TQ compared with control. Under the same conditions, this effect was associated with a significant decrease in cell viability in JK (Figure 3B) and MDA-MB-468 cells (Figure 4B), as well as with a significant increase in apoptosis in JK cells (Supplemental Figure 1), suggesting a significant role for these epigenetic regulators in the anti-proliferative and pro-apoptotic effects of TQ in cancer cells.

Effect of thymoquinone on cell viability and mRNA expression of UHRF1, DNMT1, HDAC1, and G9a in Jurkat cells. Cells were exposed to increasing concentrations of TQ for 24 h. (A) The histograms show the quantification data of mRNA expression for UHRF1, DNMT1, HDAC1, and G9a as assessed by real-time PCR. (B) Cell viability rate was assessed by WST-1 assay. Values are shown as mean ± SEM (n = 3). *P < .05, **P < .01, ***P < .001, ****P < .0001 vs respective control. PCR indicates polymerase chain reaction; TQ, thymoquinone.

Effect of thymoquinone on cell viability and mRNA expression of UHRF1, DNMT1, HDAC1, and G9a in MDA-MB-468 cells. Cells were exposed to increasing concentrations of TQ for 24 h. (A) The histograms show the quantification data of mRNA expression of UHRF1, DNMT1, HDAC1, and G9a as assessed by real-time PCR. (B) Cell viability rate was assessed by WST-1 assay. Values are shown as mean ± SEM (n = 3). **P < .01, ****P < .0001 vs respective control. PCR indicates polymerase chain reaction; TQ, thymoquinone.
Discussion
The epigenetic silencing of TSGs is a common characteristic in human cancer cells and is considered one of the main mechanisms involved in the regulation of TSGs.3,36,37 This process is mainly ensured through a coordinated dialogue between DNA methylation and histone post-translational modifications, such as acetylation and methylation. In cancer cells, promoters of several key TSGs are hypermethylated by the DNMT1 enzyme, and histone proteins are deacetylated and/or hypermethylated by HDACs and HMTs, respectively. Consequently, those TSGs are inhibited with the subsequent defect in apoptosis.38–41 Therefore, many drugs have been developed that act as inhibitors of DNMT, HDACs, and HMTs leading to the re-expression of TSGs.42–46 In the present study, we evaluated the effect of TQ on the epigenetic code of JK cells, an established cell line for acute T-cell leukemia. By analyzing the data obtained from next-generation sequencing, we found that many key epigenetic players were downregulated in TQ-treated JK cells, including the epigenetic integrator UHRF1, the DNA methyltransferases DNMT1,3A,3B, the histone deacetylases HDAC1,4,9, the lysine-specific histone demethylase KDM1B, the histone-lysine N-methyltransferases KMT2A,B,C,D,E, the histone 3-lysine 9-methyltransferase G9A, and lysine-specific histone demethylase LSD2 (Table 1). Interestingly, several TSGs known to be epigenetically silenced in various tumors, including acute leukemia, such as DLC1, PPARG, ST7, FOXO6, TET2, CYP1B1, SALL4, and DDIT3, were upregulated (Table 2), along with the upregulation of several downstream pro-apoptotic genes such as RASL11B, RASD1, GNG3, BAD, and BIK (Table 3). These findings suggest that TQ-induced apoptosis in acute leukemia could be challenged by epigenetic mechanisms involving both DNA methylation and histone post-translational modifications. In agreement with this hypothesis, recent findings have shown that DNA hypomethylation could be an active target for leukemia therapy in response to anticancer agents, including TQ 47 and the anticancer agent used in clinic practice, 6-thioguanine, 48 through the downregulation of DNMT1, which leads to the reactivation of epigenetically silenced genes in T leukemia cells and subsequent apoptosis.
The promoter of TSG DLC1 was reported to be hypermethylated in hematological malignancies, including ALL, 49 non-Hodgkin’s lymphoma, 7 and multiple myeloma, 50 and its upregulation was associated with cell proliferation inhibition. Our findings indicated that TQ induces a significant increase in the expression of DLC1 (Table 2), suggesting DLC1 as a potent target for TQ in ALL therapy. In addition, several studies have reported aberrant methylation of TSGs TET2 and CYP1B1 in ALL. Indeed, hypermethylation of TET2 51 and CYP1B1 52 as well as their decreased expression levels were detected in childhood ALL patients compared with healthy children and associated with worse overall survival. In the same context, the TSG DDIT3 was found to be hypermethylated in 66% of chronic myeloid leukemia cases. 53 The present study showed that the expression of TET2, CYP1B1, and DDIT3 is increased in TQ-treated JK cells, indicating that these genes could also be targets for TQ in leukemia therapy. The TSG PPARG was found among the most upregulated genes, along with a significant decrease in the expression of the UHRF1 gene, which is regarded as one of the highly documented players involved in the epigenetic silencing of several TSGs.5,11,28,36,54–57 These findings are in agreement with previous studies showing that UHRF1 negatively regulates the expression of peroxisome proliferator-activated receptor gamma (PPARG) in colorectal cancer. 58 As a result of the upregulation of various TSGs, most of the downstream pro-apoptotic genes, including RASL11B, RASD1, GNG3, BAD, and BIK, were also found to be upregulated in TQ-treated JK cells (Table 3), indicating that there is a strong relationship between TQ-induced apoptosis and the upregulation of TSGs.
Next-generation sequencing data were confirmed using RT-qPCR that showed that TQ significantly decreased the expression of UHRF1, DNMT1, HDAC1, and G9a genes in JK cells and that this effect was associated with cell proliferation inhibition and apoptosis under the same conditions.
In the present study, we also evaluated the effect of TQ on MDA-MB-468, a human epithelial breast cancer cell line characterized as triple-negative/basal-A mammary carcinoma, as a model of solid tumor. Similar to our results in JK cells, TQ was able to significantly decrease the cell viability and the expression of UHRF1, DNMT1, HDAC1, and G9a genes. UHRF1 was found to be overexpressed in 88% of triple negative breast cancer, which does not express the estrogen receptor (ER), progesterone receptor (PR), as well as human epidermal growth factor receptor 2 (Her2). 59 The present findings show that the TQ induced the downregulation of UHRF1 and its partners DNMT1, HDAC1, and G9a, and suggest that TQ could be a potent agent for the treatment of cancer cells that highly express UHRF1, including breast cancer.60–67 Thus, targeting UHRF1 and its partners using TQ may be effective and improve the prognosis of this subtype of breast cancer, which still lacks a standard targeted therapy.
Several studies have shown the presence of a coordinated crosstalk between DNA methylation and histone methylation in cancer cells leading to gene expression inhibition.68–70 One of the most important histone modifications, having inhibitory effects on the expression of TSGs, is H3K9me2 or H3K9me3, catalyzed by G9a.71,72 In the present study, we found, for the first time, that TQ significantly decreased the expression of G9a in both cancer cell lines from blood and solid tumors, suggesting that TQ-induced inhibition of G9a is key in the reactivation of TSG and induction of apoptosis. Indeed, inhibition of G9a in breast tumor cell lines using 5-aza-2′-deoxycytidine was reported to be sufficient to induce a reactivation of 2 TSGs, DSC3 and MASPIN, known to be silenced in human breast cancer. 73 UHRF1 was shown to be involved in the epigenetic silencing of the tumor suppressor BRCA1 in sporadic breast cancer through DNA methylation and histone deacetylation and methylation by recruiting DNMT1, HDAC1, and G9a, respectively. 67 The present study showed that TQ decreases the expression of DNMT1/HDAC1/G9a genes in both types of cancers, most likely via inhibition of UHRF1. This idea is supported by the fact that UHRF1, through its several domains, can “read” DNA methylation as well as histone acetylation and methylation, physically linking these 3 epigenetic marks leading to the silencing of TSGs.74,75
Conclusions
The present study suggests that the inhibitory effects of TQ on both blood and solid tumors involve epigenetic mechanisms leading to the upregulation of several TSGs with subsequent apoptosis. These results also suggest that TQ could be used as an epigenetic drug that targets both DNA methylation and histone post-translational modifications, which could be a promising strategy for the epigenetic therapy of both types of tumors.
Supplemental Material
Supplemental_data – Supplemental material for Thymoquinone-Induced Reactivation of Tumor Suppressor Genes in Cancer Cells Involves Epigenetic Mechanisms
Supplemental material, Supplemental_data for Thymoquinone-Induced Reactivation of Tumor Suppressor Genes in Cancer Cells Involves Epigenetic Mechanisms by Shahad A Qadi, Mohammed A Hassan, Ryan A Sheikh, Othman AS Baothman, Mazin A Zamzami, Hani Choudhry, Abdulrahman Labeed Al-Malki, Ashwag Albukhari and Mahmoud Alhosin in Epigenetics Insights
Footnotes
Acknowledgements
The data and material presented in this manuscript have neither been published before nor have been submitted for publication to another scientific journal or are being considered for publication elsewhere. All the co-authors have read this manuscript and approved it for submission.
Funding:
The author(s) disclosed receipt of the following financial support for the research, authorship, and/or publication of this article: The authors would like to acknowledge the support provided by King Abdulaziz City for Science and Technology (KACST), Grant no. 1-17-01-009-0010.
Declaration of conflicting interests:
The author(s) declared no potential conflicts of interest with respect to the research, authorship, and/or publication of this article.
Author Contributions
MA and AA designed the project and wrote the paper. SAQ, MAH, and RAS performed research and analyzed data. OASB, MAZ, ALA and HC helped with experimental design, data interpretation, and drafting of the paper.
References
Supplementary Material
Please find the following supplemental material available below.
For Open Access articles published under a Creative Commons License, all supplemental material carries the same license as the article it is associated with.
For non-Open Access articles published, all supplemental material carries a non-exclusive license, and permission requests for re-use of supplemental material or any part of supplemental material shall be sent directly to the copyright owner as specified in the copyright notice associated with the article.