
Abstract
Background
Repetitive sequences (RSs) are redundant, complex at times, and often lineage-specific, representing significant “building” materials for genes and genomes. According to their origins, sequence characteristics, and ways of propagation, repetitive sequences are divided into transposable elements (TEs) and satellite sequences (SSs) as well as related subfamilies and subgroups hierarchically. The combined changes attributable to the repetitive sequences alter gene and genome architectures, such as the expansion of exonic, intronic, and intergenic sequences, and most of them propagate in a seemingly random fashion and contribute very significantly to the entire mutation spectrum of mammalian genomes.
Principal findings
Our analysis is focused on evolutional features of TEs and SSs in the intronic sequence of twelve selected mammalian genomes. We divided them into four groups–-primates, large mammals, rodents, and primary mammals–-and used four non-mammalian vertebrate species as the out-group. After classifying intron size variation in an intron-centric way based on RS-dominance (TE-dominant or SS-dominant intron expansions), we observed several distinct profiles in intron length and positioning in different vertebrate lineages, such as retrotransposon-dominance in mammals and DNA transposon-dominance in the lower vertebrates, amphibians and fishes. The RS patterns of mouse and rat genes are most striking, which are not only distinct from those of other mammals but also different from that of the third rodent species analyzed in this study–-guinea pig. Looking into the biological functions of relevant genes, we observed a two-dimensional divergence; in particular, genes that possess SS-dominant and/or RS-free introns are enriched in tissue-specific development and transcription regulation in all mammalian lineages. In addition, we found that the tendency of transposons in increasing intron size is much stronger than that of satellites, and the combined effect of both RSs is greater than either one of them alone in a simple arithmetic sum among the mammals and the opposite is found among the four non-mammalian vertebrates.
Conclusions
TE- and SS-derived RSs represent major mutational forces shaping the size and composition of vertebrate genes and genomes, and through natural selection they either fine-tune or facilitate changes in size expansion, position variation, and duplication, and thus in functions and evolutionary paths for better survival and fitness. When analyzed globally, not only are such changes significantly diversified but also comprehensible in lineages and biological implications.
Introduction
Repetitive sequence (RS) elements are characterized as multi-copied sequences in two broadly defined classes: satellite sequences (SSs), including both micro-satellites and mini-satellites, and transposable elements (TEs) that are characterized based on sequence identity and structure, biogenesis, insertion site preference, and degree of redundancies.1,2 The RSs are evolutionarily active and show significant influences on the structures of genes and genomes, and are thus highly relevant to biological functions.3,4 It has been reported that TE-free regions are negatively selected for certain regulatory elements throughout vertebrate genomes, although the conservation of the sequence contents is often variable.5,6 Furthermore, TEs have different distributions among exonic, intronic, and intergenic regions. 7 Indeed, a small number of TE classes are still active, generating population differentiation, 8 and the compositional dynamics of genomic sequences exhibits step-by-step evolutionary changes as a consequence of competitions between host genomes and parasitic sequences. 3 In addition, TE transposition often serves as a driving force for the conversion of introns into exons or gaining novel introns as well as alternatively spliced transcripts.9–11 Therefore, new sequence integration and the balance of exons and introns in number, length, and ordinal position of a gene provide basic materials for species evolution. 12
Different subfamilies of TEs have seemingly diverse influences on genes and genomes by changing sequence length to variable extents. Specifically, due to the distinction between “copy-and-paste” of retrotransposons and “cut-and-paste” mostly used by DNA transposons, the former should be a primary player in the event of genome size increase. 2 Introns are considered as the major “warehouse” of TEs11,13 and certain families of TEs are observed to correlate with functional genes, such as between mammalian interspersed repeats (MIRs) and immune genes. 13 Exploiting the relationship between sequence composition and polymorphism, we noticed that minimal introns (introns in a minimal size range) have unique features distinct from larger introns and demonstrated how these smaller introns escape from TE-driven insertions and also largely free from SS-driven intron expansion.14–16 As many vertebrate genomes have now been sequenced, we are able to address more questions on TE- and SS-driven intron expansions in different vertebrate lineages. In particular, we would like to understand how intron expansion relates to gene functions among the three subgroups of mammals–-primates, large mammals, and rodents–-and what are the roles of mutation and natural selection played in the course of genome evolution.
Results
Intron size increase often involves lineage-specific changes in RS contents in the context of genes
To investigate the relationship between intron size and repeat insertion in a comparable fashion, we divided introns into ten size intervals for the convenience of in-depth analysis since in general introns tend to cluster at certain size ranges (Fig. 1). According to the relationships among shape-variable curves from the three repeat types, retrotransposons, DNA transposons, and satellites, we found that RSs of the twelve mammals fell into two basic patterns. The first pattern is SS-rich, including three rodent species and two primitive mammals, and its repeat abundance ranks as retrotransposon > satellite > DNA transposon. The second pattern, including the rest of the seven mammals, has a repeat content order of retrotransposon > DNA transposon ≥ satellite (the subequal sign is true only for macaque). In addition, we observed an up-convex curvature of retrotransposon distribution and an up-concave curvature of DNA transposon and satellite distributions with the exception that the curves of satellite distribution in mouse and rat are near-linear, indicating that SSs play a relatively dominant role in their intron size expansion. As to the difference between the non-mammal vertebrates and the mammals, we found that DNA transposons have higher abundance but decreasing slope with intron size increase than the other two patterns in both zebrafish and frog. However, this phenomenon disappears and changes into lower abundance and an increasing slope with intron size increase in anole and chicken. The abundance of retrotransposons is lower than those of satellites in zebrafish, frog, and anole, and the abundance of retrotransposons is higher than that of satellites but the mode of slope remains the same in chicken and the mode of slope changes into descending in all twelve mammals.
Percentage of introns with retrotransposons, DNA transposons, and satellites.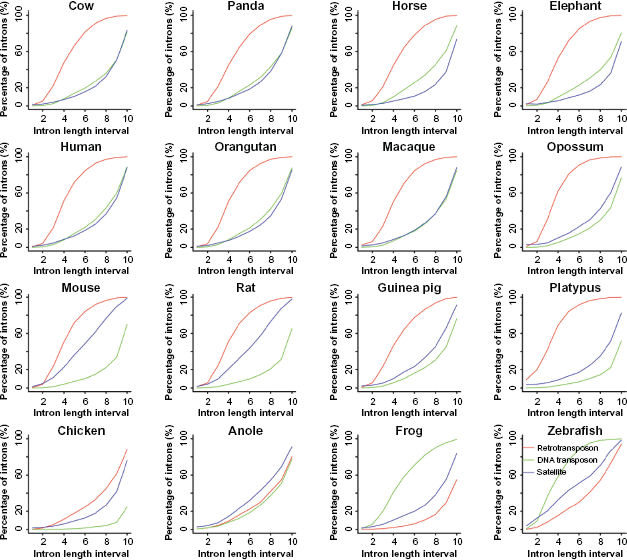
Percentage of introns with classified into repetitive families.
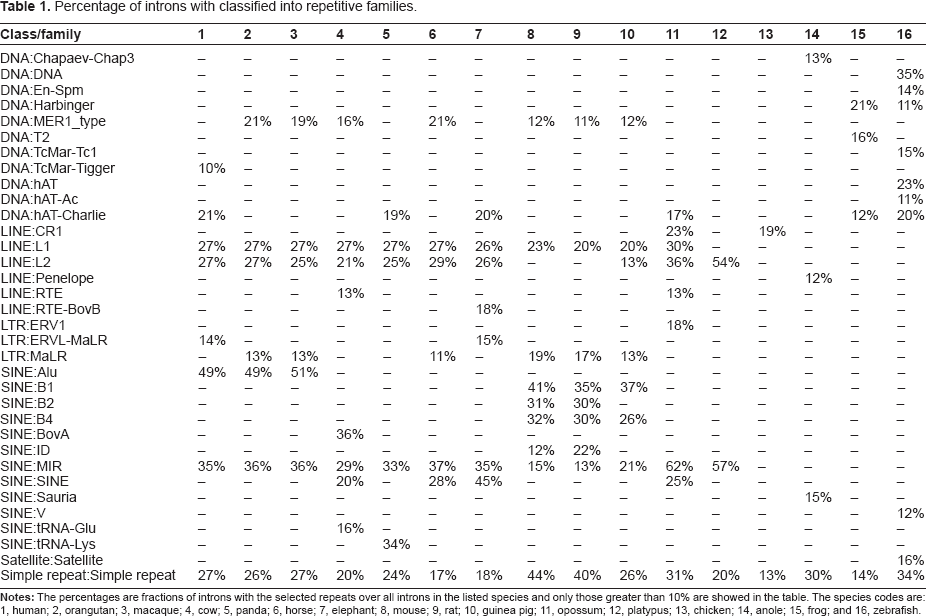
We further identified abundant TE families in each species and have several significant observations (Fig. 2). First, there are near-linear distributions of MIR in introns with a length range of 150 bp–10,000 bp and rapid accumulations of introns over 10,000 bp in the primate and large mammal lineages. In contrast, there is a drastic slowing-down in the rodents, particularly mouse and rat. Aside from this, slowing gains of MIR are also seen in the two primitive mammals. Second, the trends of L1 and L2 insertions over intron sizes are also interesting; the two curves intersect in the large mammals and primates but do not in opossum, where we observe L1 < L2 before and L1 > L2 after the intersections. Third, the distribution of primate-specific Alu repeats has an up-convex curvature, an indication of early saturation and preferred insertions in relatively small introns as compared to LINEs and other SINEs. The rodent-specific B1, in contrast, has a near-linear distribution and is more prevalent than B2 and B4. SINE:ID, unique to mouse and rat, seems more active in rat than in mouse. Fourth, distinctly different from what in other mammals, L2 in platypus behaves similarly to its MIR.
Percentage of introns with selected repeat families.
RS-centric intron expansion involves both size and position effects
To look into distinctive effects of TEs and SSs on intron size and position parameters, we divided introns into four basic classes: TS (both RSs), T (TEs), S (SSs), and N (neither TE nor SS). We focused on three essential intron features: fraction, length, and relative position in a gene. We made the following observations (Fig. 3). First, when plotting the percentage of introns in the four classes, we found that the pattern is rather heterogeneous, ie, the primates, the large mammals, and platypus are grouped together in a pattern of T > N > TS > S, showing a transposon-dominant pattern, so is opossum that has a pattern of T > TS > N > S. Second, mouse and rat form their own group, as it is noticed that both have more satellite sequences than other mammals: TS > N > T > S. Third, aside from the dominant TS-free group or N, guinea pig (N > T > TS > S), frog (N > T > TS > S), and chicken (N > T > TS > S) all have more transposons in their introns than satellites. Fourth, anole and zebrafish have a pattern of N > TS > T > S, in a similar path as compared to mouse and rat regardless of N. If we pick a single most abundant RS-containing intron group, TS, T, S, and N, for a species, the fractions are 39.6%, 52.7%, 12.8%, and 72% in mouse, platypus, anole, and chicken, respectively.
Percentage of the numbers of the four intron classes.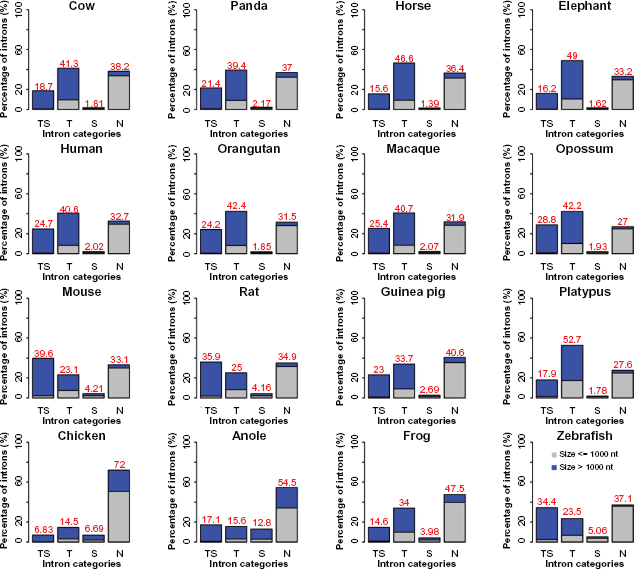
We also investigated the size relevance of introns according to two simple size intervals: ≤ 1000 bp and > 1000 bp. Obviously, the absolute majority of introns in N are small, ≤ 1000 bp, as opposed to the fact that the greater majority of introns in TS and T are larger, > 1000 bp. When examining the median length, we found that intron length increase is correlated with the complexity of RS insertions: TS > T > S > N (Fig. 4). We also observed that the TS intron group tends to be near the 5′-end of genes as opposed to the N intron group that tends to be near the 3′-end of the genes in primates, large mammals, rodents, opossum, and frog, as well as that the TS intron group tends to be near the 5′-end of the genes in platypus, chicken, and anole (Fig. 5). The extremely biased distributions are seen in mouse, where the transposon-rich introns tend to be near the 3′-end, and in zebrafish, where all four intron groups show no significant bias.
Length comparison of the four intron classes. Position index comparisons for the four intron classes.

We further examined both length and position effects for four selected transposons: LTR, LINE, SINE, and DNA. Their intron length medians rank as LTR > DNA > LINE > SINE in the primates, the large mammals, and opossum (Fig. 6). In the three rodents, mouse and rat form a unique league themselves with a length order of DNA > LINE > LTR > SINE, but guinea pig stands alone with a similar pattern to other non-rodent mammals: LTR > DNA > LINE > SINE. In addition, the platypus introns with LTR or DNA transposons tend to be larger in size, in comparison with those of LINE- or SINE-containing introns. In contrast, the chicken introns with LINE tend to be smaller, when compared to those with SINE, DNA or LTR. There are other independent patterns such as LTR > SINE > LINE > DNA and LTR > LINE > SINE > DNA in frog and zebrafish, respectively. An exception is unique to anole, where the order becomes LINE > SINE > DNA when LTR is absent. The most likely reason is the lack of well-classified LTR consensus in the RepeatMasker default library due to high diversity of transposable elements in anole, especially when compared to mammals.
17
In the primates, the large mammals, and guinea pig, the median position index ranks as LTR < DNA < LINE < 0, and the introns with SINEs in cow, panda, horse, human, and guinea pig have a slight bias toward 5′-end (data not shown). In both mouse and rat, the introns with DNA transposons have the most 5′-end biases and those with SINEs have the least 5′-end biases. In the two primitive mammals, opossum and platypus, their LTRs and DNA transposons tend to be inserted into introns near the 5′-end. The chicken introns harbouring LTRs or DNA transposons have a stronger bias toward insertions at the 5′-end than those with LINE. The order of the median intron position index for anole is LINE < SINE < DNA < 0. The positional preference for the frog introns is the proximity of 5′-end but that of DNA transposon-containing introns is the weakest. In zebrafish, introns with LINE, SINE or LTR have a stronger 5′-end preference, and those with LTR have the least bias.
Length comparisons of the four TE-containing intron classes.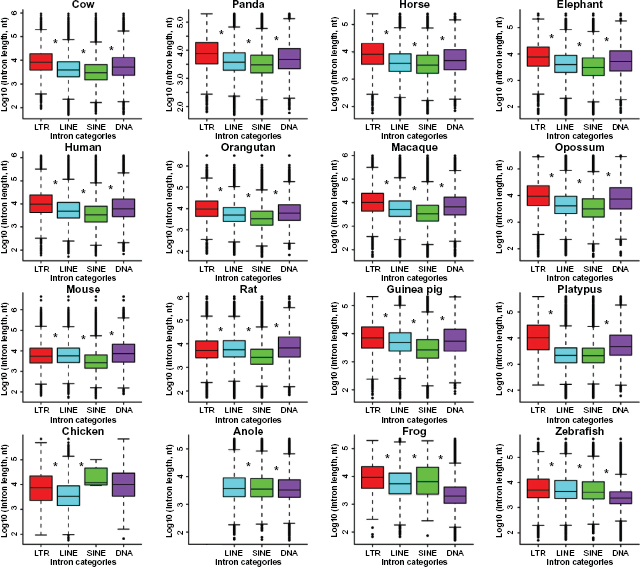
Intronic RS-abundance and RS-specificity define characteristic gene functions in different mammalian lineages
We first classified genes in a similar way to what we did for introns: (1) TS, genes have both transposons and satellites in their introns; (2) T, genes have only transposons in their introns; (3) S, genes have only satellites in their introns; (4) N, genes have neither transposons nor satellites in their introns. In general, we observed an order of TS > N > T > S in chicken and anole, but a different order of TS > T > N > S in the rest vertebrates. When compared the same RS classes from different species, the most abundant four classes for TS, T, S, and N are 83.1% in mouse, 33% in horse, 8.32% in chicken, and 28.4% in chicken, respectively (Fig. 7). Furthermore, we considered functional categorization of the four gene classes in the four mammalian lineages: mammals, primates, large mammals, and rodents. We found diverse development- and transcription-related functions in S and/or N genes, including “embryonic skeletal system development” and “transcription regulator activity” in mammals (Table 2), “negative regulation of neuron differentiation” and “gene expression” in primates (Table 3), “midbrain development” and “regulation of transcription” in large mammals (Table 4), and “inner ear morphogenesis” and “regulation of gene expression” in the rodents (Table 5). There are also lineage-specific and tissue-specific profiles for the expression of these genes. For instance, “hormone activity” of N genes is shared by all the major groups of mammals and “pheromone binding” of S genes is unique to the rodents. There are also genes with immunological functions identified in the primate S (eg, “positive regulation of chronic inflammatory response to antigenic stimulus”) and N genes (eg, “MHC class I receptor activity”), in S genes of the large mammals (eg, “antigen processing and presentation”), and in N genes of the rodents (eg, “inflammatory response”). In addition, some TS genes are related to fundamental structures and metabolic functions, including “cytoskeleton” and “protein homodimerization activity” in the mammals, “extracellular matrix structural constituent” and “regulation of cell shape” in the primates, “ATP biosynthetic process” in the large mammals, and “acyltransferase activity”, “protein ubiquitination”, and “phosphoinositide binding” in the rodents. There are also rodent TS genes involved in the nervous system and being response to external stimulus or environment. As to T genes, mitochondrial structure related functions are found in both the primates and the large mammals.
Percentage of genes in four classes. Mammal-specific GO term enrichment of the four gene classes. Primate-specific GO term enrichment of the four gene classes. Large-mammal-specific GO term enrichment of the four gene classes. Rodent-specific GO term enrichment of the four gene classes.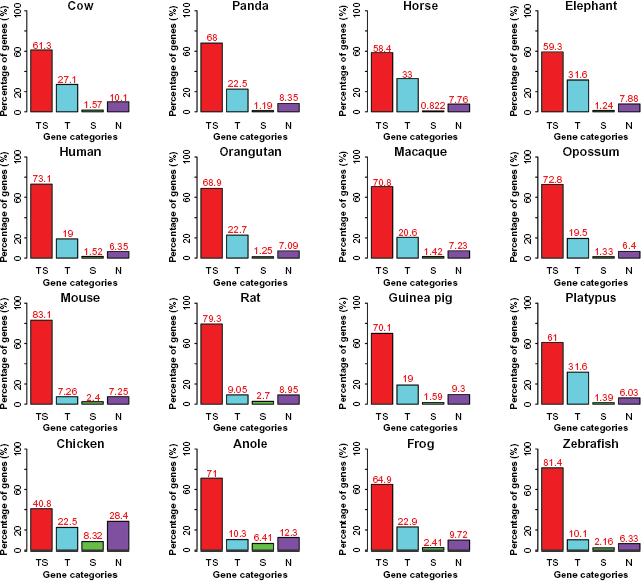


The insertion profiles of TEs and SSs are diverse among the vertebrate genomes
Comparisons of incremental ratio of TEs and SSs.

When integrating the content of intronic repeats in individual genes based on orthology (unique homologous gene in each species), we discovered different topological structures (Fig. 8). The shared clusters between the two trees are the human-orangutan and the mouse-rat clades, the distant relationship to chicken, and the approximation of zebrafish to placental mammals as compared to the other three non-mammalian vertebrates. With regard to TEs, the primates and the large mammals are remarkably distinct from the rest species and are closer to the mouse-rat clade as compared to guinea pig. With regard to SSs, opossum is clustered with the primates as well as the rodents and the four large mammals rather than the other primitive mammal, platypus.
Topological trees constructed based on TE (A) and SS (B).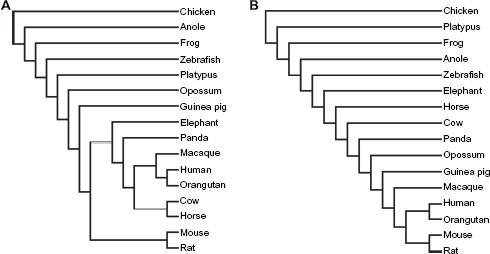
Discussion
Other than whole genome duplication, the complexity of vertebrate genomes builds upon many unique sequence and functional features but one of them is genome expansion that compounds with the expansion of gene and intron sizes. There are three essential ways to increase genome sizes.18,19 The first is to increase the number of genes through genome and gene duplications. The second and also the foremost important mechanism is gene size expansion through intron size and number increases. 20 The final way is the expansion of intergenic sequences and auxiliary chromosomal structures. With regard to the diversity of RSs and insertion/expansion mechanisms, we classified intron expansion into two categories: TE-driven and SS-driven,2,21 and speculated that they may play distinct roles in the intron size expansion of mammalian genomes. First, the profiles of TE insertions can be classified at levels of species and lineages, such as primates, large mammals, and rodents, and we did observe similar modes within lineages and distinctions among lineages. However, exceptions do exist as the rodents are not always cohesive–-guinea pig behaves differently from mouse and rat concerning many RS counts. Second, we would like to emphasize the effect of RS expansion event rather than copy number counts, and we hope to see a clear and direct picture that correlates intron size variation with RS insertion.
In general, both TEs and SSs are reported to be non-randomly distributed among eukaryotic genomes.1,21–23 On one hand, there is strong negative selection to protect essential sequences in genomes for the transmission of basic genetic information in a relative shorter evolutionary time scale, such as protein-coding sequences or exons. On the other hand, RSs are indispensable as the prime power and raw materials for genomes to evolve for better fitness, to generate complexity and diversity, and to promote speciation and population dynamics.2,24 Therefore, RSs have strong influences on gene expression and regulation indirectly through variations in intron length and content.10,13 One mechanism shared by all the studied vertebrates is that both TE and SS insertions increase intron size but the strength of the former is much greater than that of the latter. In fact, after eliminating RS insertions in all introns, we observed that the tendency of length increase in the four intron classes remains the same. In other words, the large introns remain large in size even without RS insertions in all four intron classes and so do small introns. However, the introns of anole and chicken genomes are exceptional, where the intron size definitions may shift or not be clearly distinguishable between large and small when RS insertions are removed from the intron sequences (data not shown). We observed a non-random and unbalanced expansion mechanism of intron size evolution: larger introns tend to grow faster than smaller ones when introns are enlarged to a certain size or over a specific threshold. Furthermore, we investigated relationship and mechanism of TE- or SS-driven intron expansions. Satellites can increase intron size at an early or primitive stage as they change intron size in a relatively limited scale, but transposons are capable of increasing intron size in a larger (such as LINEs) and more massive (such as LTRs in multiple insertions) scale and thus have stronger influence on intron size expansion. Most importantly, we observed a synergy between TE-driven and SS-driven insertions, providing a greater degree of intron expansion
To understand the possible roles of RS families on gene and intron size expansions, we paid special attention on intron length and positioning within a transcript and on functional enrichment in the context of TE- vs. SS dichotomy among species and lineages. For instance, we found that TS-containing introns have a 5′-end bias in all vertebrates but zebrafish and that the RS-free (or the N class) introns have a 3′-end bias in all mammals but platypus. We have recently identified distinct functional profiles of genes at different evolving rates in primates, large mammals, and rodents, 25 and in this study we used a similar classification scheme to investigate protein-coding genes with RS-driven intron expansion. For instance, DNA transposon-containing introns tend to be smaller in fraction, larger in size, and biased toward 5′-end enrichment in mouse and rat. We also pointed out that genes with TE-free introns are enriched in both development and transcription and genes with SS-containing introns are mostly immunity-related in primates and large mammals. 13 We also extracted function categories in nervous systems for mammalian genes possessing SS-containing introns since microsatellite alternations may lead to neurological disorders. 26 Previous studies proposed that microsatellites are unevenly positioned within different regions of protein-coding genes such as UTRs, exons, and introns, and they may play functional roles in regulating gene expression, splicing, mRNA export, and response to external environment. 27 Most SSs that we studied are microsatellites, and we demonstrated that there are functional biases in SS-insertions, such as promoter-related regulatory genes as one of the major categories. In addition, SSs preferentially reside in heterochromatins at or near centromeres and telomeres, where transcriptional activities are rarely discovered. However, if detected, the genes are usually development-related and involved in epigenetic regulation and DNA methylation; the latter two lead to the alteration of chromatin state and may in turn regulate the expression of SS-containing noncoding RNAs.28,29 We concluded that combined or independent effects of species/lineage-specific TEs and SSs may play an important role in functional differentiations of intron-containing protein-coding genes. At present, the sequence-similarity-based RS library is mostly composed of known TEs, especially the collection of mammal-specific sequences. As increasing number of completed high-quality non-mammalian vertebrate genomes are being sequenced, together with the help of de novo identification technologies,30,31 there should be more novel species-specific TEs discovered, adding stronger validation power to the current study.
It is vital for us to track down the precise timing of intron evolution and expansion, such as in a context of lineages, especially the number of introns per gene and the length variation of introns. 32 Spliceosomal introns are the great majority in vertebrate genomes, albeit opposing hypotheses on the origin of introns, “intron-early” and “intron-late”, which argue that introns of this particular type is either more ancient or late comers. 33 Further analyses on genomes based on taxonomy suggested that intron loss is the dominant phenomenon with position- and phase-specificity in modern mammals and perhaps large amount of intron gains occurred at the early stage of animal evolution,34–36 and recent study has found several cases of intron gains happened in the ancestor of placental mammals in transposon-derived domestication-related genes. 37 Moreover, gene length is correlated with gene expression levels and breaths and is affected by RS insertions, such as L1 and MIR. 38 Housekeeping genes are often highly-expressed and harbor smaller introns to reduce the processing cost of transcription, including time and energy. In contrast, tissue-specific genes are often lowly-expressed and harbor larger introns, requiring more effective and complex regulatory elements.38,39 Our data, based on a RS-centric stratification approach, showed that intron expansion is strongly influenced by not only RS types but also insertion timing, and the latter is manifested as species-specific propagation of distinct RSs. A comparative study concerning the five teleost genomes indicated that zebrafish experienced an ancient large-scale RS-induced intron expansion, and RS profiles of such expansion is rather distinct from the other four fishes with relatively lower insertion frequency. 40 Based on these observations, we suspect that the RS content diversity that we observed among vertebrate introns or genes may not be straightforward to characterize with regard to precise timing as the samples we used are still in a limited scope. Insertions of both TEs and SSs should avoid making damages to key regulatory sequences, such as the splice sites, the branch point, the polypyrimidine tract, and other uncharacterized functional elements, and have potential co-evolving patterns with neighbouring sequences; 41 and in particular, TEs (eg, SINEs) facilitate the splicing of larger introns via the formation of secondary structure in mammals. 42 TE- and SS-derived RSs are forced to cluster or locate in intronic regions and seldom occur in core regulatory regions that are constantly under strong positive or negative selections.
Methods
Species names and the numbers of introns used in this study.

Author Contributions
Conceived and designed the experiments: DW, JY, HL. Collected the data: DW, YS, XW. Analysed the data: DW, YS. Contributed to the writing of the manuscript: DW, JY. All authors reviewed and approved of the final manuscript.
Funding
The work was supported by grants from Knowledge Innovation Program of the Chinese Academy of Sciences (KSCX2-EW-R-01-04); Natural Science Foundation of China (90919024); Natural Science Foundation of China (30900831); and the National Basic Research Program (973 Program) from the Ministry of Science and Technology of the People's Republic of China (2011CB944100).
Competing Interests
Authors disclose no potential conflicts of interest.
Footnotes
As a requirement of publication author(s) have provided to the publisher signed confirmation of compliance with legal and ethical obligations including but not limited to the following: authorship and contributorship, conflicts of interest, privacy and confidentiality and (where applicable) protection of human and animal research subjects. The authors have read and confirmed their agreement with the ICMJE authorship and conflict of interest criteria. The authors have also confirmed that this article is unique and not under consideration or published in any other publication, and that they have permission from rights holders to reproduce any copyrighted material. Any disclosures are made in this section. The external blind peer reviewers report no conflicts of interest.