
Abstract
KCNQ1OT1 is located in the region with the highest number of genes showing genomic imprinting, but the mechanisms controlling the genes under its influence have not been fully elucidated. Therefore, we conducted a comparative analysis of the KCNQ1/KCNQ1OT1-CDKN1C region to study its conservation across the best assembled eutherian mammalian genomes sequenced to date and analyzed potential elements that may be implicated in the control of genomic imprinting in this region. The genomic features in these regions from human, mouse, cattle, and dog show a higher number of genes and CpG islands (detected using cpgplot from EMBOSS), but lower number of repetitive elements (including short interspersed nuclear elements and long interspersed nuclear elements), compared with their whole chromosomes (detected by RepeatMasker). The KCNQ1OT1-CDKN1C region contains the highest number of conserved noncoding sequences (CNS) among mammals, where we found 16 regions containing about 38 different highly conserved repetitive elements (using mVista), such as LINE1 elements: L1M4, L1MB7, HAL1, L1M4a, L1Med, and an LTR element: MLT1H. From these elements, we found 74 CNS showing high sequence identity (>70%) between human, cattle, and mouse, from which we identified 13 motifs (using Multiple Em for Motif Elicitation/Motif Alignment and Search Tool) with a significant probability of occurrence, 3 of which were the most frequent and were used to find transcription factor–binding sites. We detected several transcription factors (using JASPAR suite) from the families SOX, FOX, and GATA. A phylogenetic analysis of these CNS from human, marmoset, mouse, rat, cattle, dog, horse, and elephant shows branches with high levels of support and very similar phylogenetic relationships among these groups, confirming previous reports. Our results suggest that functional DNA elements identified by comparative genomics in a region densely populated with imprinted mammalian genes may be related to the regulation of imprinted gene expression.
Keywords
Introduction
Genomic imprinting is the expression of only one allele from the chromosome of a specific parent, instead of the alleles of both parents, which is different from monoallelic expression where no bias exists toward a specific parental allele. This has been described in insects,1–4 higher plants,5–7 and mammals, but the latter is where it has mostly been studied.8–12 This pattern of expression ranges from a small but significant bias toward one parental allele to a complete shutdown of one of the parental alleles. 13 To date, out of the about 25 000 genes described in the human genome, only 212 have been reported to show imprinted expression, 123 in mouse and 20 in cattle (Geneimprint, http://www.geneimprint.com). Even though many of these genes have not been studied in most mammals, they are predicted to be conserved due to their important roles in the development of the placenta, embryo, fetus, and neurons, among other functions. 14
The p15.5 region of chromosome 11 in the human genome contains the highest density of imprinted genes, which is divided into 2 regions, 1 more telomeric with the H19-TH gene cluster and another toward the centromere, containing genes clustered around ASCL2-OSBPL5, where each block is independently regulated by imprinting control regions (ICRs) through differentially methylated regions (DMRs). 15 Mutations in any of these regions produce changes in the gene expression patterns leading to diseases such as the Beckwith-Wiedemann and Silver-Russell syndromes, producing either overgrowth or undergrowth of the fetus/newly born, respectively, as well as other complications. 14
The control mechanism in the telomeric region containing the KCNQ1OT1 gene cluster has not been as well studied as the mechanisms in the H19-TH region, and it seems to be more complex, implicating at least 2 types of control and regulating no less than 9 genes. 16 The KvDMR control element located at the promoter region of the KCNQ1OT1 gene is methylated in the maternal allele, thereby inhibiting the expression of this gene but allowing the expression of the maternal alleles of other genes. In the paternal chromosome, KvDMR is not methylated, allowing the binding of CTCF at this region and silencing the maternally expressed genes through its isolating property, and the formation of a DNA loop, mediated by the binding of the long, noncoding RNA from KCNQ1OT1. 17 This RNA also associates with the maternally expressed genes inducing its silencing via histone hypoacetylation and methylation of CpGs, which produces the condensation of the chromatin. 16 However, the mechanisms controlling the region affected by KvDMR and KCNQ1OT1 are complex and require the identification of all the regulatory sequences and their relative locations, their tissue specificity, and their 3-dimensional architecture to fully understand their developmental role in vivo. 16 Significantly, this region is an excellent model to understand mechanistically how enhancers, insulators, noncoding RNAs, and target genes are deployed to generate the appropriate expression outputs in the endogenous context. To this end, we conducted a comparative analysis of this region to study its conservation across several well sequenced eutherian mammalian genomes and to elucidate potential controlling elements participating in the control of genomic imprinting in the KCNQ1OT1-CDKN1C region.
Materials and Methods
We conducted a comparative analysis of the region containing the highest density of genes showing genomic imprinting, by examining the genomes of several mammalian species with high sequence depth. In Homo sapiens, this region, located in the p15.5 region of chromosome 11 is 1.2 Mbp in size, extending across H19 to OSBPL5 genes. For the gene nomenclature, we followed the guidelines for HUGO Gene Nomenclature Committee (HGNC 18 ).
Genome sequences and analytical tools
The genomic sequences from human (NC_000011.10, assembly GRCh38.p7, TaxID: 9606), marmoset (NC_013906.1, assembly 3.2, TaxID: 9483), horse (NC_009155.2, assembly EquCab2.0, TaxID: 9796), dog (NC_006600.3, assembly CanFam3.1, TaxID: 9615), cattle (AC_000186.1, assem-bly UMD_3.1.1, TaxID: 9913), mouse (NC_000073.6, assembly GRCm38.p4 C57BL/6J, TaxID: 10090), rat (NC_005100.4, assembly Rnor_6.0, TaxID: 10116), elephant (NW_003573565.1, assembly Loxafr3.0, TaxID: 9785), and chicken (NC_006092.3, assembly 5.0, TaxID: 9031) were obtained from the GenBank (www.ncbi.nlm.nih.gov/genbank) for the purpose of comparative analysis. Gene annotation were performed on GenBank, using the latest version of Map Viewer (January 26, 2004) for each species. CpG islands were identified using the program cpgplot from EMBOSS (V: 2.0; www.ebi.ac.uk/Tools/seqstats/emboss_cpgplot), which defines an island as a region where the proportion of CGs and/or GCs observed over the expected was above 0.6 and with the %G + %C content above 50%, calculated as a sliding average over 10 windows with a minimum size of 100 nucleotides. 19 The number and type of repetitive sequences were detected with RepeatMasker, version 4.0.5 (www.repeatmasker.org/cgi-bin/WEBRepeatMasker). 20 The genomic sequences were compared using the program LAGAN from the suite mVISTA (V: 2.0; genome.lbl.gov/vista/index.shtml), 21 which performs progressive pairwise alignments, guided by a phylogenetic tree, aligned to other alignments using the sum-of-pairs metric. 22
Comparative genome analysis between mammals
Matched sequences with 70% or higher identity with human were used to find sequence motifs, a sequence pattern repeated in a group of DNA sequences, with the Multiple Em for Motif Elicitation (MEME) suite (Motif-based sequence analysis tools, version 4.10.0; meme.nbcr.net/meme/tools/meme). We calculated the log-likelihood ratio of the occurrences producing a probability that the motif is found by chance. A motif was taken as statistically significant when the probability of occurrence was below 0.05, with motifs between 6 and 100 nucleotides, located in 1 or more positions for each sequence. The program Motif Alignment & Search Tool (MAST) was used to find the motifs, identified by MEME in the conserved sequences. We calculated the match scores for each conserved sequence converted into various types of P values that were used to determine the overall match of the sequence to the motifs and the probable order and spacing of occurrences of the motifs in the sequences. 23
The most frequent motifs found in the conserved sequences were used to search for transcription factor binding sites through the JASPAR suite (version 5.0_ALPHA; jaspar.genereg.net). 24 This is a collection of transcription factor DNA-binding preferences, modeled as matrices, converted into position weight matrices or position-specific scoring matrix and used for scanning those sequences. The JASPAR CORE database contains a curated, nonredundant set of profiles from published articles, where the transcription factor–binding sites were experimentally defined for multicellular eukaryotes. 25 The prime differences to similar resources (TRANSFAC, etc) consist of open data access, nonredundancy, and quality of the binding sites.
Data analysis and statistics
In addition, the conserved noncoding sequences (CNS) found in the introns of the region KCNQ1/KCNQ1OT1-CDKN1C with sequence identity >70%, (which was the region with the highest conservation) were divided into repetitive conserved noncoding sequences (RCNS) and unique conserved noncoding sequences (UCNS). Along with the coding sequences (CDS) for the genes KCNQ1 and CDKN1C, they were used to determine evolutionary pattern by determining the phylogenetic relationships among human, marmoset, horse, dog, cattle, mouse, rat, and elephant. First, the Neighbor-Joining Method was used, 26 computing the evolutionary distances by Maximum Composite Likelihood method. 27 Second, the Maximum Likelihood method 28 with a discrete Gamma distribution was used to model evolutionary rate differences among sites. Both analyses were conducted in MEGA7. 29 Finally, a Bayesian phylogenetic analysis was conducted using MrBayes, v 3.2.1, 30 implementing the general time-reversible model with the rate at each site as random variable with a gamma distribution (G) and a proportion of invariable sites. A bootstrap test 31 of 1000 replicates was used to determine the statistical support of the branches in the most likely tree. The evolutionary distances used to infer the phylogenetic tree were computed using the Maximum Composite Likelihood method 27 and are in the units of the number of base substitutions per site. In the analysis, all positions containing gaps and missing data were eliminated.
Results
Comparing the region containing the imprinted genes in the block p15.5 of human chromosome 11 with those of mouse, cattle, dog, and chicken, we found an extensive conservation in the gene order and number of intron/exons (Figure 1), although the size of the introns and intergenic spacing was highly variable. In addition, we found CpG islands in almost all of the promoter regions, which should be involved in the control of gene expression.

Region in the genomes of human (HSA11), mouse (MMU7) cattle (BTA29), dog (CFA18), and chicken (GGA5) containing the highest density of genes with genomic imprinting. The genes in red have shown preferential maternal expression, those in blue preferential paternal expression, the ones in gray have no evidence of either pattern of expression and those in black have shown biallelic expression. The measures of the maps are in millions of base pairs (Mbp). The genes are represented with their exons (boxes) and introns (thin lines). The black horizontal lines represent the CpG islands present in each genome.
There were many CNS between the human genome and those of marmoset, horse, dog, cattle, mouse, rat, and elephant in the introns and the intergenic spacing in the whole region (Figure 2). Even though KCNQ1OT1 is only annotated in the human and mouse genomes, its high conservation in the other mammals suggests the possibility that it is also present in these genomes. In the rat genome, there is no sign of conservation because the sequences are undetermined for this region. The KvDMR element located at the promoter and first part of the transcription sequence of KCNQ1OT1 shows very high conservation. The proportion of CNS between the human and the horse genomes is the highest, followed by dog and cattle, and much less than with the mouse and rat, even though rodents have been shown to be the closest group to primates. In addition, all the CDS show high conservation between human and all other mammalian genomes as well as with chicken.
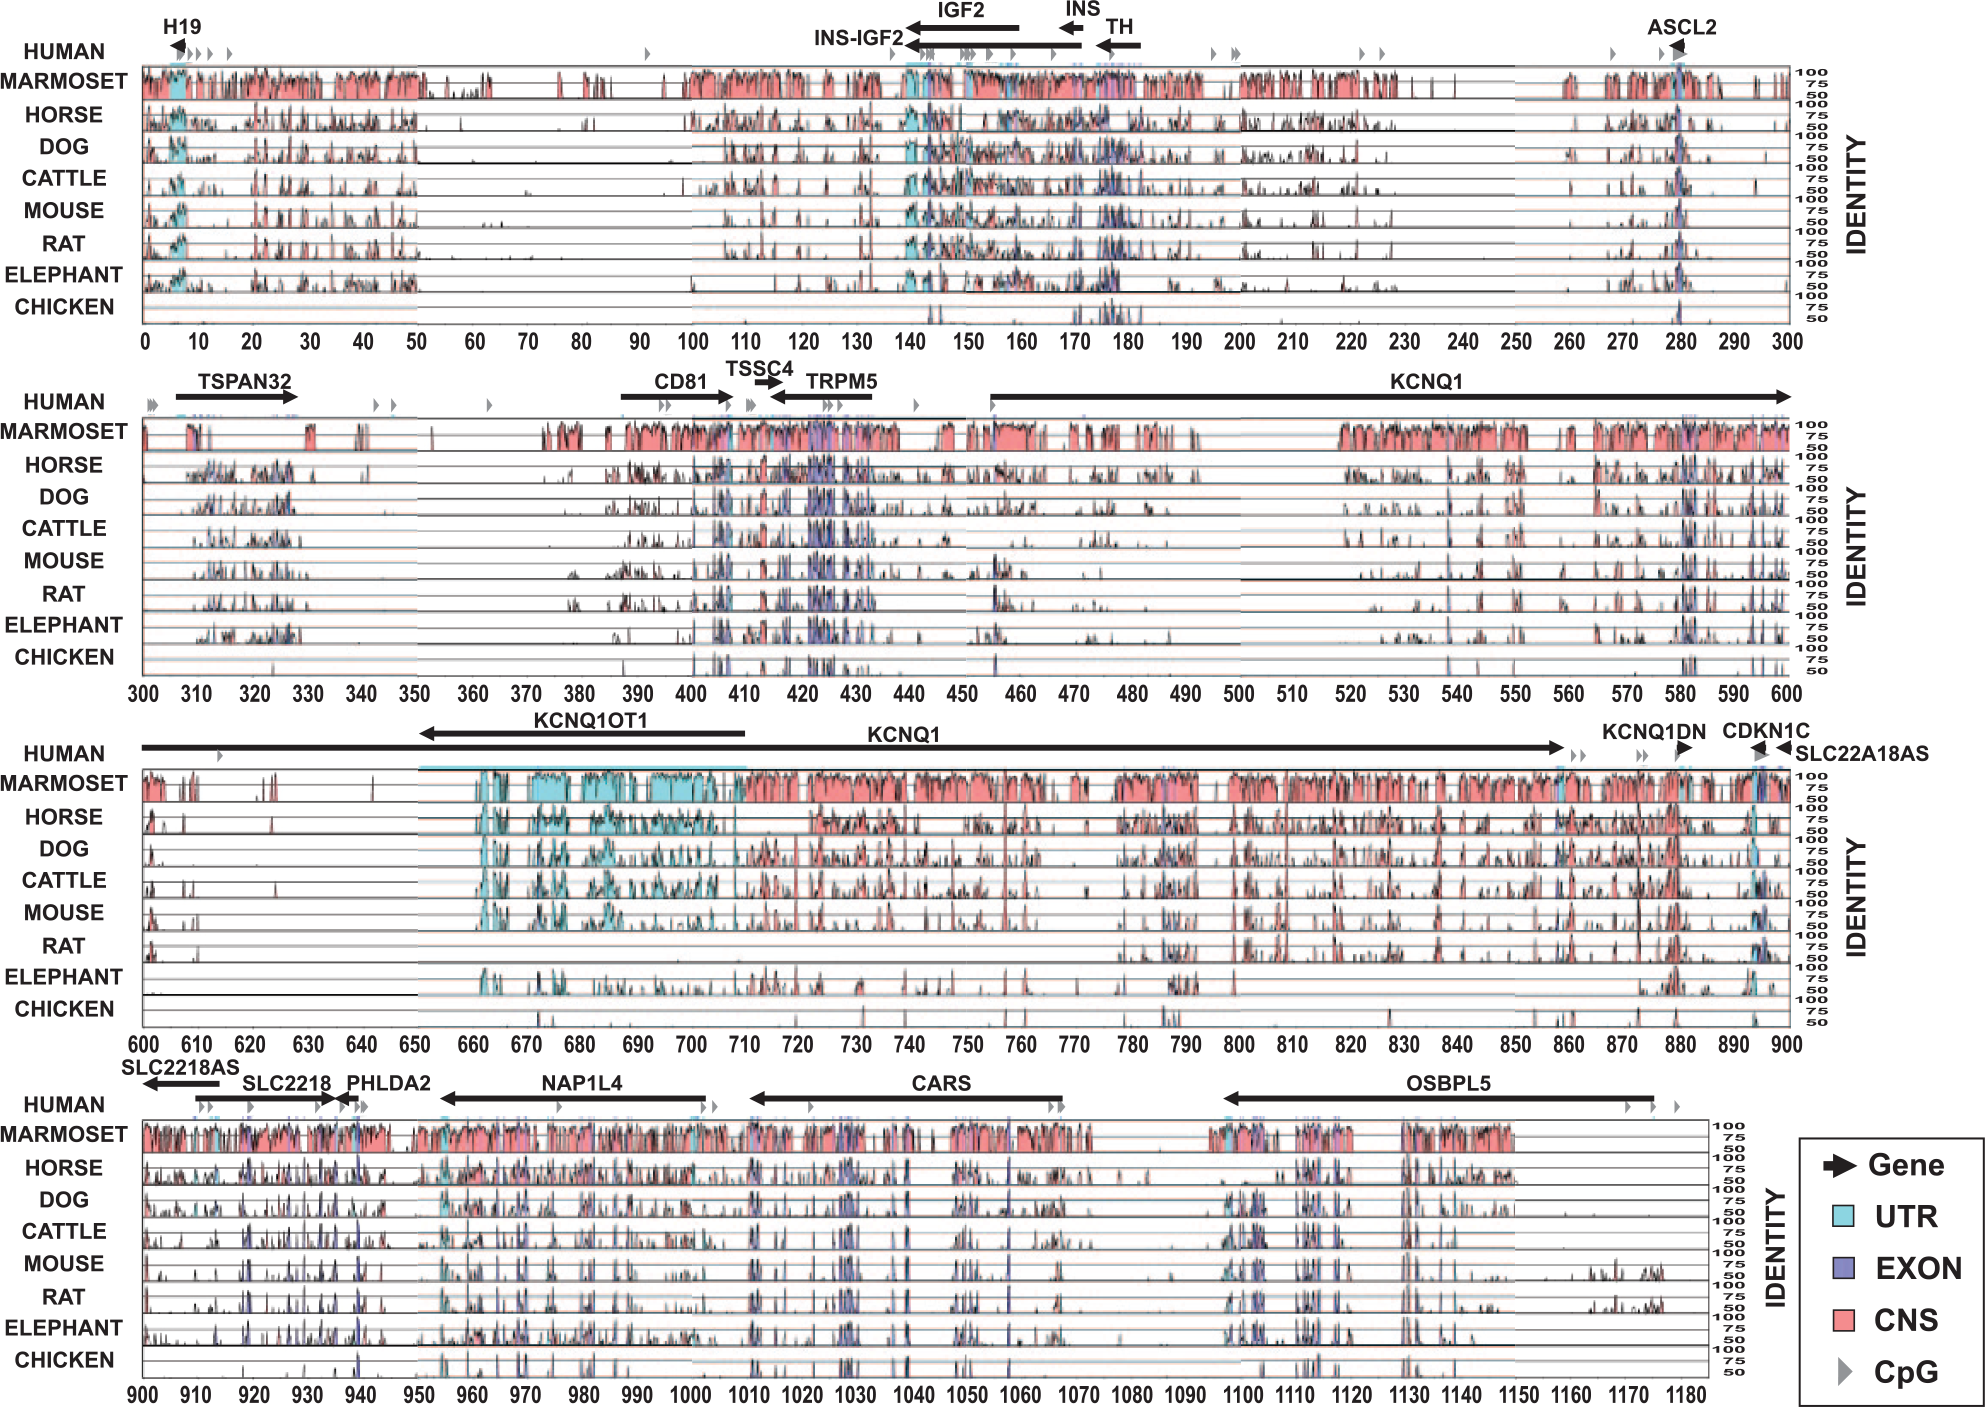
Comparison of the human DNA sequences with those of other mammals. The conserved noncoding sequences (CNS) of intergenic and intronic regions are shown in red, as well as the untranslated transcribed regions (UTR) and exons of the genes are shown in light and dark blue, respectively, whereas CpG islands are shown as gray arrowheads. The numbers in the X axis correspond to thousands of base pairs (kbp). The right Y axis to the left shows the percentage of identity to the human sequences.
By analyzing the region containing imprinted genes compared with the rest of the chromosomes, we found a higher gene density per million base pairs (Mbp) in the imprinted region in the genomes of human, mouse, cattle, and dog but not for chicken (Figure 3). A similar pattern was shown for the density of CpG islands, although, there are differences on the density among species, with mouse showing the lowest density of CpG islands and cattle showing about 6 times higher density than mouse. In addition, all mammalian regions show a lower density of repetitive elements than the rest of the chromosome. In chicken, however, there is no difference between this region and the rest of the chromosome.

Genomic features of the regions containing the genes showing genomic imprinting and the whole chromosome where those regions are located for the human, mouse, cattle, dog, and chicken genomes.
To delineate the different types of repetitive sequences, we found a significant reduction in short interspersed nuclear elements (SINEs) and long interspersed nuclear elements (LINEs) in the imprinting region among all the species, with some exceptions as shown in Figure 4. The Alu SINEs or Alu-like (shown as other SINEs) were significantly reduced in all the species. Long interspersed nuclear elements show the highest reduction in LINE2 sequences for human and mouse; the highest reduction in LINE1 was found in dog, whereas cattle showed a reduction in both LINE1 and LINE2. In human and mouse, we observed a significant reduction in the mammalian-wide interspersed repeats (MIRs) sequences, which are otherwise increased in dog.

Comparison of the proportion of each type of repetitive element found in the regions containing the genes showing genomic imprinting and the whole chromosome where those regions are located for the human, mouse, cattle, dog, and chicken genomes.
In the intergenic space between KCNQ1/KCNQ1OT1 and CDKN1C, we also found a very high conservation, including the human gene KCNQ1DN, which is not annotated in the other species. In the chicken genome, there were 11 short CNS in the introns of KCNQ1 and KCNQ1DN and in the intergenic spaces (Figure 5), both in the comparison with the unmasked and masked human sequences (related to UCNS), even though genomic imprinting has not been reported in chicken. To identify the CNS associated with repetitive elements, in the region with the highest number of CNS, located between the genes KCNQ1/KCNQ1OT1 and CDKN1C, we compared the sequences of human, cattle, and mouse, using chicken as an outgroup, with the human repetitive sequences unmasked and then masked. We identified the presence of CNS containing highly conserved repetitive elements (>70% identity), which disappeared when the human repeats were masked (Figure 5), evidencing the presence of RCNS in addition to the UCNS.

Comparison of the human DNA sequences with the sequence of cattle, mouse, and chicken, as outgroup, for the region between the genes KCNQ1OT1 and CDKN1C where the human repetitive elements have been unmasked or masked. The conserved noncoding sequences (CNS) of intergenic and intronic regions are shown in red, as well as the untranslated transcribed regions (UTR) and exons of the genes are shown in light and dark blue, respectively, whereas CpG islands are shown as gray arrowheads. The numbers in the X axis correspond to thousands of base pairs (kbp). The right Y axis to the left shows the percentage of identity to the human sequences.
We identified 16 regions of sizes between 94 and 1519 nucleotides long, containing a total of 74 CNS with identities >70%, showing different repetitive elements. In these CNS, 38 different types of repetitive elements were detected, most of them of type LINE1, such as L1M4, L1MB7, HAL1, L1M4a, and L1Med, as well as 1 LTR element: MLT1H (Table 1). The frequencies of these elements identified in the CNS were a lot higher in the imprinted region than in the whole chromosome, implying they were distributed differently, with elements mostly or only found in these CNS. Interestingly, 19 CpG islands were detected in the region, all of which were located in segments with CNS.
Repetitive elements associated to conserved noncoding sequences (CNS) from Figure 5, ordered according to the number of times present in the 16 conserved regions analyzed, showing also how many times per Mbp they are found in the imprinted region and in the whole chromosome.

The orientation refers to the sense (+) or antisense (C) direction of the repeat.
The 74 CNS identified were used to detect conserved motifs with the program MEME, being present in more than 1 CNS. Our analysis identified 13 motifs, showing probabilities of random occurrence less than 0.05 (Table 2), of which motifs 2, 9, and 13 were the most frequently found and in higher number in the CNS. There was no significant association between any pair of motifs. However, of the 74 CNS, only 40 showed the presence of these motifs (Table 3). The repetitive elements where the motifs were most frequently found were the LINE1 elements: L1M4, L1MB7, L1Med, and L1PA5. The consensus sequences of motifs 2, 9, and 13 that were used to find transcription factors binding sites using JASPAR indicated 40 different transcription factors that could recognize these motifs, revealing most of them to be associated with transcription factor families SOX, FOX, and GATA (Table 4).

Sequence logo of the nucleotides in the motifs identified by the MEME program in the CNS from the regions in Figure 5. In each motif, the Y axis shows the relative frequency of each nucleotide. The probability refers to the likelihood of identifying a motif at random in the sequences analyzed. The number of times the motif is found in all the regions and in the CNS is shown.
Human CNS containing repeats with high sequence identity where the motifs were detected.

Abbreviation: CNS, noncoding sequences.
The probability refers to the likelihood of finding at random 1 of the 13 identified motifs in the sequences analyzed and the frequency of the motifs 2, 9, and 13 which were the most frequent. The repeats found in each CNS are shown. The position of the sequences is according to the GenBank (accession number: NC_000011.10).
Transcription factor–binding sites detected by JASPAR in the main motifs identified in the noncoding sequences.

Using CNS from the region between KCNQ1OT1 and CDKN1C genes, as shown in Figure 5, we could construct phylogenetic trees showing the relationships among mammals, whose genomes have been totally sequenced. The branches in the tree reveals a very high level of support, with rodents shown to be the most related group to primates and carnivores, as well as Perissodactyla shown to be very close together and related to Cetartiodactyla (Figure 6). Elephants were shown to be the most basal group among the mammals studied and as such was used as outgroup.

Phylogenetic relationship among human, marmoset, mouse, rat, dog, horse, cattle, sheep, and elephant, using the (A, D, and G) Neighbor-Joining, (B, E, and G) Maximum Likelihood, (C, F, and I) and Bayesian methods, based on the (A, B, and C) repetitive conserved noncoding sequences (RCNS), (D, E, and F) unique conserved noncoding sequences (UCNS), and (G, H, and I) coding sequences (CDS) from the region KCNQ1OT1-CDKN1C with sequence identity >70%. The percentages of replicate trees in which the associated taxa clustered together in the bootstrap test (1000 replicates) are shown next to the branches. All trees are drawn to scale with branch lengths in the same units as those of the evolutionary distances used to infer the phylogenetic tree which are the number of base substitutions per site.
Discussion
So far, genomic imprinting has been confirmed in a little over 200 human genes (Geneimprint, www.geneimprint.com), but the total number of genes with imprinting has been estimated to be between several hundred to 2000, using whole genome search methods.32-35 Many of these genes show imprinting in a tissue-specific or stage-specific manner, 36 which makes it more difficult to detect this type of expression because the analysis should use the right tissue and stage to be able to detect this pattern. Because of this, computational methods have been used to predict genomic imprinting, based on the features of the DNA sequences, CpG islands, repetitive elements, blocks of micro RNA, and epigenetic modifications,33,35,37,38 because these features can be detected at any point in time in the DNA. However, the success rate of these methods is still low due to the lack of knowledge of all the signals and features associated with genomic imprinting, especially those defining the temporal and spatial control of imprinting expression. 39 Thus, this study attempts to further identify DNA elements associated with imprinting control in the selected region.
Here, we identify repetitive sequences located in regions highly conserved in several mammalian species. Because of its repetitive nature and the millions of years of divergence among them, we assumed that the conservation of these elements can only be associated with an important function in the control of gene expression, as previously suggested for CNS that are highly conserved. 40 Differentially methylated regions are one of the elements implicated in the control of blocks containing imprinted genes because they allow the marking of alleles to be turned on or shut down when transcription factors/enhancers do not recognize or start recognizing these sites, and these markers can be maintained for many rounds of cell division. 14 These DMRs are usually located in CpG islands that are highly conserved in human and mouse genomes,40,41 which is consistent with our findings here in those highly conserved CpG islands in the KCNQ1OT1-CDKN1C region in all the mammals analyzed.
The regions showing genomic imprinting are highly conserved in monotremata and other vertebrates, but the distribution of repetitive elements are not, and they have expanded significantly in the regions with DMRs, only in the eutherians, so it has been suggested that retrotransposition is associated with the acquisition of new DMRs that regulate genomic imprinting,42,43 but the mechanisms by which they affect it are unknown.
Repetitive elements have also been associated with regions rich in genes showing genomic imprinting, where several reports show a reduction in the number of SINEs but not a reduction in the number of LINEs,44–46 suggesting that they can attract epigenetic modifications to the DMRs nearby or protect them from being epigenetically marked in the germinal lines. 47 However, we instead found a reduction in the number of LINEs in the imprinted region. Other studies have shown that the reduction in SINEs and the increase in LINEs are not widespread features of regions with genomic imprinting. 48
One proof of the relation between repetitive elements and genomic imprinting is that some imprinted genes are of retroelement origin, such as PEG10, an essential gene for placental development which has a high similarity with the retrotransposon sushi-ichi. 49 Tandem repeats are also associated with DMRs, suggesting a role as isolators or silencers, or controlling the methylation status of nearby regions,47,50 but its low conservation suggests more of a structural role than the presence of specific motifs that can participate in expression control. 51
Even though primates and rodents are the most evolutionarily closest among the mammals analyzed, a higher proportion of shared CNS was found between human and horse, dog, and cattle. This could be related to the fact that previous studies have found that mouse repetitive elements have been amplifying at a relatively constant rate through evolution, whereas primate elements underwent a sharp peak of activity about 40 million years ago and are currently amplifying relatively slowly. 52 This could mean a higher diversification of repetitive sequences in the rodent genomes, leading to less conservation of CNS.
Hutter et al 40 compared the conservation of sequences of autosomal regions with genes showing biallelic expression, with those with imprinted expression containing more conserved repetitive elements located in both intergenic and intronic regions. However, they did not find differences in the number of LINE1 elements being conserved, differing with our results where we saw a reduction in the LINE1 and LINE2 elements in the imprinted region. Khatib and Kim 53 also found a reduction in LINE1 elements in the genes with genomic imprinting they analyzed, although Paço et al 54 did find an increase in these elements in the genes with genomic imprinting. It appears that the relationship between repetitive elements and imprinting regions is more complex and region specific and could be more related to the presence of specific repeats for specific regions acquiring functions in these regions just by chance.
We detected binding sites for 3 main transcription factor families in the motifs identified: SOX, FOX, and GATA. The 20 members of the SOX family (sex-determining region Y boxes) are transcriptional regulators, containing the high-mobility group domain that binds to DNA and have been divided into 8 groups. 55 The proteins from the same group share biochemical properties and have redundant and synergistic functions, but those from different groups have different functions as development regulators, going from sex determination, hematopoiesis, neural crest development, and neurogenesis. 56 SOX and OCT motifs have been shown to coincide with the ICR in the H19/IGF2 region, allowing the active demethylation of this element in the maternal allele in mouse.57–59 However, these motifs were not associated with demethylation of DNA during the erasure of epigenetic marks in primordial germinal cells in paternal alleles. Their role is likely to be associated more with the maintenance of the demethylated status of the maternal alleles in the embryo postimplantation. 59 It is likely that the SOX sites identified in our study are involved in the maintenance of the demethylated status of the DMRs to regulate the expression of the maternal alleles in the genes with this type of imprinting pattern.
The forkhead box (FOX) proteins constitute a family of evolutionarily conserved transcription factors with functions not only during development but also during the adult functions. 60 There are about 100 proteins in the family divided in groups designated from FOXA through FOXS, with high affinity to a very similar core sequences, but with differences in the surrounding sequences for each group, providing them different functions in development, cell proliferation, and differentiation; stress resistance; apoptosis; metabolism; and reproduction. 61 The GATA transcription factors are also highly conserved, along with the dedicated cofactors named friends of GATA controlling differentiation and cell fate of multiple cell types from Drosophila to human. 62 Due to the different functions of these transcription factors in the cell, it is possible that some are associated with mechanism of control of allele-specific expression or to the temporal or tissue-specific pattern of expression in this region. However, it is necessary to conduct experimental essays to prove whether these DNA motifs are recognized and bound by these transcription factors.
In conclusion, we show that comparative genomics can be used to identify functional DNA elements related to the regulation of gene expression in the specific regions. The approach of comparing the sequence alignment between species with and without masking the repetitive elements can be used to identify conserved repetitive elements in a large region. The identified elements may be playing important roles in the control of imprinting, as the search continues to better understand the whole process.
Footnotes
Peer Review:
Four peer reviewers contributed to the peer review report. Reviewers’ reports totaled 1085 words, excluding any confidential comments to the academic editor.
Funding:
The author(s) disclosed receipt of the following financial support for the research, authorship, and/or publication of this article: This work was supported by College of Agriculture and Life Sciences, Cornell University, Ithaca, NY and Pfizer Animal Health, Inc. (now Zoetis, Inc.). Additional support was provided by National Research Initiative Competitive Grant Program (grant no. 2006-35205-16864) from the USDA National Institute of Food and Agriculture, USDA-NIFA Research Agreements (nos. 2009-65205-05635, 2010-34444-20729), and USDA Federal formula Hatch funds appropriated to the Cornell University Agricultural Experiment Station. Visiting fellowships were awarded to T.H. by the Higher Education Commission of Pakistan.
Declaration of Conflicting Interests:
The author(s) declared no potential conflicts of interest with respect to the research, authorship, and/or publication of this article.
Author Contributions
MDD, SOP, IGI and BNT conceived the project; MDD, TH, HR, SOP and IGI designed and carried out the experiments; MDD, SOP, IGI and BNT analyzed the data; TH, HR and SOP contributed to the scientific content; MDD, IGI and BNT wrote the manuscript. All authors read and approved the final manuscript.