
Abstract
MicroRNAs (miRNAs) are a class of non-coding RNAs that act as regulators of disease. An evolutionary approach to the disease could reveal factors such as diagnosis, treatment, and prognosis prediction. The expression patterns of transposable element (TEs)-derived miRNAs could help elucidate diseases, and their evolutionary patterns are also valuable. The 34 miRNAs were compared in terms of stage survival and tumor status in 33 carcinomas from TCGA. Expression levels were compared using a t-test and presented as differentially expressed miRNAs (DEMs). For DEMs showing statistically specific expression patterns for 3 conditions (normal and cancer, early and advanced stage, and survival), interactions with related genes in 10 species, including humans, were compared. The enrichment term was discovered for the gene-miRNA interactions. In 18 out of the 33 carcinomas, at least one miRNA was retrieved with P < .05 and |fold change| >.05. A total of 128 DEMs for the 9 miRNAs were identified. Based on the TargetScan database, interactions between miRNAs and genes in 10 species, including humans, were confirmed. The evolutionarily conserved miR-130a was observed in all 10 species, whereas miR-151a was only observed in humans. GO terms of related genes were selected for the miRNAs commonly found in each species. Evolutionary analysis of TE-derived disease-associated miRNAs was performed, and the evolutionarily conserved miR-130a-related carcinomas included renal and thyroid cancers. Human and rhesus monkey-specific miR-625 is associated with various carcinomas.
Introduction
MicroRNAs (miRNAs) are functional RNA consisting of short non-coding RNA (approximately 22 nucleotides). miRNAs are known to inhibit gene expression by inhibiting translation or inducing target mRNA degradation. Some miRNAs are involved in several diseases, and their abnormal expression patterns induce carcinogenesis. Due to the complex signatures of miRNA genes of short size, their evolution is more dynamic than that of protein-coding genes. 1 miRNAs have shown tissue- and disease-specific expression patterns in the body. From an evolutionary point of view, the generation and expression of miRNAs related to diseases helps reveal the causes of diseases.
In the 1940s, mobile elements were first discovered in maize. 2 It is now known that as the human genome evolved, DNA sequences could mobilize and insert themselves (or a copy) into new genomic positions, and DNA sequences accumulated. 3 These repeated DNA sequences comprise approximately 45% of the genome. 4 A close relationship has been reported between the presence of repeated DNA elements in the genome and miRNA sources.5,6 From the 3116 miRNAs GENCODE v19, 1900 human miRNAs originate from retrotransposons in both sense and antisense orientations. 7 Transposable elements (TEs) are an important source of miRNAs owing to their palindromic sequences. Some miRNAs were generated by TE insertion during evolution via other mechanisms. After miRNAs are created, many TE sequences disappear during evolution. Therefore, only some miRNA sequences match TE. This suggests that more miRNAs may have originated from TE. 8 In the human genome, miR-28, miR-95, and miR-151 originate from LINE-2, and miR-345, miR-575, and miR-607 originate from MIR. Additionally, the miR-548 family was generated from Made1.7,9
miRNAs originating from TEs reportedly play important roles in cancer development. 10 Among these, miR-625 contributes to cancer development by regulating GATAD2B together with NF-kB. 11 miR-130a expression is increased in non-small cell lung cancer (NSCLC) tissues. 12 A previous study reported aberrant expression of miR-130a in renal cell carcinoma (RCC) cells. 13 In Xenopus laevis, miR-130a is expressed in anterior neural tissues like the brain, the eyes, and the branchial arches, and down-regulation of miR-130a led to smaller eye size.14,15 miR-625 is significantly downregulated in colorectal cancer (CRC) tissues and cell lines. Ectopic miR-625 expression inhibits the invasion and migration of HCT116 CRC cells in vitro and in vivo. 16 A set of 4 human miRNAs (miR-28, miR-185, miR-27, and let-7f-2) was found significantly upregulated in RCC (P-value <.05) compared to normal kidney samples. 17
Here, we present disease-related miRNAs derived from TEs and describe their evolutionary patterns. A specific expression pattern for each cancer type could help select miRNA-related animal models. Additionally, it is possible to identify factors such as cancer-related diagnosis, treatment, and prognosis prediction.
Methods
Data acquisition and selection of target diseases related to TE-derived miRNAs
We used TCGA 33 carcinoma dataset as the source. Thirty-four related TE-derived 34 miRNAs were selected from a previous study. 10 This study aimed to determine the expression patterns of 34 miRNAs in 33 carcinomas and perform evolutionary analysis (Figure 1). The 33 omics and clinical data of this study were downloaded from the Cancer Genome Atlas (TCGA) dataset. Downloads and data processing were performed using the “GDCquery” function of the R package “TCGAbiolinks.” All analyses were performed using R package version 4.1.1. This study was approved by the Institutional Review Board (IRB) of Korea University (Approval No.: KUIRB-2020-0191-01) and was performed in accordance with the Declaration of Helsinki.

Flowchart of this study. The expression level of TEs-related miRNA by cancer type was confirmed based on small RNA-seq patient information through 33 cancer types of TCGA. The expression pattern confirmed the stage of cancer, cell survival, and the expression level between normal and cancer tissues. A total of 33 disease-related TE-derived microRNAs (excluded has-miR-546b) were analyzed. Differentially expressed miRNAs (DEMs) were compared and analyzed by distinguishing them into early states (stage 1, stage 2) and high states (stage 3, stage 4) according to cancer progression. In addition, comparative analysis of carcinoma and normal tissue, and finally dead and alive samples were also comparatively analyzed.
Reference database of miRNA target gene
TargetScan, a miRNA target gene database, was used in this study. TargetScan predicts the gene targets of miRNAs and provides raw data. 18 A “Nonconserved_Site_Context_Scores.txt” file was downloaded from TargetScan, and the tab-delimited file was loaded as the “fread” function of the R package “data.table” (https://www.targetscan.org/cgi-bin/targetscan/data_download.vert72.cgi; 523.95 MB). From the “miRNA” column, the first 3 letters were used to identify species, and the remaining part was used as a key to identify miRNAs.
Identification of differentially expressed miRNAs (DEMs) in the 3 conditions (stage, survival, and compared to normal)
According to the clinical information from TCGA, DEMs were identified based on 3 conditions. All expression and clinical datasets were retrieved as data frames in R. Of the 33 carcinomas, samples that did not have clinical information were excluded. All filter options were used by the “filter” function of “dplyr” R package. We classified 18 carcinomas into early stage (stages I and II) and advanced stage (stages III and IV), and DEM were selected between early and advanced stages. Furthermore, DEMs between normal and cancerous tissues were selected when normal tissues corresponding to each carcinoma were provided. DEMs were also selected by comparing survival and death rates among patient samples. All DEMs screening conditions were P-value <.05, and |fold change| >.05 were considered miRNAs. The P-value was treated by “−log10” to visualize statistical significance in the dot plots.
Enrichment terms selection and visualization
Based on the TargetScan database, the related genes were selected for each miRNA corresponding to each species. Selected genes were entered into DAVID (https://david.ncifcrf.gov/summary.jsp), and the corresponding species were selected for enrichment terms.
Category, Term, and PValue columns were selected as the outputs, and −log10 was processed for the PValue term and arranged in descending order. This result was considered statistically significant. The top 10 terms were selected using GO and KEGG.
Visualization: Heatmap and bar plots
The matrix used in this study was loaded into the data structure of the R dataframe. A heatmap was presented for data frame visualization, and the “pheatmap” package was used for analysis. Statistical significance is indicated in each cell of the heatmaps. From DAVID analysis, statistical significance for each species was visualized as bar plots using “ggplot2” R package.
Results
DEMs distributions by carcinoma
The study was conducted as summarized in Figure 1. Of a total of 33 carcinomas, 18 carcinomas that could be classified according to 3 conditions were analyzed. In TCGA, miRNA expression analysis, comparative analysis of tumor samples, including stage and survival, and comparative analysis in normal tissues compared to tumor samples were performed. The analysis was performed on 18 carcinomas in more than 3 samples in each group (Table 1). In a previous study, 34 miRNAs known to be derived from TE and 24 related diseases were presented as heat maps (Figure 2). 10 These 34 miRNAs were found to be associated with various diseases, including cancer.
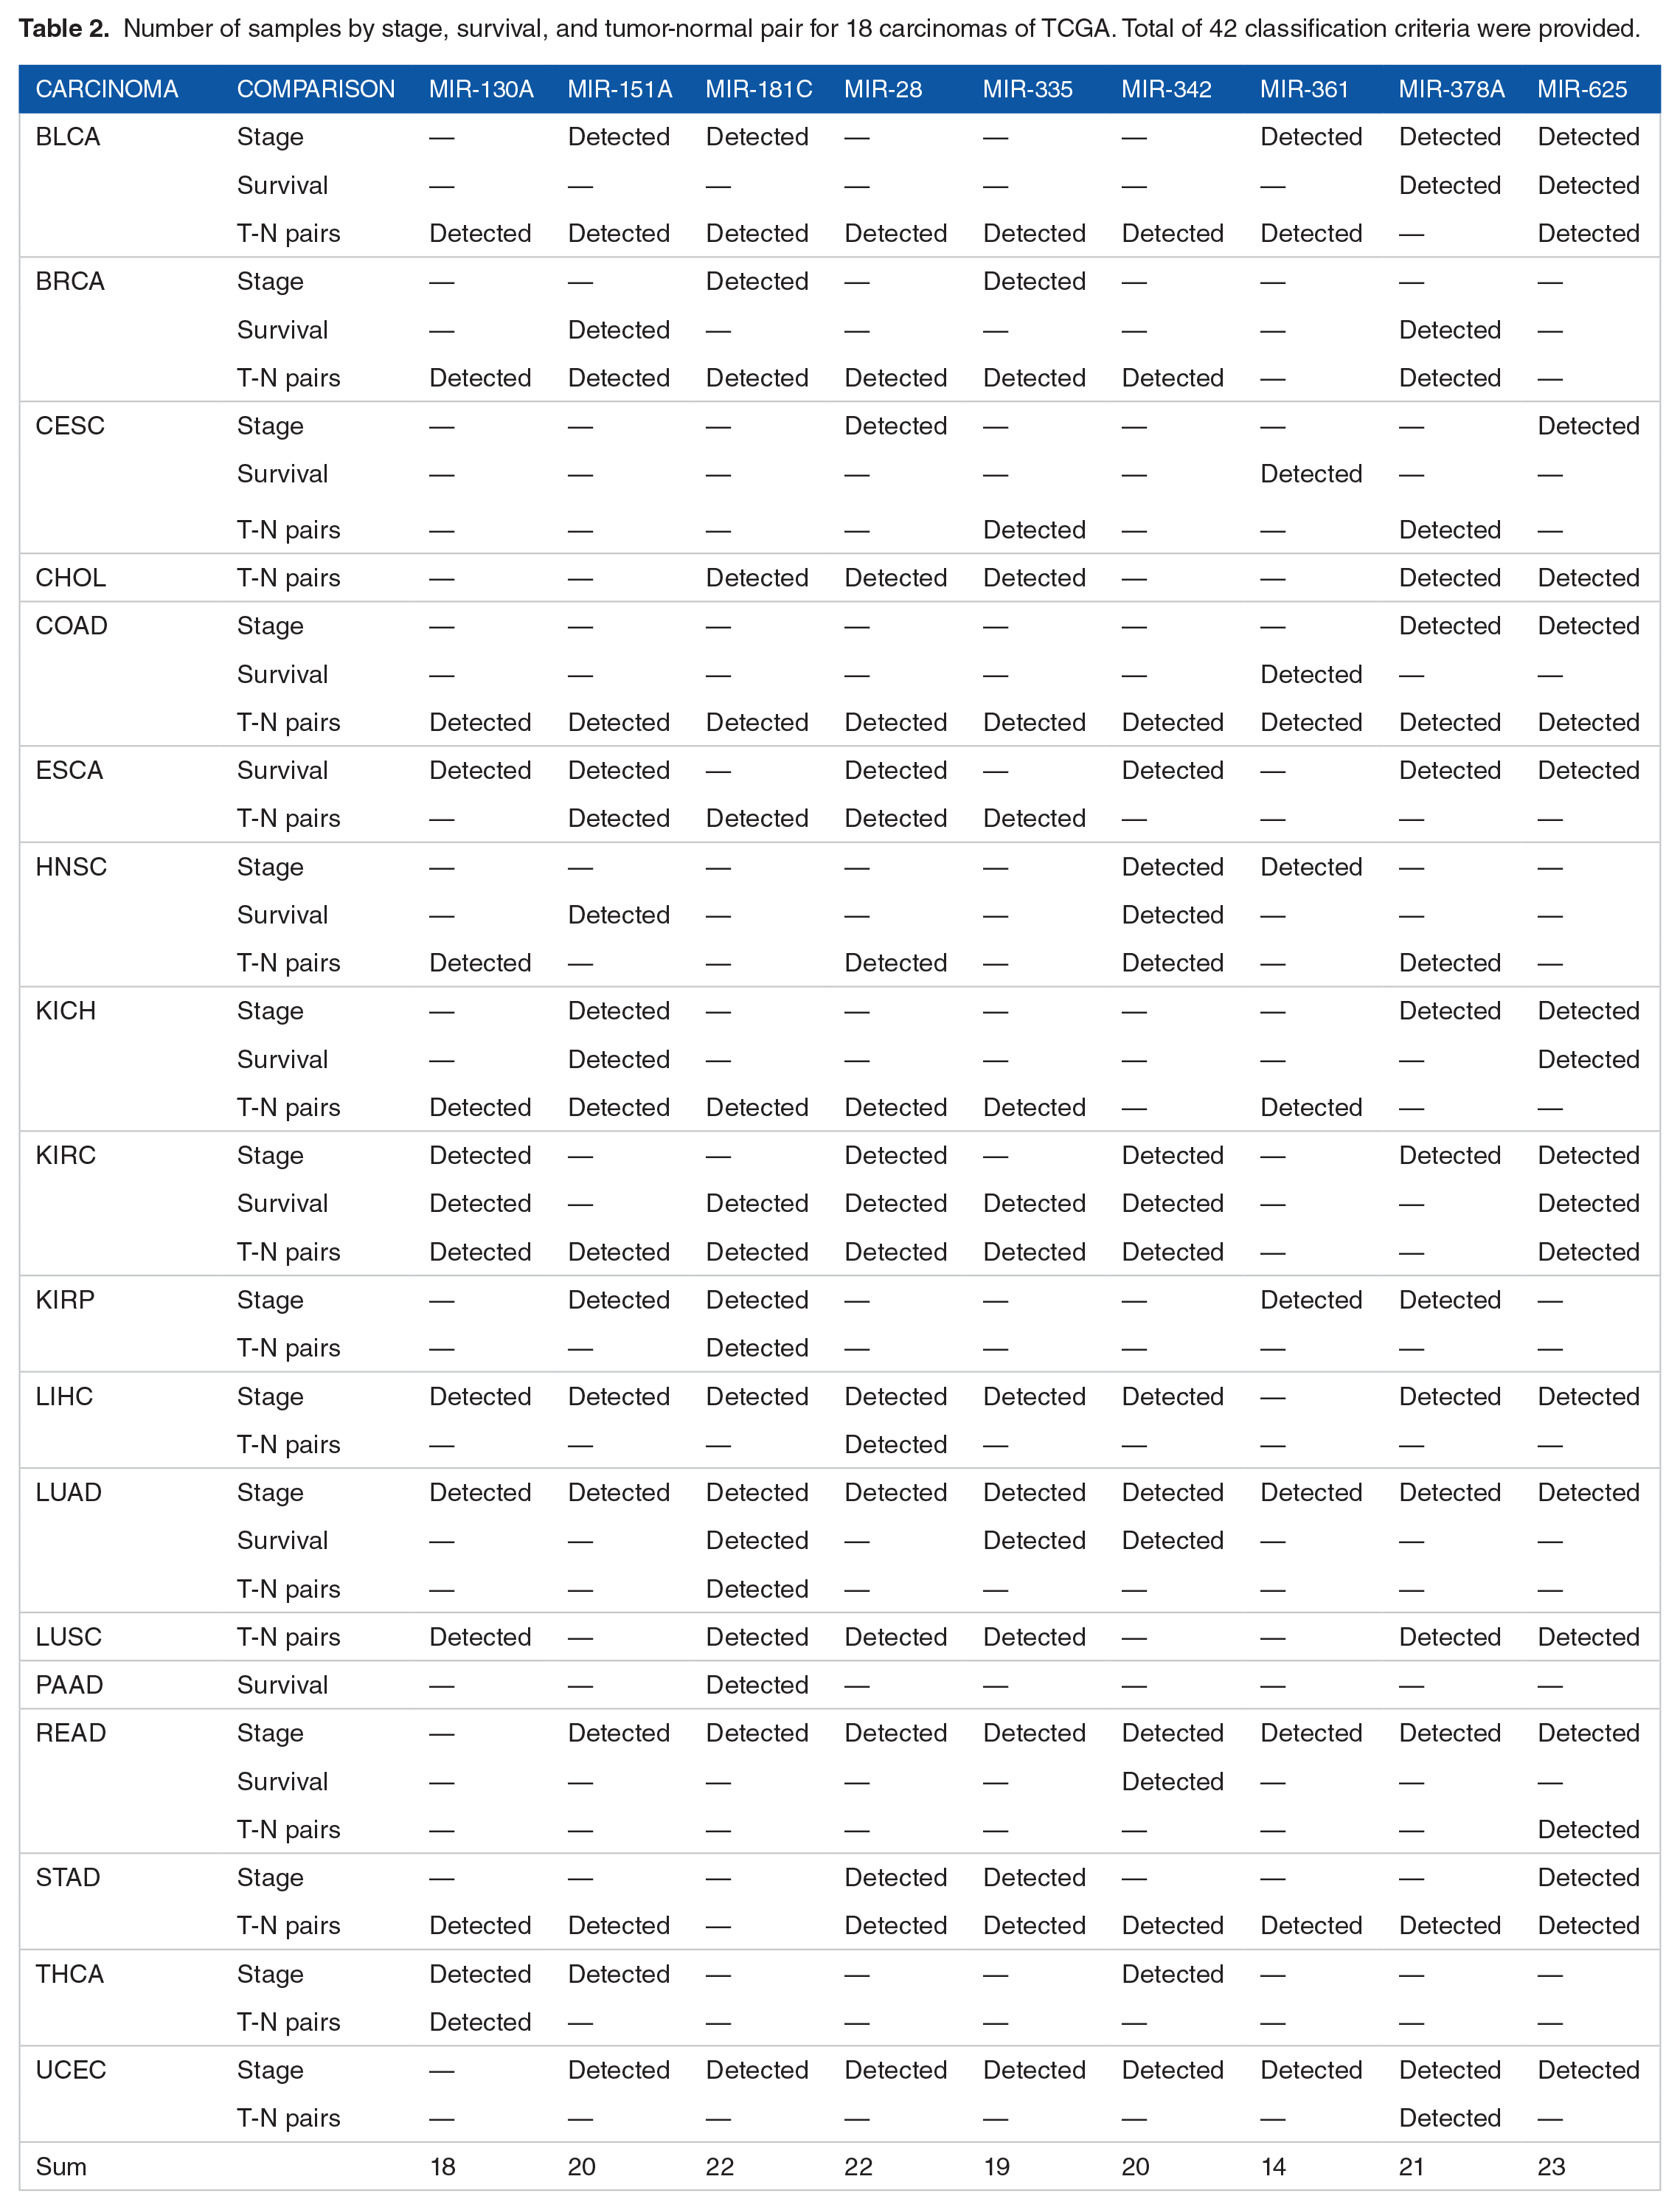
Number of samples by stage, survival, and tumor-normal pair for 18 carcinomas of TCGA.


Transposable-elements derived miRNAs and their relevance to diseases. Black cells indicate that an association between miRNA and disease has been reported. A total of 34 miRNAs and their associations with 24 diseases were illustrated on a heatmap. For each row and column, k-means clustering algorithm-based classification was performed, and the rows and columns that were close to each other were grouped.
In the DEM analysis, 9 out of 33 miRNAs were selected for stage, survival, and tumor-normal classification in at least one of the 18 carcinomas. When comparing the 2 groups, md.iRNAs satisfying P-value <.05 and |fold change| >.05 were detected for each carcinoma (Table 2). Total raw DEM results containing P-values and fold changes from 18 carcinomas according to 3 classification criteria (stages, survival, and compared to normal) were provided (Table S1). In 18 carcinomas, miRNAs capable of distinguishing a total of 42 classification criteria were identified. Among them, miR-625 satisfied 23 classification criteria. Nine miRNAs explained KIRC for the stage, survival, and tumor-normal pairs. In UCEC, only miR-378a can be used to classify tumor-normal pairs. The value for each fold-change is presented as a heatmap, and statistical significance is indicated for each cell in the heatmap (Figure 3).
Number of samples by stage, survival, and tumor-normal pair for 18 carcinomas of TCGA. Total of 42 classification criteria were provided.
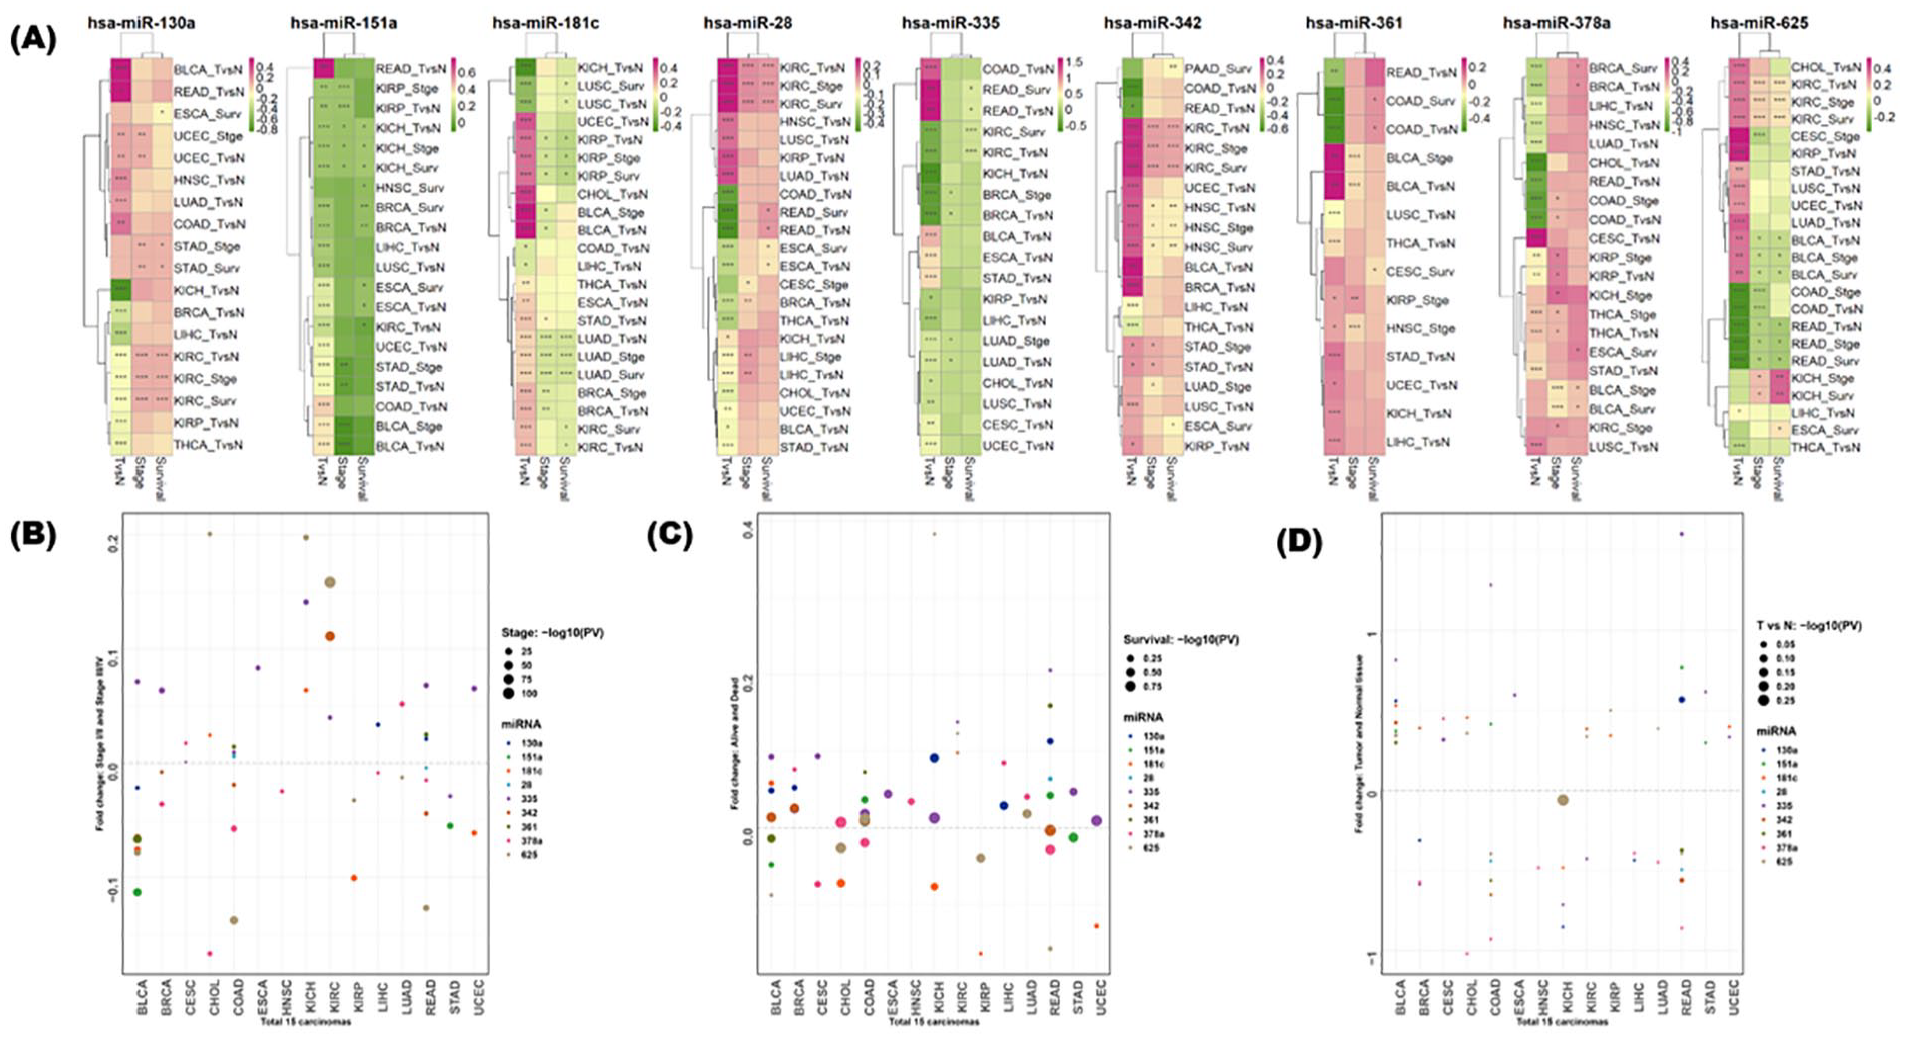
Visualization of the expression patterns according to 3 classification criteria for 9 miRNAs. Differentially expressed miRNAs (DMEs) between 3 classification criteria (stages, survival, and compared to normal) were represented as heatmaps for a total of 9 miRNAs (A). The expression of each cancer type was compared according to normal and cancer tissues, early (I, II) and advanced (III, IV) stages, and survival. Compared to normal, overexpression in tumor, high stage, and dead samples was indicated in red, otherwise in green. The degree and statistical significance of miRNAs with different expressions according to the 3 classification criteria in a total of 18 carcinomas were obtained by fold change and P-value. For each miRNA, a comparison criterion that satisfies P-value <.05 and |fold change| >.05 was selected (P-value: *<.05, **<.01, ***<.001). The 3 dot plots represent fold changes and statistical significances between early and advanced stages (B), alive and dead samples (C), and tumor samples compared to normal (D). Circle size represents statistical significance (P-value was treated by “−log10”).
Visualization and evolution analysis of miRNAs
In the case of human miR-130a, normal and carcinoma were classified well, and cancer-specific low expression was prominent in kidney-related carcinoma compared to normal tissues. However, cancer-specific overexpression has been found in endometrial cancer, head and neck cancer, lung adenocarcinoma, and colon adenocarcinoma. Interestingly, in KIRC, despite underexpression in cancer, the higher the stage, the higher is the overexpression, and the higher the overexpression, the higher the mortality rate detected in KIRC. In the case of human-specific miR-151a, cancer-specific overexpression was observed in READ. In the case of miR-28, miR-342, and miR-625, cancer-specific overexpression, as well as advanced stages, was associated with poor prognosis. In the case of miR-625, cancer-specific overexpression was observed in most carcinomas, while cancer-specific underexpression was observed in COAD and READ (Figure 3A). Three dot plots were depicted according to 3 classification criteria (stages, survival, and compared to normal) to provide fold changes and statistical significances between the 2 conditions (Figure 3B-D).
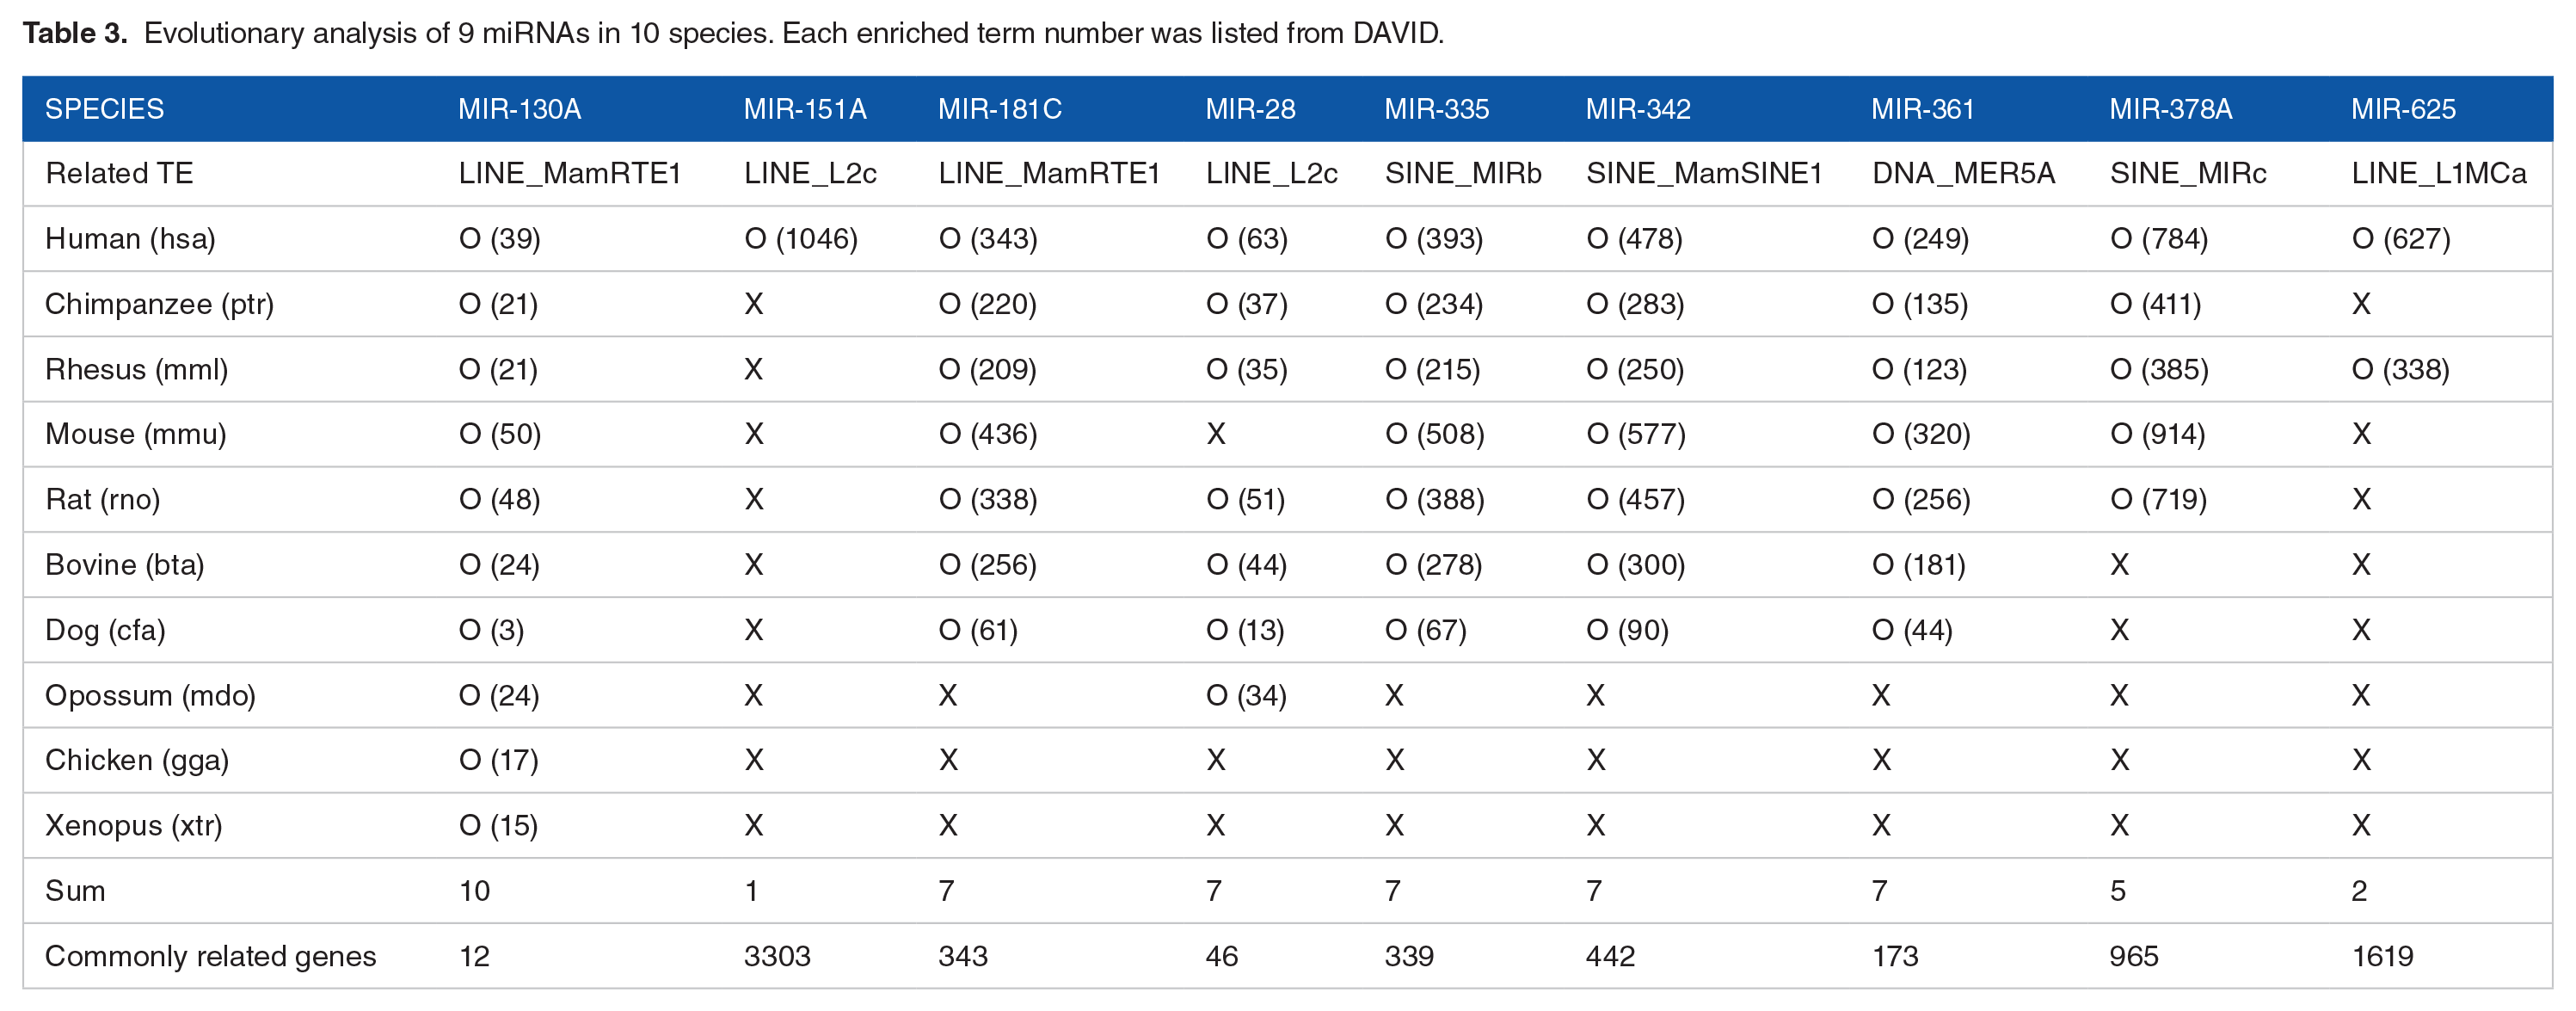
The UCSC Genome Browser-based phylogenetic tree for 10 species provided by TargetScan is presented in Figure 4. A heatmap according to miRNAs corresponding to each species, their TE origin, and enriched term number is shown on the right side of the phylogenetic tree. Six species are placental mammals, of which 3 are primates. All 9 species were vertebrates. miR-130a was found in all 9 species, while miR-151a was only found in humans (Table 3). As a result of the evolutionary analysis, the number of TEs associated with 9 miRNAs and the number of genes associated with 10 species is presented in Table 3. Related TEs were listed and obtained from the repeatmasker analysis results overlapping with miRNA in the UCSC Genome Browser. Of the 9 miRNAs, except for miR-130a, only miRNAs were found in placental mammals. miR-28 was found in the opossum but not in mice. miR-378a was found in primates, mice, and rats, while miR-625 was found only in humans and rhesus monkeys. The TE family associated with each miRNA is presented, and there is no distinct pattern between evolutionary singularity and TE classification.

Phylogenetic tree of 10 species from UCSC Genome Browser. The number of enriched terms in all 10 species is presented as a heatmap. TE classes for 9 miRNAs are represented in the column annotation bar.
Evolutionary analysis of 9 miRNAs in 10 species. Each enriched term number was listed from DAVID.
Functional annotation of genes related to DEMs
Genes related to these were selected using TargetScan, and related terms were discovered using DAVID for each of the 10 species. The statistical significance of the terms related to GO and KEGG was visualized (Figure 5). GO and KEGG terms were sorted in ascending order of P-values, and the top 10 terms were selected.
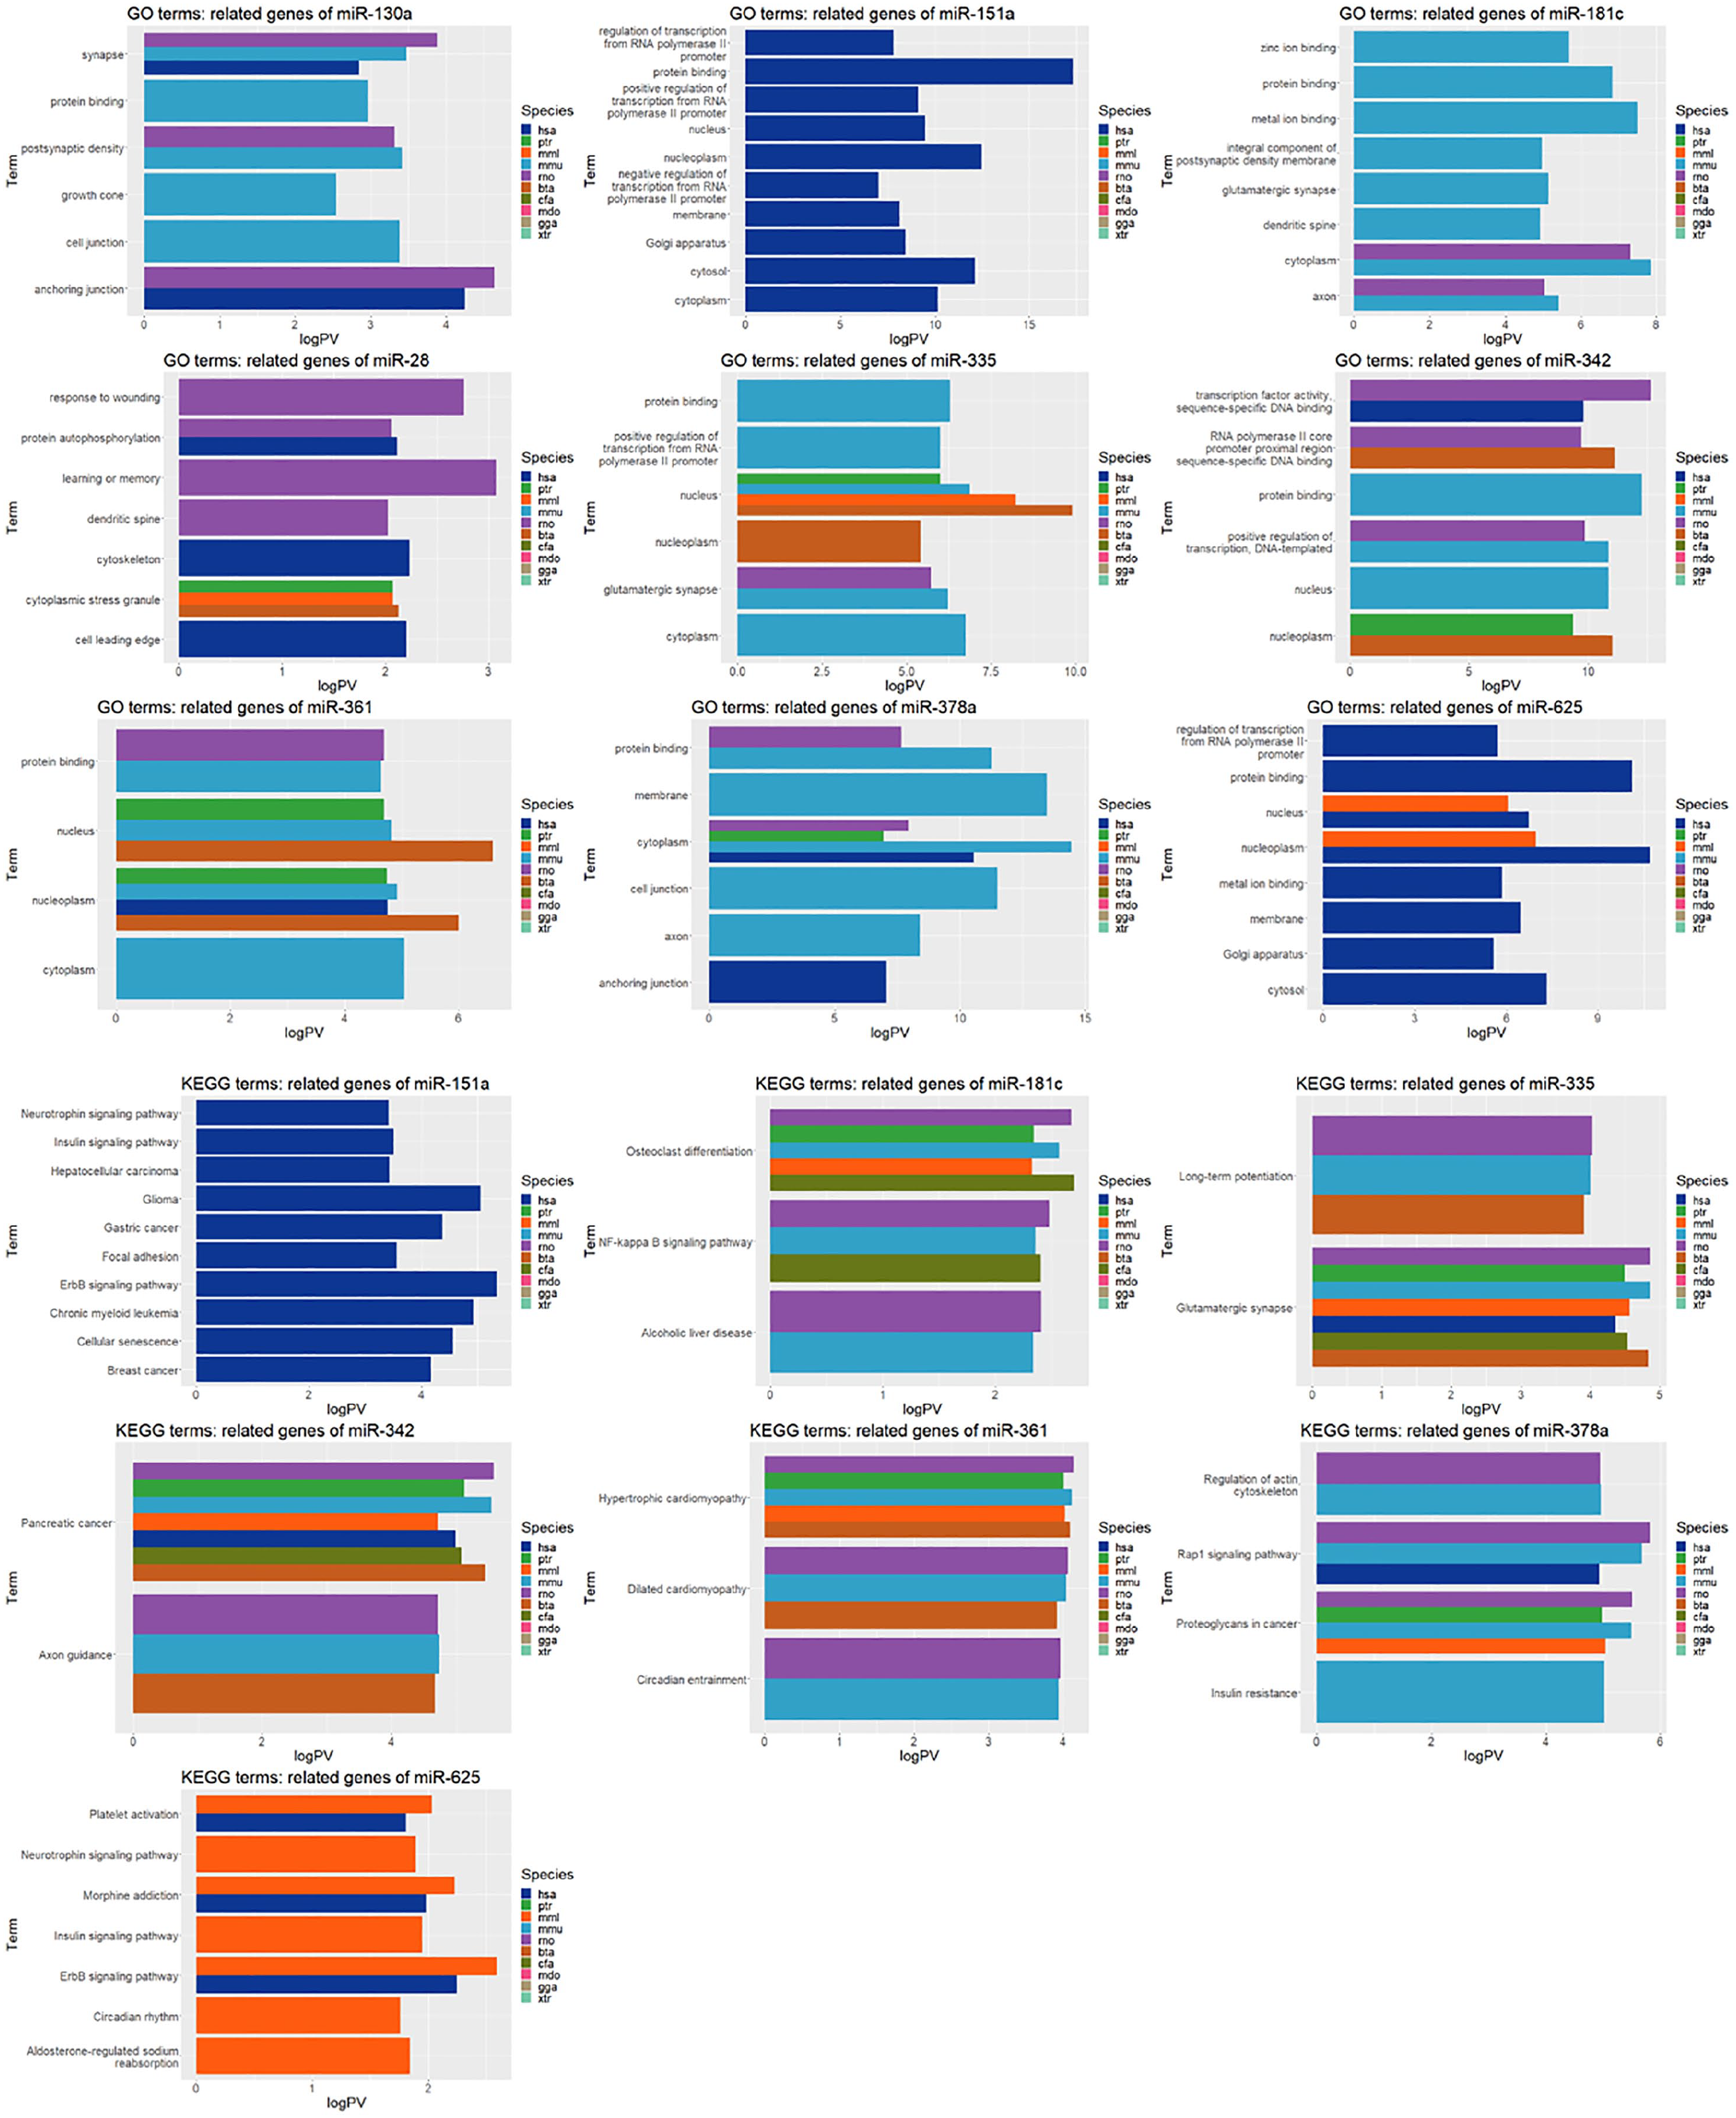
GO and KEGG terms of 9 miRNA-related genes according to 10 species. In DAVID, enrichment terms were selected for each gene, and GO terms satisfying P-value <.05 were selected.
In the GO term analysis, most of the genes related to miRNAs were found to be statistically significant in mice and rats. In the case of miR-130a, the top 10 terms were selected from humans, mice, and rats among the 10 species. Among them, the synapse term was included in all 3 species. The genes related to miR-335 were also related to the mouse in 5 of the top 10 GO terms, and the nucleus term showed high significance in 4 species (ptr, mmu, mml, and bta). Among the 6 terms, miR-378a also showed high significance in the cytoplasm of the 4 species (rno, ptr, mmu, and hsa).
Through a statistical significance analysis of the top 10 KEGG terms, it was confirmed that the same term was shared among various species. Among the genes related to miR-181c, 5 species showed high significance in osteoclast differentiation. Genes related to miR-335 were related to glutamatergic synapses in 7 types, and genes related to miR-342 were also shown to be related to pancreatic cancer in 7 types. This is consistent with the results of previous studies suggesting that miR-342, as shown in Figure 2, is associated with pancreatic cancer. Furthermore, hypertrophic cardiomyopathy was confirmed in a total of 5 types of genes related to miR-361.
Discussion
When selecting a model animal for a disease, it is necessary to select a species related to the pharmacokinetics and physiological function of the model animal, which includes genes evolutionarily associated with each disease. 19 Many animals respond similarly to humans from pharmacokinetic and physiological points of view; however, there are significant differences between species. Determining the intrinsic and extrinsic factors associated with diseases and creating biological tools to compare animal models and human disease processes would be valuable tools to aid in selecting appropriate animal models. To study the diseases related to miR-130a presented in this study, various animal models (mouse, rat, or Xenopus) may be used. However, to study human-specific miRNA-related diseases, such as miR-151a, it would be better to use human-derived cell lines or organoids compared to animal models. 20 The completion of human and chimpanzee genome sequencing has opened the possibility to speculate that human-specific genes and other regulatory elements in the human genome,4,21 such as microRNAs and non-coding RNAs, can contribute to various human pathogeneses.22,23 Therefore, these human-specific genes and non-coding regulatory elements support the concept that miRNA-related diseases can be studied.
Among the 9 miRNAs selected in this study, different expression patterns of 3 comparisons were confirmed in 18 carcinomas (comparisons of normal and tumor, early and advanced stage, and survival). In the 2 miRNAs with different evolutionary conservation (miR-130a and miR-151a), opposite expression patterns were observed when compared by cancer type (Figure 3). miR-130a is well-conserved, and higher expression patterns were detected in 18 comparisons. miR-151a was detected only in humans, and lower expression patterns were detected in 20 comparisons.
Similar expression patterns were found in 3 datasets associated with renal cancer (KICH, KIRC, and KIRP). For miR-130a, -28, -342, -361, -378a, and -625, an overexpression pattern was observed with a poor prognosis. In miR-151a, -181c, and -335, lower expression patterns were associated with a poor prognosis. miR-625 is derived from LINE_L1MCa and has been observed in humans and rhesus monkeys. In both datasets related to colorectal cancer (COAD and READ), a strong lower expression pattern was found in the poor prognosis group (Figure 3). There was no difference in miRNA expression patterns in specific carcinomas related to TE originality and evolutionary conservation; however, different expression patterns related to prognosis were observed depending on the carcinoma type.
Genes related to the miRNAs were extracted using TargetScan. Genes related to miRNAs for each of the 10 species were searched using DAVID, and related terms were extracted from GO and KEGG. In the case of miR-342, it was confirmed that it is related to pancreatic cancer. 24 In our analysis, the same result was derived for 7 species (Figure 5). miR-342 is found in placental mammals and in mice and rats, which are used as model animals. 25 The association of miR-378a with bladder carcinoma and leukemia has been studied26,27; however, there are no critical studies related to proteoglycans in cancer among KEGG terms. The term based on the species related to the miRNA presented in this study will help analyze the miRNA function according to the model animal and species, targeting a total of 10 species.
miRNAs participate in specific functional pathways and participate in the function of biological cancer cells, and our study provided enrichment terms of miRNA-related genes. The study of miRNAs plays a vital role in understanding the mechanisms underlying biological processes in cancer.
Supplemental Material
sj-xlsx-1-evb-10.1177_11769343231194020 – Supplemental material for Transposable Elements-Derived MicroRNA Expression Patterns in TCGA Dataset for 10 Species
Supplemental material, sj-xlsx-1-evb-10.1177_11769343231194020 for Transposable Elements-Derived MicroRNA Expression Patterns in TCGA Dataset for 10 Species by Chan-Mi Lee, Sang Woo Jin, Byunghyun Jang, Young Kyung Ko and Jeong-An Gim in Evolutionary Bioinformatics
Footnotes
Author Contributions
C-ML, SWJ, and BJ: Data analysis and writing and editing—original draft. YKK: investigation and data curation. J-AG: Conceptualization, design, methodology, supervision, and funding acquisition. All authors have read and approved the final manuscript.
Funding:
The author(s) disclosed receipt of the following financial support for the research, authorship, and/or publication of this article: This research was funded by the Basic Science Research Program through the National Research Foundation (NRF), funded by the Ministry of Education (grant number NRF-2020R1I1A1A01052701 & RS-2023-00246906).
Declaration of Conflicting Interests:
The author(s) declared the following potential conflicts of interest with respect to the research, authorship, and/or publication of this article: This research presented the results of a study conducted as part of the “Introduction to Evolutionary Medicine” class at Korea University School of Medicine, where J-AG is the professor in charge and C-ML, SWJ, and BJ are students.
Supplemental Material
Supplemental material for this article is available online.
References
Supplementary Material
Please find the following supplemental material available below.
For Open Access articles published under a Creative Commons License, all supplemental material carries the same license as the article it is associated with.
For non-Open Access articles published, all supplemental material carries a non-exclusive license, and permission requests for re-use of supplemental material or any part of supplemental material shall be sent directly to the copyright owner as specified in the copyright notice associated with the article.