Multiclass classification and feature (variable) selections are commonly encountered in many biological and medical applications. However, extending binary classification approaches to multiclass problems is not trivial. Instance-based methods such as the K nearest neighbor (KNN) can naturally extend to multiclass problems and usually perform well with unbalanced data, but suffer from the curse of dimensionality. Their performance is degraded when applied to high dimensional data. On the other hand, model-based methods such as logistic regression require the decomposition of the multiclass problem into several binary problems with one-vs.-one or one-vs.-rest schemes. Even though they can be applied to high dimensional data with L1 or Lp penalized methods, such approaches can only select independent features and the features selected with different binary problems are usually different. They also produce unbalanced classification problems with one vs. the rest scheme even if the original multiclass problem is balanced.
By combining instance-based and model-based learning, we propose an efficient learning method with integrated KNN and constrained logistic regression (KNNLog) for simultaneous multiclass classification and feature selection. Our proposed method simultaneously minimizes the intra-class distance and maximizes the interclass distance with fewer estimated parameters. It is very efficient for problems with small sample size and unbalanced classes, a case common in many real applications. In addition, our model-based feature selection methods can identify highly correlated features simultaneously avoiding the multiplicity problem due to multiple tests. The proposed method is evaluated with simulation and real data including one unbalanced microRNA dataset for leukemia and one multi-class metagenomic dataset from the Human Microbiome Project (HMP). It performs well with limited computational experiments.
Multi-class classification and feature selections are commonly encountered in many biological and medical applications, especially in genomic and metagenomic studies. Those data usually have high-dimensions, small-sample size, and unbalanced classes, and features (genes) may be highly correlated. It is not trivial to detect disease associated genes and evaluate the predictive powers under the multi-class classification framework, Machine learning for multiclass (and more general multilabel) classification has received increasing attention in many areas.1–4 In current literature, all machine learning methods roughly fall into two different categories: instance-based and model-based learning. Instance-based learning (IBL) such as the k-nearest neighbor (KNN)5 predicts the class of a sample with unknown class by considering the classes of k-nearest neighbors. It is more robust for data with unbalanced classes and is efficient for multiclass classification with a small number of features. However, its predictive accuracy is seriously degraded when there is a large number of irrelevant features because of the curse of dimensionality. On the other hand, model-based learning methods such as support vector machine (SVM) and logistic regression are mainly designed for binary classification. They are designed to separate two different classes as far as possible without considering the intra-class distances. Multi-class problems are often dealt by combining binary classifier outputs, such as one class against the other (one vs. one) or one class against the rest (one vs. rest). However, this may lead to over-fitting and poor predictive accuracy especially when sample size is small, since we need to estimate either c(c - 1)n/2 or (c - 1)n parameters for problems with c classes and n features. It also produces unbalanced classification problems with one vs. the rest rule even if the original multiclass problem is balanced.
Instance-based leaning only takes into account the minimal distance, while model-based learning incorporates maximizing the interclass distances (eg, maximizing the margin in SVM). It is natural to integrate the instance-based and model-based methods and maximize the interclass distances while minimizing the intraclass distances. While there are some efforts in this direction,6 they only consider the labels of neighborhood instances as additional features for logistic regression. They do not fully take advantage of the robustness of instance-based learning for unbalanced classes and continue to have the same drawbacks of estimating too many parameters and creating unbalanced classes in multi-class classifications, even if the original problem is balanced.
A fundamental aspect of feature (variable) selection for high dimensional data is to derive interpretable results. Earlier approaches for feature selection7–9 were based on filtering to select a subset of features, independent of the statistical learning methods. However, filtering methods, which examine each feature in isolation and ignore the possibility that groups of features, may have a combined effect that does not necessarily follow from the individual performance of features in the group.10 In addition, they result in multiplicity problems due to multiple comparisons. The more recent L1 and Lp based penalized statistical learning approaches perform variable selection as part of the statistical learning procedure.11–16 However, they are mainly designed for binary classification and can only select independent features. However, highly correlated features may function together and it is very important to select highly correlated genes in biological research.
There are two difficulties when dealing with multiclass problems with high dimensional data: small sample size and unbalanced classes. In this paper, we propose a novel approach through integrating instance-based and model-based learning to overcome both difficulties encountered in multiclass classification with high dimensional data. Our proposed approach combines the k-nearest neighbor (KNN) and a model-based binary classifier and simultaneously maximizes the interclass distance and minimizes the intraclass distance. It is robust for unbalanced classification and can classify multiclasses simultaneously without creating unbalanced classes. It also estimates a fewer number of parameters (only the same as the number of features) and can simultaneously select features and predict multiclasses with simple parameter regulation. Moreover, the proposed method can identify highly correlated features for multiclass classification and overcome both the problem of multiplicity with statistical tests and the problem of failing to identify correlated features with L1 and Lp penalized statistical learning methods. We evaluate the performance of our proposed method through simulation and the publicly available microRNA expression and metagenomic data sets. The proposed method is robust across data-sets and efficient for feature identification and pheno-type prediction.
Methods
A general multiclass classification problem may be simply described as follows. Given n samples, with normalized features, D = {(x1, y1), …, (xn, yn)}, where xi is a multidimensional feature vector with dimension m and g classes with class label yi∈ C = {c1, …, cg}, find a classifier f(x) such that for any normalized feature vector x with class label y, f(x) predicts class y. Given two samples xi. and xj, we introduce a general weighted distance functions for KNN learning as follows:
where |.| denotes the absolute value, wk ≥ 0 for k = 1, …, m are the nonnegative weights, and p is a positive free parameter. Especially when p = 1 and p = 2, D(w, xi, xj, 1) and D(w, xi, xj, 2) represent the weighted city-block and Euclidean distance between xi and xj respectively. Given a new sample xl, we the calculate k nearest neighbor of xl denoted by Nk(xi, cs) for each class cs, and then take the average distance
as the distance of xl to class cs. Finally, we assign xl to class cj by means of a minimal distance vote:
Loglikelihood Based Approach for Weight Estimation (KNNLog)
Now, the goal is to choose optimal w with small intra-class distance and large interclass distances simultaneously and automatically identify features relevant to multiple classes. We proposed an integrated KNN and constrained logistic regression (KNNLog) approach for sparsef parametric estimation, which forces the irrelevant features to zero. The problem can be formulated as a constrained linear programming (LP) as follows:
Subject to
where |xi - xj|.p = [(xi1 - xj1)p,…,(xim - xjm)p]T is an element-wise operation, and λ, k, and p will be determined through cross validation. In Equation (4), the first constraint represents the k-nearest neighbor intra-class distances, and we restrict them to a soft upper bound 1. The second constraint indicates the inter-class distances with a soft lower bound 2. Hence, we can enforce a soft-margin 1 between the intra-class and inter-class distances. Therefore the solution of Equation (4) will guarantee a small KNN intra-class distance and large interclass distance simultaneously. Finally, we used the k nearest neighbor instead of all the samples in the same class for the first constraint because samples in one class may have multimodal distributions. It is too stringent and unrealistic to require that all samples in one class have small distances.
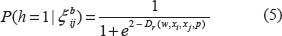
While we can solve Equation 4 with some LP software such as linprog in MATLAB, and lpsolve in C (http://lpsolve.sourceforge.net/5.5/), there are limitations with the LP approach. It could not scale both in terms of time and memory for problems with large number of examples and variables. The number of constraints will increase with O(n2) for a problem with the number of samples n. Even though efficient algorithms exist, handling a large number of constraints is still challenging. We therefore propose an efficient log-likelihood based approach for weight estimation. Since we would like to maximize the intra-class distance and minimize the inter-class distance, we first define an augmented distribution for the intra-class and inter-class distances with the truncated logit function of logistic regression. Letting h = 1 be the class of intra-class distance Dr(w, xi, xj, p) and h = 0 represent the class of inter-class distances De(w, xi, xj, p), we define the probabilities:
where Dr(w, xi, xj, p) = 0. So we have P(h = 1| Dr(w, xi, xj, p)) = 0.5 and 1, when Dr(w, xi, xj, p) = 2 and Dr(w, xi, xj, p) → ∞ respectively. Therefore,
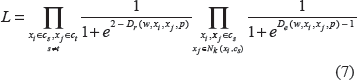
The likelihood for the intra-class and interclass distances is
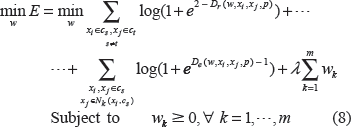
Taking the negative log likelihood and drop the constant, we have the following error function:
Equation (8) is a much simpler negative log likelihood with nonnegative constraints. It can be solved efficiently, even if the problem is one of both large sample size and high dimension. Let
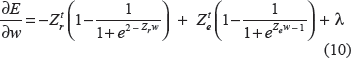
be the two intra-class and interclass distance matrices, the first order derivative for Equation (8) is as follows:
Based on Equation (10) and wk ≥ 0 ∀ k = 1, …, m, we implement a standard conjugate gradient method17 with nonnegative constraints. Because E is a convex optimization with a convex constraint, a global optimal solution is guaranteed theoretically. The global minimum of E is reached if, for each element wk, either (i) wk > 0 and, or (ii), wk = 0 and. The first condition applies to the positive elements of ŵ, whose corresponding terms in the gradient must vanish, and the second condition applies to the zero elements of ŵ. Here, the corresponding terms of the gradient must be nonnegative, thus pinning wk to the boundary of the feasible region. Upon reaching the optimal solution, sparse ŵ with a small number of nonzero parameters can be found. The important features are identified with the nonzero ŵ. Since w ≥ 0, sparsity of the model is determined by both k and λ. The larger the k and λ, the fewer of the nonzero w. The free parameters λ, k, and p are also determined by leave-one-out Jackknife test with the smallest prediction error. For simplicity, we choose p = 1 or 2 only in all computational experiments, but other choices of p do improve the predictive power of our method. Different P values may be selected in individual computations.
Computational Results
Simulation data
The purpose of our first simlation is to show that the proposed method can predict the class labels with high accuracy and identify the class associated features correctly even if there is a high correlation among the features. The simulated dataset is randomly generated with input dimension m = 1000 and only the first 10 features are relevant to the classes. All other features are random noise generated from N(0, 1). We first generate the input data of 5 classes with the sample size of 10, 20, 30, and 50 for each class from 5-dimensional multivariate normal distributions with different means and a variance-covariance matrix The mean of each dimension for each class is randomly chosen from an integer between and including 1 and 5, and the mean of each dimension for different classes is different. In addition, the pairwise correlation among the features (ρ = 0.5) is used to assess the performance of the proposed method. We then reduplicate the first 5 features at the dimension 6-10 so that the input features from dimensions 1-5 and 6-10 are exactly the same. We are trying to demonstrate that KNNLog can identify the first 10 class-relevant features correctly even if some of them are highly correlated (exactly the same).
We analyze this simulation data with the proposed approach and show that our method can identify the features 1-5 and 6-10 simultaneously. The free parameters k, p, and λ are determined through leave-one-out Jackknife test with the training data only. We simulate the experiments 100 times for each of the different sample sizes and count number of correctly identified features in Table 1. Table 1 indicates that KNNLog correctly identified all 10 features with at least 76% accuracy and correctly chose 6 out of 10 features in all 100 simulations with a sample size of n = 10 for each class. As the sample size n increases, the accuracy for selecting the true features also increases. KNNLog identified all 10 features with at least 93% accuracy and 6 out of 10 features with 100% accuracy with the sample size of n = 50. In addition, KNNLog selected features 1 and 6, 2 and 7, 3 and 8, 4 and 9, and 5 and 10 simultaneously with the same accuracy, even if they are exactly the same. Therefore, KNNLog can identify highly correlated features simultaneously without encountering the multiplicity problem with statistical tests. Moreover, the average number of selected features is also closer to the true number 10, when the sample size increases as shown at the bottom of Table 1. The prediction errors with KNNLog are 0.046, 0.04, 0.041, 0.034 with the sample size of 10, 20, 30, and 50 respectively, compared to the much larger prediction errors (0.41, 0.32, 0.25, and 0.20) using KNN without feature selection as shown in Figure 1. In addition, we also compare the performance of our KNNLog with random forests (RF). Random forests (RF) is a classification algorithm that uses an ensemble of unpruned decision trees, each of which is built on a bootstrap sample of the training data using a randomly selected subset of variables.18Figure 1 shows that KNNLog has similar test errors with a different sample size. It also has better performance than random forests (RF) which has the prediction errors of 0.104, 0.063, 0.06, and 0.037 respectively, especially when the sample size are small. Finally, unlike KNNLog which can identify highly correlated features, RF can only select independent features, the average number of features selected with RF are 3.8, 4.2, 4.5, and 4.8 respectively.
Average prediction.
Frequencies of correctly identified features with different sample sizes.
Sample size/per-class parameters (λ*, k*, p*)
10 (300, 9, 2)
20 (350, 19, 2)
30 (450, 28, 1)
50 (460, 45,1)
w1
90
93
94
96
w2
100
100
100
100
w3
100
100
100
100
w4
100
100
100
100
w5
76
88
91
93
w6
90
93
94
96
w7
100
100
100
100
w8
100
100
100
100
w9
100
100
100
100
w10
76
88
91
93
Average no. of features selected
9.32
10.87
9.7
9.96
Note: The frequency number indicates the number of times each feature is selected over 100 permutations.
When two classes have different distributions but have the same or small means, statistical tests based summary statistics (eg, t-test) fail to detect the differences and identify important features. KNNLog, based on location parameter, can still be used to select important features and achieve good predictive accuracy. We simulate two classes of sample size 100 for each class from a 2-dimensional normal distribution with the same mean m1 = m2 = [1,2]t and standard deviation of for class 1 and different standard deviations for class 2, with the ratio σ2/σ1 = 4, 6, 8, 10, respectively. We then reduplicate the generated data to dimension 3-4, so the data from dimension 3-4 are exactly the same as that from dimension 1-2. The total input dimension of the simulated data is 1000, with the rest 996 features for both class generated from N(0, 1). In this setting, the standard t-test fails to identify any features, but KNNLog identifies features 1-4 efficiently as shown in Table 2. The free parameters (k, p, λ) = (56, 2, 1) are determined through cross-validation with training data only. We simulate the experiments 100 times for each different σ2/σ1 ratio and the number of correctly identified features 1-4 is reported in the upper part of Table 2. KNNLog correctly identifies features 1-4 in 78% or more simulations with σ2/σ1 = 4, 96% or more simulations with σ2/σ1 = 6, and 98% or more simulations with σ2/σ1 = 8 or 10. The average number of identified features is closer to the true number of features (4) and the test areas under the ROC curve (AUCs) become larger when the ratio of σ2/σ1 increases as shown at the bottom of Table 2. Therefore, KNNLog based on the pairwise distance of individual samples is more powerful than typical statistical tests.
Frequencies of correctly identified features with different σ2/σ1 ratios.
σ2/σ1
4
6
8
10
w1
84
96
98
98
w2
78
98
100
100
w3
84
96
98
98
w4
78
98
100
100
No. of features
3.72 (±1.37)
3.98 (±0.58)
3.96 (±0.28)
3.96 (±0.28)
Test AUC
0.65 (±0.052)
0.67 (±0.038)
0.692 (±0.03)
0.97 (±0.024)
Note: The frequency numbers represent the number of times each relevant feature is selected over 100 permutations.
microRNA Expression Profiling for Leukemia
A microRNA is a short ribonucleic acid (RNA) molecule found in eukaryotic cells. It has very few nucleotides (an average of 22) compared with other RNAs (http://en.wikipedia.org/wiki/MicroRNA). The variations in microRNA expressions may be associated with different complex diseases including cancer. The microRNA expression data analyzed in this examples are from the NCBI Gene Expression Omnibus (http://www.ncbi.nlm.nih.gov/geo) under the respective accession numbers E-TABM-969 for normal tissues, E-TABM-972 for acute myeloid leukemia (AML), and E-TABM-973 for chronic lymphocytic leukemia (CLL).19–21 There are total 506 samples with 255 normal tissue, 141 AMLs, and 110 CLLs and 390 candidate human microRNAs. We preprocess the data with log2 transformation and quantile normalization, and then evaluate the performance of proposed approach with 2-fold cross-validation. We divide the data into two subsets of roughly equal size with one training and one test data, build a model with the training data, and evaluate the performance with the test data. The free parameters λ, p, and k are estimated using the training data only with the leave-one-out Jack-knife test. To prevent bias arising from a specific partition, we partition the data 100 times through permutation. The relevance count is calculated by the number of times a microRNA is selected in our model. The optimal free parameters are (λ*, k*, p*) = (20, 15, 2). The 32 selected microRNAs are reported in Table 3. The predictive errors are 0.0079 ± 0.003 with 32 selected microRNAs, so KNNLog predicts normal, AML, and CLL with over 99% accuracy with only 32 microRNAs. The log gene expression levels of each microRNA under different clinical conditions are plotted in Figure 2. Most of the 32 identified microRNA signatures are known to be associated with leukemia. For instance, The microRNA miR-125b-1 we identified is known to cause leukemia.22 MicroRNA-125b-1 is involved in several chromosomal translocations, such as t(2;11)(p21;q23) and t(11;14)(q24;q32), which leads to myelodysplasia and acute myeloid leukemia (AML) or B-cell acute lymphoid leukemia (B-ALL), respectively. Because miR-125b-1 negatively regulates many proteins in the p53 pathway, the deregulation of miR-125b expression would impair human and mouse hematopoiesis. Figure 2 indicates that microRNA-125b-1 is over-expressed in both AML and CLL. In addition, several microRNAs are also involved in the differentiation process of various hematopoietic lineages. Indeed, miR-150 controls early B-lymphocyte differentiation and both miR-181a and miR-181b are a crucial modulator for T lymphocyte differentiation and are linked to both AML and CLL. Mir-181b targets Mcl-1 protein and the decrease of its expression inversely correlated with increased protein levels of MCL1 and BCL2 target genes. Therefore mir-181b expression values can be used to specify disease progression in chronic lymphocytic leukemia.23 In addition, since microRNAs control the regulation of fundamental processes, their dysregulation has been clearly linked to cancer and particularly to leukemia. For instance, overexpression of miR-155 has been found in many human leukemias and lymphomas, and mice transplanted with bone-marrow cells. Ectopically expressing miR-155 may develop a myeloproliferative disorder. Finally, the identified microRNAs also provide important targets for biomedical researchers to pursue further studies. As an example, microRNA 12: hsa-mir-216 and microRNA 24: hsa-mir-518c are only over-expressed in AML patients as shown in Figure 2. Those microRNAs need further studies to verify if they have important biological and clinical implications.
32 selected leukemia associated microRNAs and their relevance counts.
microRNA
Relev. count
microRNA
Relev. count
1
hsa-mir-125b-1
93
17
hsa-mir-514-1
100
2
hsa-mir-142
99
18
hsa-mir-514-2&3
100
3
hsa-mir-150
97
19
hsa-mir-515-15p
100
4
hsa-mir-153-1
100
20
hsa-mir-515-25p
100
5
hsa-mir-153-2
100
21
hsa-mir-517a
100
6
hsa-mir-154
100
22
hsa-mir-518a-1
100
7
hsa-mir-155
100
23
hsa-mir-518b
100
8
hsa-mir-181a
100
24
hsa-mir-518c
100
9
hsa-mir-181b
100
25
hsa-mir-518e
100
10
hsa-mir-20b
100
26
hsa-mir-518e/526c
100
11
hsa-mir-213
100
27
hsa-mir-520a
100
12
hsa-mir-216
83
28
hsa-mir-520a*
100
13
hsa-mir-302c
100
29
hsa-mir-520c/526a
100
14
hsa-mir-367
88
30
hsa-mir-520d
100
15
hsa-mir-368
94
31
hsa-mir-526a-1
100
16
hsa-mir-373
100
32
hsa-mir-526b
100
Average predictive error
0.0079 ± 0.003
Note: The count number indicates how many times a microRNA is selected over 100 permutations.
Normalized log-gene expressions for the 32 identified microRNAs in three different classes: left–-normal, middle–-AML, and right–-CLL.
Human metagenomic count data
KNNLog was applied to a 16S rRNA metagenomic dataset from 6 human body habitats,25 external auditory canal (EAC), gut, hair, nostril, oral cavity (OC), and skin. This benchmark dataset excludes samples from communities that were transplanted from another subject or body site. Similar to Costello et al25 it has 552 remaining samples. OTU count data are generated using Mothur package24 (pubmed: 19801464) with the standard processing pipeline at a sequence similarity threshold of 97%. Since this is a highly unbalanced dataset dominated by one class (skin), which could create challenges for classification. We normalized the count data with proportion and arcsin transformation,26 and then detect the body-site associated features and estimate the predictive powers with KNN. The data is split into training (2/3 of samples) and test (1/3 of samples. We estimate parameters λ, p and k using the leave-one-out Jackknife test with the training data only. To prevent bias from a specific partition, we repeat the partition 100 times, the relevance count is calculated by the number of times an OTU is selected in 100 permutations. The parameters with best predictive error are (λ*, k*, p*) are (50, 8, 1) respectively. The predictive performance for classification is shown in Table 4. Eleven selected OTUs with nonzero parameters are given in Table 5.
Predictive performance of the test data for each location.
The numbers in the parentheses are the relevance counts an OTU being selected. Table 4 shows that OC and Gut can be separated from other class perfectly, which is consistent with the result of Costello et al. We also achieved a predictive error of 0.07 (±0.005) with only 11 OTUs in Table 5, compared with the predictive error of 0.08 with 27 OTUs reported by Knights et al.27 KNNLog performs very well even with this highly unbalanced dataset.
Conclusions
We have proposed a KNNLog method that combines instance-based learning (KNN) and model-based learning (logistic regression) for simultaneous feature selection and multi-class prediction. Unlike L1 and Lp (P < 1) penalized methods, which can select only independent features, KNNlog can identify highly correlated features without encountering the multiplicity problem due to multiple tests. In addition, the proposed method can also identify features from data that different classes may have similar means, but are from different distributions, a task t-test fails. Finally, it is robust for unbalanced classification, and can classify multiple classes simultaneously without creating unbalanced classes. It also estimates fewer number of parameters (the same as the number of features) than both one-vs.-one and one-vs.-rest classification schemes, and is efficient for problem with small sample size and a large number of features. While KNNLog was evaluated with only a limited number of datasets, it shows that the integration of instance-based and model-based learning methods can improve the efficiency in both feature selection and multi-class prediction.
Funding
This work was partially supported by the 1R03CA133899 grant from the National Cancer Institute.
Author Contributions
Conceived and designed the experiments: ZL. Analysed the data: ZL. Wrote the first draft of the manuscript: ZL. Contributed to the writing of the manuscript: ZL, HB, MT. Agree with manuscript results and conclusions: ZL, HB, MT. Jointly developed the structure and arguments for the paper: ZL. Made critical revisions and approved final version: HB, MT. All authors reviewed and approved of the final manuscript.
Footnotes
Acknowledgments
We thank the Associate Editor and the two anonymous referees for their constructive comments, which improve this manuscript significantly.
As a requirement of publication author(s) have provided to the publisher signed confirmation of compliance with legal and ethical obligations including but not limited to the following: authorship and contributorship, conflicts of interest, privacy and confidentiality and (where applicable) protection of human and animal research subjects. The authors have read and confirmed their agreement with the ICMJE authorship and conflict of interest criteria. The authors have also confirmed that this article is unique and not under consideration or published in any other publication, and that they have permission from rights holders to reproduce any copyrighted material. Any disclosures are made in this section. The external blind peer reviewers report no conflicts of interest.
References
1.
CrammerK., SingerY.On the algorithmic implementation of multiclass kernel-based vector machines. The Journal of Machine Learning Research.2002: 2(3/1).
2.
AllweinE.L., SchapireR.E., SingerY.Reducing multiclass to binary: a unifying approach for margin classifiers. The Journal of Machme Learning Research.2001; 1(9/1): 113–41.
3.
VensC., StruyfJ.Decision trees for hierarchical multi-label classification. Machme Learning.2008; 73(2): 185–214.
4.
XuZ., KingI., LyuM., JinJ.Semi-supervised feature selection based on manifold regularization. IEEE Transaction on Neura, Networks.2010: 1033–47.
5.
ZhangM.L., ZhouZ.H., Ml-knn. A lazy learning approach to multi-label learning. Pattern Recognition.2007: 40.
6.
ChengW., HullermeierE.Combining instance-based learning and logistic regression for multilabel classification. Machme Learning.2009; 76: 211–25.
7.
GuyonI., ElisseeffA.An introduction to variable and feature selection. Journal of Machme Learning Research.2003; 3: 1157–82.
WestonJ., ElisseeffA., ScholkopfB., TippingM.Use of the zero-norm with linear models and kernel methods. Journal of Machine Learning Research.2003; 3: 1439–61.
10.
PavlidisP., NobleW.S.Analysis of strain and regional variation in gene expression in mouse brain. Genome Biology Research.2001; 2(10): 0042.1–0042.15.
11.
LiuZ., JiangF., TianG.. Sparse logistic regression with Lp penalty for biomarker identification. Statistical Applications in Genetics and Molecular Biology.2007; 6(1): Article 6.
12.
LiuZ., LinS., TanM.T., Sparse support vector machines with Lp penalty for biomarker identification. IEEE/ACM Trans Comput Biol Bioinform.2010; 7(1): 100–7. PMID: 20150672.
13.
MeierL., Van de GeerS., BuhlmannP.The group lasso for logistic regression. Journal of the Roya, Statistical Society Series B.2008; 70(1): 53–71.
14.
YuanM., LinY.Model selection and estimation in regression with grouped variables. Journal of the Roya, Statistical Society Series B.2006; 68(1): 49–67.
15.
ZhangC.H., HuangJ.The sparsity and bias of the lasso selection in high dimensional linear regression. Annals of Statistics.2008; 36(4): 1567–94.
16.
ZhangT.Some sharp performance bounds for least squares regression with L1 regularization. Annals of Statistics.2009; 37(5A): 2109–44.
17.
HaggerW.W., ZhangH.A survey of the nonlinear conjugate gradient methods. Pacific Journal of Optimization.2006; 2(2006): 35–58.
BaffaR., FassanM., VoliniaS.. microRNA expression profiling of human metastatic cancers identifies cancer gene targets. The Journa, of Pathology.2009; 219: 214–21.
20.
GarzonR., PichiorriF., PalumboT.. microRNA gene expression during retinoic acidinduced differentiation of human acute promyelocytic leukemia. Oncogene.2007; 26: 4148–57.
21.
GarzonR., GarofaloM., MartelliM.P.. Distinctive microRNA signature of acute myeloid leukemia bearing cytoplasmic mutated nucleophosmin. Proceedings of the National Academy of Sciences of the United States of America.2008; 105: 3945–50.
22.
BousquetM., HarrisM.H., ZhouB., LodishH.F.microRNA miR-125b causes leukemia. Proc Natl Acad Sci U S A.2010.
23.
VisoneR., VeroneseA., RassentiL.Z.. miR-181b is a biomarker of disease progression in chronic lymphocytic leukemia. Blood.2011; 118(11): 3072–9.
24.
SchlossP.D., WestcottS.L., RyabinT.. Introducing mothur: open-source, platform-independent, community-supported software for describing and comparing microbial communities. Appl Environ Microbiol.2009; 75(23): 7537–41.
25.
CostelloE.K., LauberC.L., HamadyM., FiererN., GordonJ.I., KnightR.Bacterial community variation in human body habitats across space and time. Science.2009; 326(5960): 1694–7.
26.
LiuZ., HsiaoW., CantarelB.L., DrbekE.F., Fraser-LiggettC.Sparse distance based learning for simultaneous multiclass classification and feature selection of metagenomic data. Bioinformatics. Oct 7, 2011. [Epub ahead of print], PMID: 21984758.
27.
KnightsD., CostelloE.K., KnightR.Supervised classification of human microbiota. FEMS Microbiol Rev. Sep 21, 2010. doi: 10.1111/j.1574-6976.