
Abstract
Analyzing the genetic activity of breast cancer survival for a specific type of therapy provides a better understanding of the body response to the treatment and helps select the best course of action and while leading to the design of drugs based on gene activity. In this work, we use supervised and nonsupervised machine learning methods to deal with a multiclass classification problem in which we label the samples based on the combination of the 5-year survivability and treatment; we focus on hormone therapy, radiotherapy, and surgery. The proposed nonsupervised hierarchical models are created to find the highest separability between combinations of the classes. The supervised model consists of a combination of feature selection techniques and efficient classifiers used to find a potential set of biomarker genes specific to response to therapy. The results show that different models achieve different performance scores with accuracies ranging from 80.9% to 100%. We have investigated the roles of many biomarkers through the literature and found that some of the discriminative genes in the computational model such as ZC3H11A, VAX2, MAF1, and ZFP91 are related to breast cancer and other types of cancer.
Keywords
Background
Breast cancer has a very high 5-year relative survival rate (90%) compared with other cancers including pancreas (8%), lung (18%), and liver (18%). However, breast cancer still accounted for 30% all new cancer cases in women in 2015; furthermore, it is the leading cause of cancer death for women from ages 20 to 59 years in the United States. 1
A gene signature in cancer as a predictor for treatment and survival was investigated in earlier works,2,3 in which Chiaretti et al proposed a nonsupervised model in 33 adult patients with T-cell acute lymphocytic leukemia (T-ALL). They found that a single gene interleukin 8 (IL-8) is strongly associated with resistance to first-line treatment and that 3 genes (CD2, TTK, and AHNAK) are highly predictive of outcome in uniformly treated adults with T-ALL. 2 De Vijver et al used a multivariable Cox regression analysis model on a database of 295 patients with breast cancer who have a gene expression signature associated with poor vs prognosis. They found that the prognosis profile was a key predictor of the clinical outcome. 3
Chang et al obtained a wound response signature from 295 patients with early breast cancer. They assume that features of the molecular program of normal wound healing might play a key role in cancer metastasis. The proposed method investigates those signature genes’ expression in patients with cancer. They found that both overall survival and distant metastasis-free survival are markedly diminished in patients whose tumors expressed the wound response signature compared with tumors that did not express this signature. A gene expression centroid of the wound response signature acts as a prospectively assigning a prognostic score. Unsupervised hierarchical clustering (“molecular subtypes”) and supervised predictors of metastasis (“70-gene prognosis signature”) established prognostic signatures. It also suggested that the wound response signature improves risk stratification independently of known clinicopathologic risk factors. 4
Pederson et al employed a genetics specialist embedded within a multidisciplinary breast clinic and studied the hereditary cancer risk to assist the decision making in the cancer treatment. The study focuses on accelerating the surgery based on genetic information. That model was used to compare cancer care between 471 patients in 2012 and 440 patients in 2014, Before embedding a genetic counselor and the following intervention, the results show that genetic counseling has influenced time to treatment in the 2014 cohort of patients. Recommendation for surgery such as bilateral mastectomy is done for women with mutations in TP53 and PTEN. 5
In this work, we extend an earlier method 6 that was used to predict the proper treatment therapy for better survivability, which is based on gene expression data in breast cancer by handling the multiclass problem using a greedy method of one-vs-rest classification model. In our earlier model, the survival periods of the patients vary, whereas in the proposed model, the only patients are considered to be survived who lived for more than 5 years after receiving the treatment. We propose a hierarchical clustering approach based on Ward’s linkage to find better borders among the groups of different classes. We then apply standard classifiers on these clusters. The proposed method suggests that for treatment of breast cancer based on gene expression, the model categorizes the survivals and deaths because of breast cancer for each type of treatment by analyzing the genes that can distinguish these classes.
Materials and Methods
Samples from a publicly accessible data set of 2433 patients with breast cancer and survival are used in this approach. 7 After analyzing the given data, 6 classes were identified as the baseline of this work. These classes are the combination of each treatment (surgery, hormone therapy, radiotherapy) with a patient status (living or deceased). The number of samples (patients) for each class is shown in Table 1, which indicates that a total of 347 patients are used in this work.
Class list with the number of samples in each class.

Figure 1 depicts the distribution of the breast cancer subtype samples in each class. The subtypes are well-distributed in each class; at least 3 subtypes are represented in each class, which means that the possibility of correlation between subtypes and classes is very low.

The distribution of breast cancer subtype samples in each class.
Based on the available data, only 3 treatment therapies are covered; they are surgery, hormone therapy, and radiotherapy (Figure 2). Our proposed model is a bottom-up hierarchical multiclass tree obtained using agglomerative clustering technique. The data set contains imbalanced classes, a problem that is well known in machine learning. The pipeline of the proposed model starts with feature selection methods, including chi-square 8 and Info-Gain, which are applied for limiting the significant number of features (genes). A wrapper method is also used to obtain the best subset of genes that represent the model using mRMR (minimum redundancy maximum relevance) feature selection method. 9 This was followed by applying several class balancing techniques such as Synthetic Minority Over-Sampling Technique (SMOTE), 10 cost-sensitive, 11 and resampling 12 to balance the number of classes before applying different types of classifiers such as Nave Bayes 13 and random forest. 14 Finally, a small number of biomarker genes are identified for predicting the proper treatment therapy. To the best of our awareness, this work is the first prediction model which is built on the combination of treatment and survivability of the patient as a class.

The distribution of breast cancer subtype samples in each treatment therapy samples.
The patient class distribution is shown in Figure 3, which depicts the percentage of samples within each class. It is clear that there are significant differences between the number of samples of the different classes, which requires class balancing to achieve a fair calcification.
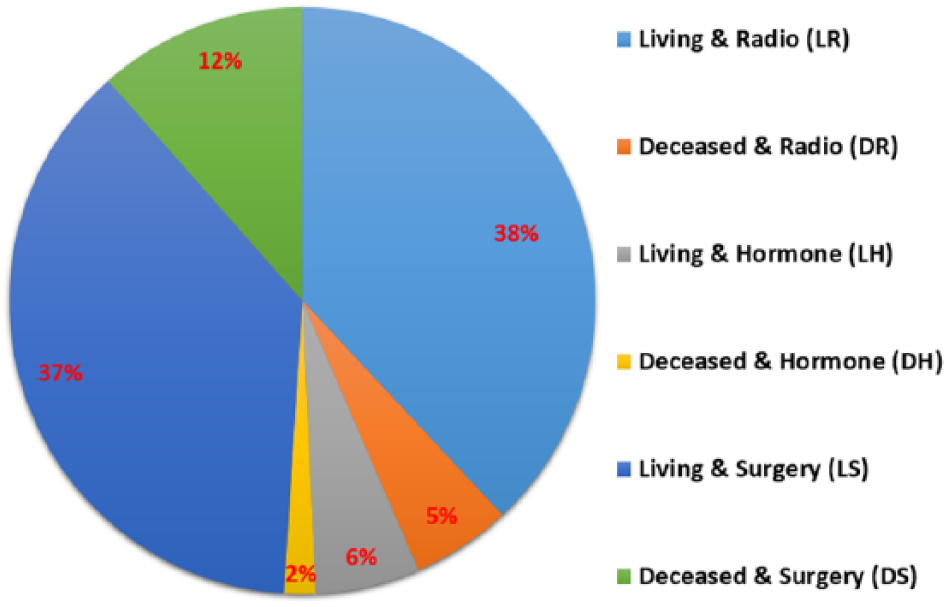
Percentage of patient class distribution.
The Bottom-Up Multiclass Classification Approach
In our proposed bottom-up approach, we build 5 models based on the linkage type between classes. We start with 6 distinct data sets of samples responding to the 6 classes and then build a bottom-up fashion tree. The flow chart is illustrated in Figure 4, which shows the steps for obtaining the 5 models based on the distance between the classes.

Schematic representation of the proposed models based on the linkage type.
In the first step, the distance matrix between all pairs of the 6 classes is calculated. Then, the 2 classes i and j with the minimum distance di,j are merged. As a result, we obtain a new distance matrix after merging the 2 closest classes (5 classes), and the 2 classes with the minimum distance are merged until we obtain only a single class.
The merging steps in the model are shown in Supplementary Table 1. Step 1 shows the distance matrix between the 6 classes. In step 2, classes C1 and C4 are merged as d1,4 is the smallest distance in the table; the 2 classes are merged and form a new data set, which is the combination of the samples from these 2 classes. For the simplicity, we call it class C14. In step 3, these new 3 classes are compared again in a pairwise fashion until only 1 class remains at step 5.
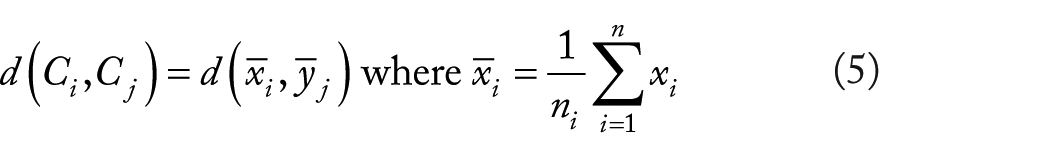
The distance matrix used in this work is the Euclidean distance. The Euclidean distance between 2 classes

To compute the distance between 2 clusters, there are several linkage methods. Supplementary Figure 1 shows some approaches that can be used such as single linkage, complete linkage, average linkage, centroid linkage, and Ward’s linkage methods. Both single and complete linkage types rely on a pair of samples for determining the distance between 2 clusters, whereas the other 3 linkage types, average linkage, centroid linkage, and Ward’s linkage, rely on all samples within each class for determining the distance between the classes.
Single linkage the distance between 2 clusters is the distance between the 2 nearest neighbor’s samples in such a way that 2 neighbors belong to different clusters. This can be formulated as follows:

Complete linkage evaluates the distance between 2 clusters based on the distance between the furthest neighbors, where each neighbor belongs to one of the clusters. This can be formulated as follows:

Average linkage, however, takes the average of the distances between all pairs of samples into account. In other words, the distance between 2 clusters using the average linkage method can be computed as follows:

Centroid linkage uses the distance between the centroids of the 2 classes:
Ward’s linkage is one of the other approaches that use analysis of variance to evaluate the distances between clusters. 15 Ward’s linkage minimum variance method is a special case of the objective function approach initially presented in the work by Ward. 16 Ward’s linkage works as follows:
Using analysis of variance to evaluate the distances between clusters.
Minimizing the sum of squares of any 2 (hypothetical) clusters that can be formed at each step, as follows:

where Ni and Nj are the numbers of samples in cluster i and j , respectively, and Ci and Cj denote the centers of the clusters; ||.|| is the Euclidean norm.
The mean and cardinality of the newly merged cluster, k, is computed as follows:


Feature Selection
The gene expression data set contains 24 368 genes for each of the 347 samples. The problem of curse of dimensionality makes it difficult to classify the data set in its current form. Hence, feature selection is essential to narrow down the number of genes to few genes at each node. Chi-square and Info-Gain are applied to select the best information gain of the selected genes, and then mRMR feature selection is applied to find the best subset of significant genes. The mRMR is an algorithm commonly used in a greedy search to identify characteristics of features and narrow down their relevance correctly.
Class Imbalance
These 5 models use one-vs-rest to handle the multiclass problem, which leads to an unbalanced class data set at each node of the classification model. Therefore, we applied several techniques to handle this issue such as follows:
Oversampling. Oversampling the minority class using synthetic data generators. There are several algorithms to achieve this; we used one of the most popular algorithms, SMOTE.
Cost-sensitive classifier. Using penalized models that apply additional costs for the minority class to achieve class balancing. This, in turn, bias the model to pay more attention to the minority class. The algorithm used in this work is called cost-sensitive classifier in Weka using a penalty matrix to overcome the imbalance.
Resampling. Replicating the data set, which can be done by one of 2 methods. First, adding more copies of the data instances to the minority class, called oversampling. Second, by deleting some instances of the majority class, called undersampling. We used the oversampling technique.
Classification
After deriving the 5 models using the 5 linkage types to find the closest classes, a hierarchical tree obtained using agglomerative clustering. The standard classifiers were applied to determine which biomarker genes are the most discriminative ones in terms of separating the classes in each branch of the tree.
To train support vector machine (SVM) classifying, libSVM library 17 with linear kernel was used within a grid search algorithm to optimize the classifiers’ parameters. After running the algorithm on the data, we found that Ward’s linkage method is the one that achieves better accuracy and most meaningful hierarchy, based on the 6 classes.
Results and Discussion
Ward’s linkage model shows the best performance measurements than the rest of the models. Moreover, it has a balanced tree of the treatment survival clusters as shown in Figure 5 which leads to easier maintaining of different group of clusters. Table 2 shows the discriminative genes between each group of clusters in the tree. The results suggested that the separation between the clusters in the lower part of the tree is significantly high-performance scores between 99% and 100% for classifying the tree nodes. The accuracies of classifying nodes are 100% for DH vs LH, and 99.2% for DS vs LS. The scores remain high in the middle part of the tree with accuracy 99.6% for the left side which is (DH, LH) vs LR, 99.5% for the right side which is DR vs (DS, LS), whereas the scores drop down on the root of the tree where we classify the left side vs the right side of the tree to 81.8% for classifying 2 clusters with many classes in each of them. The results for the 4 models are presented in the supplementary materials.

Ward’s linkage model: classification model with performance measures.
Ward’s linkage model: 37 biomarker genes.

In Ward’s linkage, the objective function is based on sum square error, which is to minimize the within-cluster variance to improve the classification performance rather than reducing the distance between each pair of clusters.
Figure 6 shows a multidimensional representation of the plot matrix for the 5 discriminative genes found in Ward’s linkage model for the node of DR class vs (DS, LS) class, as an example; the figure also shows the relations among the 5 genes with each other. It is clear that from the class column, the samples are separable with not much of overlapping for the 2 clusters.

Ward’s linkage model DR vs (DS, LS) node with 5 genes relation matrix.
Figure 7 shows the boxplot for some biomarker genes which indicates the minimum, first quartile, median, third quartile, and maximum gene expression values for each group of samples (DH vs LH) and (DR vs [DS, LS]). The gene expression of INO80 is slightly upregulated in the DH samples comparing with the LH of the samples, TBX21 is also upregulated in the DR samples comparing with the DSLS of the samples. Although it shows that the gene expression of PAX7 is downregulated in the DH samples comparing with the LH of the samples, AK130741 is also downregulated in the DR samples comparing with the DSLS of the samples.

Boxplot for the biomarker genes in Ward’s linkage model shows the minimum, first quartile, median, third quartile, and maximum gene expression values for each group of samples (DH vs LH) and (DR vs [DS, LS]).
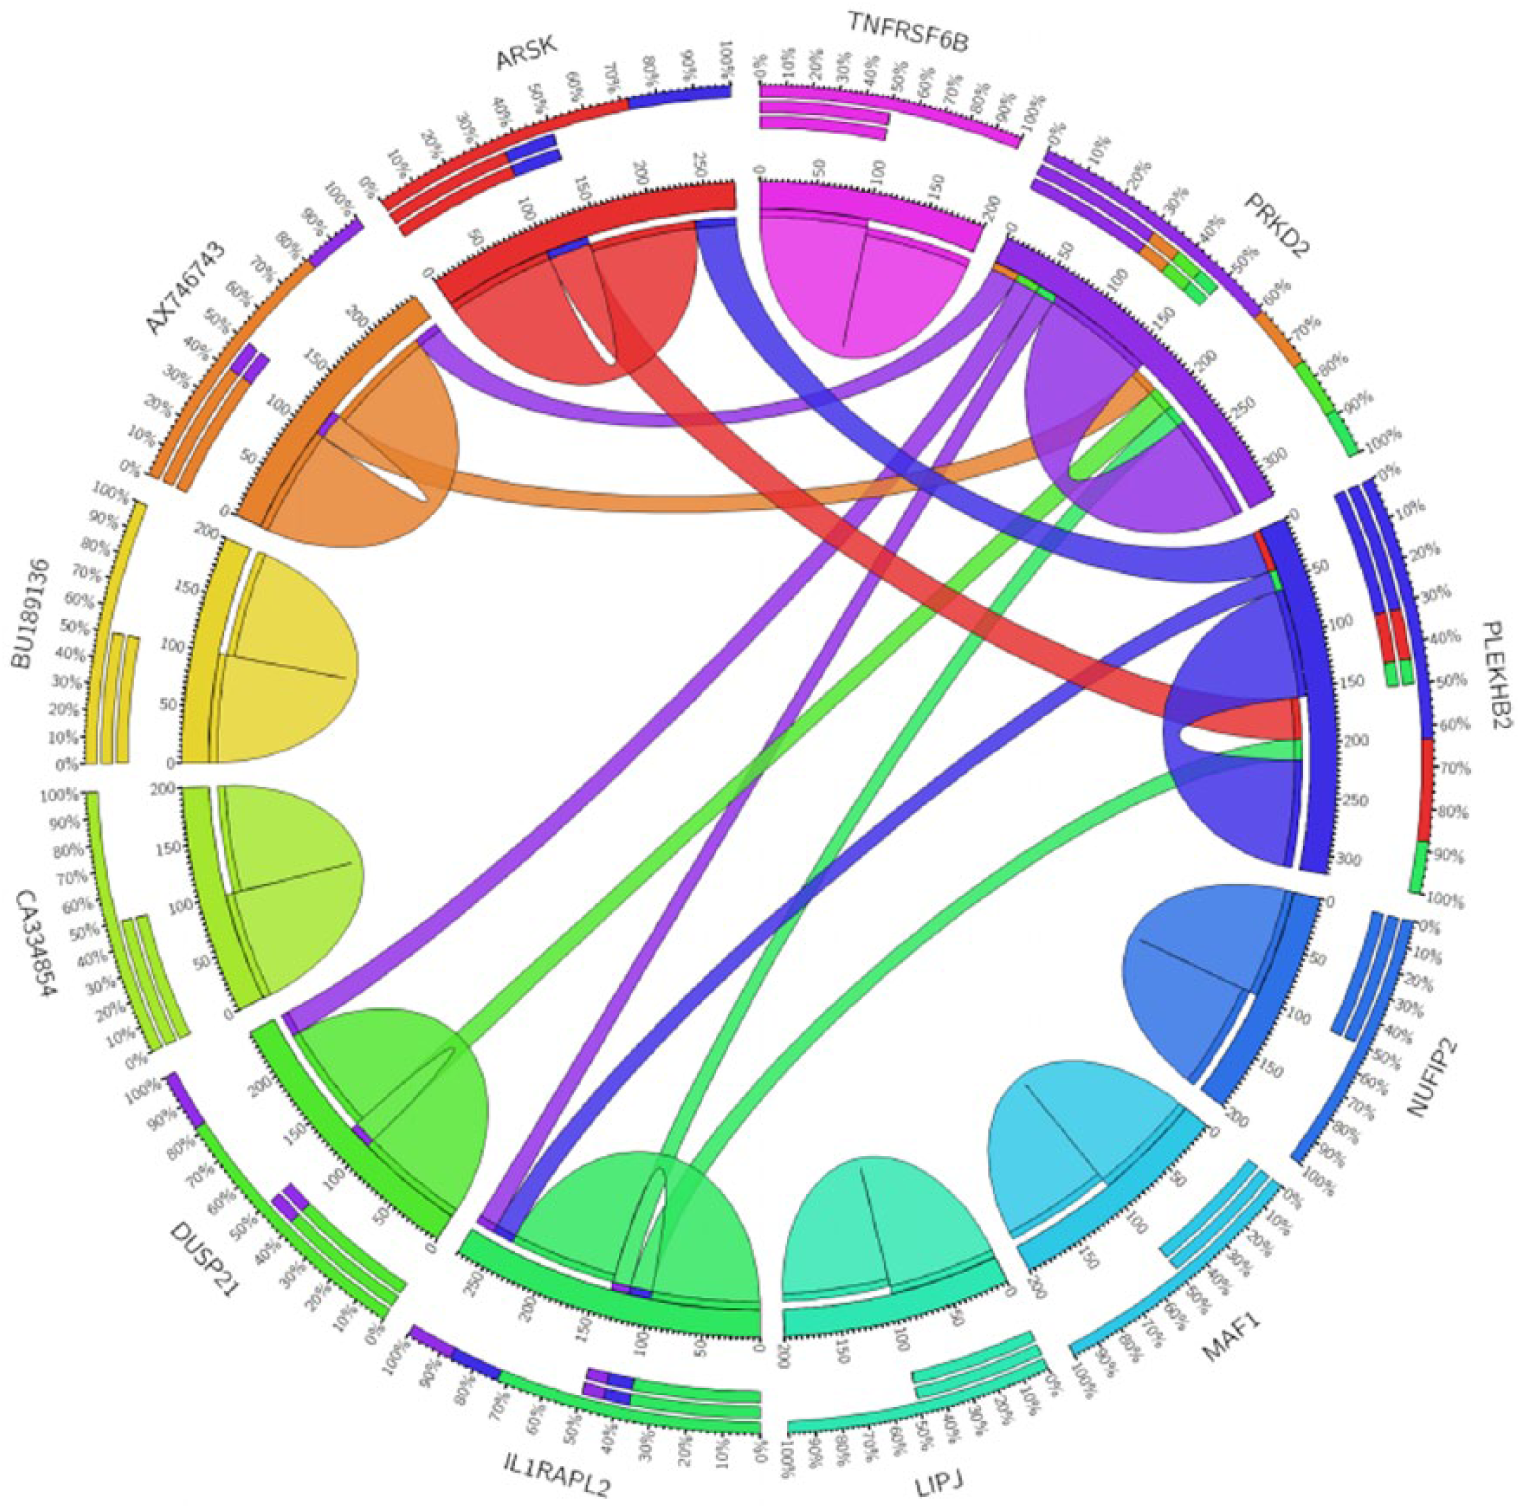
For Ward’s linkage model for the “DS” vs “LS” node and as shown in Figure 8, CA334854 gene has a strong correlation coefficient with 2 genes AX746743 and IL1RAPL2 in the DS samples, whereas there is no significant correlation between them in the LS samples as shown in Figure 9.

Circos plot for the biomarker genes in Ward’s linkage model for the DS class samples based on the correlation coefficient among gene expressions (P < .05).
Circos plot for the biomarker genes in Ward’s linkage model for the LS class samples based on the correlation coefficient among gene expressions (P < .05).
Biological Insight
For the discriminative genes in DH vs LH node, INO80 and PAX7 genes are both involved in regulation of epigenetic histone marks and chromatin remodeling. 18 As part of the analysis of epigenetic modifications around INO80 interaction site, Mendiratta et al studied the NO80-binding region of HOXC11 and PAX7 genes by ChIP with anti-H3K9ac and anti-H3k27me3 followed by quantitative polymerase chain reaction. In both the cases studied, INO80 enrichment was correlated with H3K27me3. 19 Both of them also were reported in protein-protein interaction network for cancer. 20
Some of the found genes in the computational model are related to breast cancer. Cai et al studied the identify breast cancer susceptibility loci rs4951011 at 1q32.1 in intron 2 of the ZC3H11A gene; the 3-genome study was conducted on patients from the Eastern Asian population mainly Chinese and Koreans. They also found that expression levels of the ZC3H11A gene were significantly higher in the tumor tissue than in adjacent normal tissue (P = .0049) in TCGA (The Cancer Genome Atlas) data. The function of ZC3H11A is not clear. 21
VAX2 is a protein-coding gene that encodes a homeodomain-containing protein from a class of homeobox transcription factors which are conserved in vertebrates. 22 Gu et al 23 identified the top 40 most correlated genes with similar methylation patterns calculated by Pearson correlation; VAX2 is one of them. VAX2 is found to be a transcription factor that regulates 3 genes (PLCB4, ADCY6, and CNR1) in RNA tissue in response to chemotherapy in patients with operable breast cancer. 24
MAF1 displays tumor suppressor activity. Surprisingly, blocking the synthesis of ribosomal RNA and transfer RNAs is insufficient to account for MAF1’s tumor suppressor function. MAF1 binds to the PTEN promoter to enhance PTEN promoter acetylation and activity. MAF1 downregulation unexpectedly leads to activation of AKT-mTOR signaling, which is mediated by decreased PTEN expression. 25
ZFP91 serves as a positive regulator for MAP3K14 gene, causing its stabilization and activation. Overexpression of MAP3K14 has been associated with neoplastic growth such as in melanoma, pancreatic carcinoma, lung cancer, breast cancer, multiple myeloma, and adult T-cell leukemia. ZFP91-mediated stabilization may tolerate one of the mechanisms of MAP3K14 oncogenic activation. 26
Labhart et al 27 identified DSCAM as one of the target genes in breast cancer cells which are directly regulated by the SRC-3/AIB1 coactivator. Stuhlmiller et al 28 defined a signature of kinases that regulate MARK2, the kinases involved in significant changes for MIB binding after 48-hr lapatinib treatment for breast cancer cells. ROBO1 is a cell adhesion receptor that is a survival and growth factor for breast cancer. 29 Using cBioPortal, 30 we invistegated the pathway of genes on another breast cancer data set, 31 The 3 genes (DSCAM, MARK2m, and ROBO1) from node were found connected in the pathway shown in Figure 10. DSCAM and MARK2 were also reported to be in 2 pathways combined with RPS7 in Reactome pathway knowledgebase 32 ; the 2 pathways are axon guidance (R-HSA-422475) and developmental biology (R-HSA-1266738). The full information about these pathways and some other pathways in which the biomarkers are involved in them are included in supplementary pathways.

Network genes pathway that includes most frequently altered neighbor genes for (DSCAM, MARK2, and ROBO1).
Two genes from DS vs LS node were also reported in Reactome database; ARSK and PRKD2 were found in 3 pathways which are sphingolipid metabolism (R-HSA-428157), metabolism of lipids (R-HSA-556833), and metabolism (R-HSA-1430728). See supplementary pathways for more information.
Conclusions
In conclusion, a hierarchical clustering model based on Ward’s linkage found to be discriminative in drawing borders for survival treatments classes in breast cancer. Based on the gene expression data, standard classifiers perform very well in the nodes of the clusters in the constructed hierarchical tree. The results suggest subsets of genes, in which, some of the genes in the same nodes are reported to be related in functions or pathways, and some of them are strongly related to breast cancer. ZC3H11 is highly statistically significant expresses in tumor tissue, VAX2 is associated with the response of chemotherapy in breast cancer, whereas MAF1 is a tumor suppressor, and ZFP91 is a positive regulator for MAP3K14 that is related with breast cancer. MARK2 and ROBO1 have been coexisted in some pathways; also, ARSK and PRKD2 have the same case.
Supplemental Material
SupplementaryMaterial_CLN – Supplemental material for A Novel Approach for Identifying Relevant Genes for Breast Cancer Survivability on Specific Therapies
Supplemental material, SupplementaryMaterial_CLN for A Novel Approach for Identifying Relevant Genes for Breast Cancer Survivability on Specific Therapies by Ashraf Abou Tabl, Abedalrhman Alkhateeb, Huy Quang Pham, Luis Rueda, Waguih ElMaraghy and Alioune Ngom in Evolutionary Bioinformatics
Footnotes
Funding:
The author(s) disclosed receipt of the following financial support for the research, authorship, and/or publication of this article: This work has been partially supported by the Natural Sciences and Engineering Research Council of Canada (NSERC), and the Windsor Essex County Cancer Centre Foundation (WECCCF) Seeds4Hope program.
Declaration of conflicting interests:
The author(s) declared no potential conflicts of interest with respect to the research, authorship, and/or publication of this article.
Author Contributions
AAT and AA equally contributed in applying the method, and verifying the results. AAT, AA, AN, and LR all participated in the discussing the ideas. HQP has analyzed the pathways for the gene biomarkers. All authors have contributed in writing and reviewing the manuscript.
References
Supplementary Material
Please find the following supplemental material available below.
For Open Access articles published under a Creative Commons License, all supplemental material carries the same license as the article it is associated with.
For non-Open Access articles published, all supplemental material carries a non-exclusive license, and permission requests for re-use of supplemental material or any part of supplemental material shall be sent directly to the copyright owner as specified in the copyright notice associated with the article.