
Abstract
Molecular techniques that assess biodiversity through the analysis of a small segment of mitochondrial genome have been getting wide attention for inferring the mammalian diversity. Due to their highly conserved nature, specific mitochondrial genes offer a promising tool for phylogenetic analysis. However, there is no established criteria for selecting the typical mitochondrial DNA (mtDNA) segments to achieve a greater resolving power. We therefore chose the family Bovidae as a model and compared the tree-topologies resulting from the commonly used and phylogenetically-informative genes including 16S rRNA, 12S rRNA, COI, Cyt b and D-loop with respect to complete mitochondrial genome. The tree topologies from the whole mitochondrial genome of 12 species were not identical albeit similar with those resulting from the five individual genes mentioned above. High bootstrap values were observed for mtDNA compared with that of any single gene. The average pair-wise sequence divergence using different genetic modes was found to be: D-loop (0.229) > Cyt b (0.159) > COI or complete mtDNA (0.143) > 12S rRNA (0.094) > 16S rRNA (0.091). The tree resulting from complete mtDNA clearly separated the 12 taxa of Bovidae into 3 major clusters, one cluster each for subfamily Cervinae and Bovinae and the third cluster comprised the distinctive clades of Caprinae and Antilopinae. However, jumping clades of Antilopinae were observed while using the individual genes. This study showed that Bison bison and Bos Taurus have very close phylogenetic relationship compared to Bubalus bubalis (Bovinae), irrespective of the method used. Our findings suggest that complete mtDNA genome provides most reliable understanding of complex phylogenetic relationships while the reliability of individual gene trees should be verified with high bootstrap support.
Keywords
Introduction
Members of the family bovidae (order: Artiodactyla) include bison, buffalo, antelopes, gazelles, sheep, goats, muskox and domestic cattle, which are distinguished by the presence of permanent hollow horns. The family bovidae has a great variety of morphologies with 137 living and more than 300 fossil species have been described. 1 The phylogenetic relationships and taxonomy of this family have been controversial for a long time. Undisputed divisions of bovids include (i) Bovinae (for example cattle, nilgai and eland), (ii) Cephalophinae (duikers), (iii) Caprinae (sheep, goats and related animals), (iv) Hippotraginae (roan antelope) and (v) Antilopinae (gazelles, chiru and blackbuck). 2 Specifically, there is only one morphological character that unambiguously defines the bovids: their non-deciduous horn cores and horn sheaths. 3 More than half a century ago, the systematics of Bovids was extremely difficult and Bovidae was considered as one of the most troublesome groups of mammals to classify. 4 However, the new advents in sequencing analysis and bioinformatics have simplified the molecular systematics of Bovidae to some extent. The application of mitochondrial genes such as 12S rRNA, Cytochrome b (Cyt-b) and displacement loop (D-loop) has been getting wide interest in phylogenetic analysis of diverse taxa.5–8
Mitochondrial DNA (mtDNA) has a relatively fast mutation rate, which results in significant variation in mtDNA sequences between species and in principle, a comparatively small variance within species. 9 Mitochondrial 16S rRNA gene sequence has been used for the identification of 182 vertebrates and 103 invertebrates, while a single locus appeared to be sufficient for the identification of most of the species. 10 Recently, the reliability of mitochondrial gene barcodes has been determined for diverse clades of birds.11–15 Fernandez & Vrba 16 have provided a complete estimate of phylogenetic relationship among the members of Ruminantia. However, the efficiencies of single mitochondrial genes versus complete mitochondrial genome for inferring complex phylogenies have not been thoroughly investigated. In this study, we addressed the question whether the individual mitochondrial genes (16S rRNA, 12S rRNA, COI, Cyt-b and D-loop) provide the same phylogenetic information as compared to complete mitochondrial DNA (mt-DNA). We used 12 representative species from the mammalian family Bovidae to test our hypothesis.
Materials and Methods
Sequences of the animal species used in the comparative phylogeny of the family Bovidae.

The evolutionary history was inferred using the maximum likelihood 18 and neighbor-joining 19 methods.All the phylogenetic analyses were conducted in MEGA software (http://www.megasoftware.net), version 4. 20 Other software tools such as PHYLIP, PAUP, HyPhy, etc. may also be used to conduct phy-logenetic analysis using gene sequence data. The percentage of replicate trees in which the associated taxa clustered together was determined by the bootstrap test (1000 replicates). 21 Bootstrapping is a commonly used method for constructing reliable trees by sub-sampling from the sites in an alignment to create trees based on subsamples. The process is iterated multiple times (preferably 1000 times) and the results are compiled to allow an estimate of the reliability of a particular grouping. 22 Estimates of evolutionary divergence between sequences were determined using the maximum composite likelihood method in MEGA.23 A composite likelihood is defined as a sum of related log-likelihoods. Since all pair-wise distances in a distance matrix have correlations due to the phylogenetic relationships among the sequences, the sum of their log-likelihoods is a composite likelihood. This model assumes equality of substitution pattern among lineages and of substitution rates among sites. We also conducted maximum parsimony and minimum evolution models to verify the bootstrap supports and these findings have been shown as nodal dots in NJ trees to avoid repetition by showing the same trees for these two methods. Pair-wise base homology (%) was determined by using the formulae: (1 - evolutionary divergence between sequences) × 100. All the positions containing gaps or missing data were eliminated (complete deletion) from the dataset prior to analysis. However, MEGA software also provides alternatives to retain all such sites initially and excluding them as necessary in the pair-wise distance estimation (pair-wise deletion option) or to use the partial deletion (site coverage) as a percentage.
Results and Discussion
The pair-wise sequence diversity was found to be lowest for 16S rRNA gene and highest for D-loop. The average sequence diversities for various gene segments were as follows: 16S rRNA (average 0.091, range 0.04-0.13), 12S rRNA (0.094, 0.03-0.13), mtDNA genome (0.143, 0.06-0.17), CO1 (0.143, 0.05-0.18), Cyt-b (0.159, 0.08-0.20) and D-loop (0.229, 0.10-0.32). Conversely, in terms of pair-wise sequence similarity, it was highest for 16S rRNA gene and the lowest for D-loop (Fig. 1). The overall pair-wise sequence similarities were 90.9% (range, 82.2%-96.4%), 90.6% (87.2%-97.4%), 85.7% (82.5%-93.8%), 85.5% (82.0%-94.8%), 84.1% (79.8%-92.4%), 77.1% (68.4%-89.6%) for 16S rRNA, 12S rRNA, mtDNA genome, CO1, Cyt-b and D-loop, respectively. The phylogenetic trees constructed using the whole mitochondrial genome appeared to be identical irrespective of the method used (ML versus NJ) (Figs. 2 and 3). The phylogenetic trees resulted from the sequences of individual genes (16S rRNA, 12S rRNA, CO1, Cyt-b, D-loop) were not identical with that of whole mitochondrial genome based tree; their topologies were only partially similar for both ML (Fig. 2) and NJ (Fig. 3) methods.
Comparative view of average pair-wise sequence similarity among 12 members of Bovidae family using individual mitochondrial genes and nearly complete mitochondrial genome. Vertical error bars show the standard error of mean. Maximum likelihood dendrograms showing the phylogenetic relationship among members of the family Bovidae based on almost complete nucleotide sequences of (A) mtDNA (B) 16S rRNA (C) 12S rRNA, (D) CO1 (E) Cyt-b and (F) D-loop. Neighbor-Joining dendrograms showing the phylogenetic relationship among members of the family Bovidae based on almost complete nucleotide sequences of (A) mtDnA genome, (B) 16S rRNA, (C) 12S rRNA, (D) CO1, (E) Cyt-b and (F) D-loop.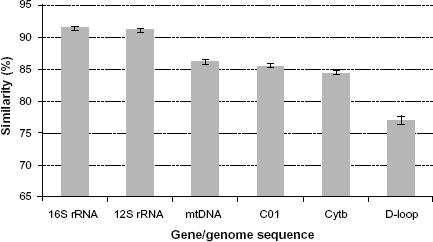


The phylogenetic analyses using complete mt-DNA indicated main split of the 12 members of the Bovidae into one bovine clade and one non-bovine clade, which grouped all other bovids (Figs. 2 and 3). The same broader cladistic was observed using 16S rRNA, 12S rRNA and CO1 genes but not with Cyt-b and D-loop. Further branching showed low bootstrap values (<50%) for the trees obtained using individual genes. An elaborated study using 197 species of the ruminants showed the same trends, splitting into bovine clade and non-bovine clade. 16 The tree topologies unanimously showed very close relationship between Bison bison and Bos taurus under the subfamily Bovinae. Bootstrap values for the grouping of these species for all the trees were 100% (Figs. 2 and 3) with low sequence diversity (Supplementary Tables 1-6). Due to their close phylogenetic relationship, it has been suggested that Bos and Bison should be integrated into a single Bos genus. 16 Bubalus bubalis was observed distantly related with Bos-Bison group as previously reported. 7 Molecular data of Bovini suggest two lineages, buffalo (Bubalus sp.) versus cattle (Bos, Bison)2,24 Another report also indicated that Bison and Bos are more closely related to each other rather with Bubalus, as supported from morphological, paleontological, and reproductive data. 5
Besides clearly differentiating the subfamily Bovinae, the complete mitochondrial genome tree clustered all the members of Caprinae with high bootstrap supports and sequential ancestry from the two members of Antilopinae. However, the placement of Antilopinae using the individual genes appeared to be unstable that can be seen as jumping clades in respective trees. Previous study has suggested the monophyly of Bovinae and Caprinae however Antilopinae appeared to be polyphyletic. 16 All the tree analyses also showed close relationship between Capricornis crispus and Naemorhedus caudatus (subfamily: Caprinae) compared with the other members included in the tree analyses and supported by high bootstrap values (98%-100%). This corroborates with the previous reports.16,25,26
The systematic position within the tribe Bovini remains confused since the analyses of morphological characters have led to several conflicting hypotheses. Some authors have suggested that Bovinae could be comprised of hybrid species produced by the crossing of the banteng with gaur, zebu, or water buffalo. 27 Systematic work on Bovids has been difficult and the Bovidae is one of the most troublesome groups of mammals to classify. 4 The family Bovidae might have formed about 25 million years ago within a period of 5 million years. 28 One of the most striking aspects of recent higher mammalian phylogeny indicated that artiodactyls possessed a common ancestor that is not shared by any other group. 2 Genomic distances between the cattle species have been influenced by genetic exchange between neighboring ancestral populations. 29 The intractability of this systematic problem is consistent with a rapid radiation of the major bovid groups 6
The highly effective method for measuring support for phylogenetic relationships is bootstrapping. 21 We examined whether a clade present in the tree constructed with single gene is present on the whole genome tree or not and the bootstrap value of the node. The most frequent within-method variations were related to the placement of Antilopinae. Between-methods comparison also showed variations in tree topologies resulting from all the individual genes except Cyt-b. Moreover, the trees generated from complete mtDNA genome showed greater resolution with high bootstrap support as compared to phylogeny inferred from individual genes. A large number of nucleotide sites are needed to exactly determine the whole-genome tree whereas a relatively small number of sites often results in a tree with closer topology. 30 It has been shown that blocks of contiguous sites are less likely to lead to the whole-genome tree than samples composed of sites drawn individually from throughout the genome. 30
In conclusion, the findings of this study showed that complete mitochondrial genome provides a greater resolution in phylogenetic analysis of complex taxonomic groups. The phylogeny of Bovidae using the sequences of individual genes (16S rRNA, 12S rRNA, CO1, Cytb and D-loop) of mtDNA failed to provide identical tree topology with that of complete mtDNA. The tree resulting from complete mtDNA clearly separated the 12 taxa of Bovidae into clusters with distinctive phylogeny however jumping clades of Antilopinae were observed while using the individual genes. The common phylogenetic inference using individual genes or complete mitochondrial genome was the placement of Cervinae and Bovinae. Thus, for understanding the complex phylogenetic relationships, the use of complete mitochondrial genome should be preferred over individual genes. Nevertheless the individual gene trees with conditional high bootstrap support may also provide useful phylogenetic information.
Supplementary Tables
Estimates of evolutionary divergence between sequences of nearly complete mtDnA of the used taxa under the family Bovidae.

Estimates of evolutionary divergence between sequences of 16S rDnA of the used taxa under the family Bovidae.

Estimates of evolutionary divergence between sequences of 12S rDnA of the used taxa under the family Bovidae.

Estimates of evolutionary divergence between sequences of CO1 mtDNA of the used taxa under the family Bovidae.

Estimates of evolutionary divergence between sequences of Cytb mtDNA of the used taxa under the family Bovidae.

Estimates of evolutionary divergence between sequences of D-loop mtDNA of the used taxa under the family Bovidae.

Footnotes
Acknowledgments
The authors extend their appreciation to the Deanship of Scientific Research at King Saud University for funding the work through the research group project No. RGP-VPP-009. We are grateful to the two anonymous Reviewers for providing highly insightful and worthy comments that significantly improved the quality of this report.
Author(s) have provided signed confirmations to the publisher of their compliance with all applicable legal and ethical obligations in respect to declaration of conflicts of interest, funding, authorship and contributor-ship, and compliance with ethical requirements in respect to treatment of human and animal test subjects. If this article contains identifiable human subject(s) author(s) were required to supply signed patient consent prior to publication. Author(s) have confirmed that the published article is unique and not under consideration nor published by any other publication and that they have consent to reproduce any copyrighted material. The peer reviewers declared no conflicts of interest.