
Abstract
We developed a multilayered screening method that integrates both genome and transcriptome data to effectively identify regulatory genes in rice (Oryza sativa). We tested our method using eight rice accessions that differed in three important nutritional and agricultural traits, anthocyanin biosynthesis, amylose content, and heading date. In the genome resequencing of eight rice accessions with 24 RNA sequencing experiments, 98% of the preprocessed reads could be uniquely mapped to the reference genome, resulting in the identification of 42,699 unique transcripts. Comparison between black and white rice cultivars showed evidence of intensive selective sweeps in chromosomes 3, 10, and 12. A total of 131 genes were differentially expressed among the black rice cultivars and found to be associated with three Gene Ontology terms (secondary metabolic process, biosynthetic process, and response to stimulus). We identified nonsynonymous Single Nucleotide Polymorphism (SNP) that likely play an important role in determining the agronomic traits differences, two upregulated and three downregulated genes in the black cultivars, and two downregulated genes in the white cultivars. The three agronomic traits were clearly grouped together by the developmental stages, regardless of any other traits, suggesting that the developmental stage is the most important factor that triggers global changes in gene expression. Interestingly, glutinous and nonglutinous black rice cultivars were distinguished from one another by different heading dates.
Introduction
The recent development of next-generation sequencing has led to an explosion in the number and diversity of different types of sequencing data, which have provided insight into numerous biological questions. 1 Genome resequencing can reveal genomic variation, evolutionary history, and population structure and can identify genomic loci responsible for phenotypic and physiological differences. 2 Similarly, RNA sequencing (RNA-seq) has been used to identify expressed genes, the networks among expressed genes, genetic variation, and regulatory genes. 3 Although these data types can be quite informative on their own, their integration is required for in-depth understanding of complex systems. 4
Rice (Oryza sativa L.) is a major staple food. Its cultivars are distinguished by various characteristics such as nutritional quality (eg, amylose content, antioxidant activity, etc.) and agronomic traits (eg, heading date). At the highest level, rice cultivars are typically divided into nonglutinous rice or glutinous rice, based on the proportion of glucose polymers present, such as linear polymer amylose and highly branched amylopectin. Nonglutinous rice grains contain a large amount of amylose, whereas glutinous rice grains (sticky or waxy rice) are distinguished by the presence of amylopectin, rather than amylose. Amylose synthesis is governed mainly by an allelic series of waxy (Wx) genes (including granule-bound starch synthase) 5 and by some unidentified non-Wx genes such as SSII–3. 6 Quantitative trait loci associated with amylose content have also been reported, but their molecular function has not been identified. 7
Black rice is a functional cultivar that is valued as a health-promoting food. Its black color is due to the accumulation of anthocyanin, the antioxidant properties of which play an important role in anticarcinogenic and anti-inflammatory activity, obesity control, and the alleviation of diabetes. 8 The anthocyanin biosynthetic pathway, which utilizes the middle steps of the flavonoid biosynthetic pathway, is one of the most extensively studied pathways involved in plant secondary metabolism.9,10 Various genes (eg, MYB, HLH, DFR, etc.) have been identified as important regulators of grain color in black rice.11–13 The Gramene portal (http://www.gramene.org/) reports that the rice genome contains 13 genes involved in anthocyanin biosynthesis, and the Kyoto Encyclopedia of Genes and Genomes (KEGG, http://www.genome.jp/kegg/) database reports that 14 orthologous gene groups are involved in the anthocyanin pathway. Heading date is a critical trait that affects the adaptation of a cultivar to different cropping locations and growing seasons and is thus the most important breeding objective. Genetic, molecular, and genomic approaches have uncovered more than 20 genes and quantitative trait loci involved in the regulation of heading time in multiple rice cultivars.14,15
Although the integration of genome resequencing data with RNA-seq data is expected to pinpoint regulatory genes more effectively, a methodology is required. To develop such a methodology, we chose rice cultivars with diversity in three important traits, anthocyanin biosynthesis, amylose content, and heading date. Here, we report the generation of genome resequencing and RNA-seq data and describe an analytic approach for integrating these two types of next-generation sequencing data for identifying the genes involved in the three important rice characteristics.
Materials and Methods
Rice materials and experimental design
Rice accessions used in this study.
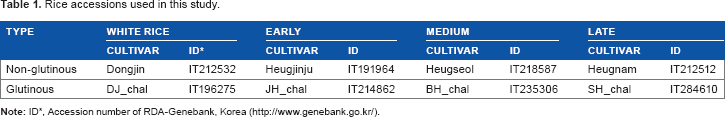
Accession number of RDA-Genebank, Korea (http://www.genebank.go.kr/).
Genome resequencing and reads mapping
For genome resequencing, a paired-end sequencing library was constructed using the TruSeq× DNA Sample Preparation Kit v2 (Illumina Inc.) and sequenced by an Illumina HiSeq 2000 (Illumina Inc.). The quality score distribution of each library was checked using the FASTX-Toolkit (http://hannonlab.cshl.edu/fastx_toolkit). If a sequenced base had a quality score lower than Q20, which indicates an accuracy of 99% for the base call, it was changed to “N”. Reads with less than 90 bp or with “N”s at more than 10% of their total base positions were removed. The filtered reads were mapped to the reference genome MSU Rice Genome Annotation Project Release 7 16 using CLC Assembly Cell software version 4.1 (CLC Bio) with the advanced options (95% identity and 90% coverage by high-scoring base pairs).
Detection of SNPs and InDels
SNPs and small insertions and deletions (InDels) in eight rice accessions were identified against the rice reference genome using the “find variations” function of the CLC Assembly Cell software with the following parameters: minimum depth = 5, minimum mismatch count = 3, and limit fraction ≥20%. To reduce erroneous SNP calls caused by mapping of reads to multiple regions in the reference genome, we filtered out the low-quality mapping regions that lacked 95% sequence identity and 100% coverage by high-scoring base pairs.
Population structure analysis with SNPs
We performed a population structure analysis using variation in SNPs with the FRAPPE program, which is based on the maximum likelihood method. 17 We generated PED files for the eight rice accessions using 10,000 iterations, considering cluster numbers (K) from 2 to 6. 2 To construct the phylogenetic tree, we calculated the genetic distances between the different accessions using SNPs. The neighbor-joining method was applied to construct the tree based on the distance matrix calculated by the PHYLIP version 3.695 program (http://evolution.genetics.washington.edu/phylip/). The graphical view of the phylogenetic tree was generated with FigTree v1.4 software (http://tree.bio.ed.ac.uk/software/figtree/).
Linkage disequilibrium analysis
Linkage disequilibrium (LD), the nonrandom association of alleles at two or more different loci, is a sensitive indicator of the population genetic forces that structure a genome. 18 We measured LD levels in each accession by calculating the correlation coefficient (r 2 ) of alleles with the Haploview program. 19 Parameters used were as follows: maxdistance, 1,000; dprime, 0.6; minGeno, 0.6; minMAF, 0.1; and hwcutoff, 0.001. We then used scripts written in R to plot averaged r 2 against pairwise marker distances.
Detection of selective sweeps
To detect genomic areas with selective sweeps driven by artificial selection, we calculated the reduction of diversity (ROD) based on the ratio of diversity between black and white rice accessions. ROD values were calculated with variables πblack (π value of black rice accessions) and πwhite (π value of white rice accessions) using the following equations:

Detection of putative genes using selective sweeps
At each detected SNP position, we counted the number of reads corresponding to the most and least frequently observed allele in each group.21,22 Manhattan plots for visualizing selective sweeps were generated using allele counts of identified SNP positions in 40 kb sliding windows along the genome, with a step of 20 kb. In order to display the putatively selected regions from the extreme tails, we applied a threshold of ZHp ≤ -3, where ZHp is the Z-transformed heterozygosity.
The pooled heterozygosity (Hp) was calculated with variables Nmax (reads number of most observed allele) and Nmin. (reads number of least observed allele) using the following equations:

ZHp for selective sweep values was calculated using the following equation:

Gene expression analysis
For the RNA-seq experiments, the quality of raw reads was checked with the FastQC program (http://www.bioinformatics.babraham.ac.uk/projects/fastqc/). Preprocessing of Illumina RNA-seq raw reads was conducted with the same method as that used for genomic resequencing.
The preprocessed reads were mapped to a rice reference genome, MSU Rice Genome Annotation Project Release 7, using the TopHat program, and gene expression levels were identified using Cufflinks with the default parameters. 23 The fragments per kilobase of transcript per million mapped reads (FPKM) score were calculated with the transcribed fragments. To compare the gene expression levels among samples, FPKM scores were subjected to global normalization and were used for further analysis. Principal component analysis (PCA) was performed with GeneSpring GX software 12.5 (Agilent Technologies). Functional associations were computed using the singular enrichment analysis (SEA) method with the normalized FPKM values and Gene Ontology (GO) categories. In the GO enrichment analysis, genes located in the selected regions were extracted from the rice gene annotation file (MSU_osa1r7, http://rice.plantbiology.msu.edu/index.shtml). GO enrichment analysis was conducted through agriGO (http://bioinfo.cau.edu.cn/agriGO/) with a significance level of P ≤ 0.05 and the O. sativa species option. 24
Accession codes
The resequencing data have been deposited in EMBL-EBI (http://www.ebi.ac.uk) under the accession numbers: ERP009995 (Heugjinju), ERP009996 (Heugseol), ERP009997 (Heugnam), ERP009998 (JH_chal), ERP009999 (BH_chal), ERP010000 (SH_chal), ERP010001 (Dongjin), and ERP010002 (DJ_chal). In addition, the 24 RNA-seq data sets have been deposited in EMBL-EBI with accession numbers from ERP009858 to ERP009904.
Results and Discussion
Genome resequencing
Aiming to more effectively and precisely identify genes that regulate a particular trait, we sought to establish an analysis process that integrates both genome resequencing and RNA-seq. Considering the growing interest in its nutritional value and the lack of knowledge about it relative to white rice, several black rice cultivars, with variation in agronomic and nutritional features, were selected to test our screening procedure. Six black rice accessions were categorized by their two most important characteristics, namely, heading date (ie, early, medium, or late maturing) and grain amylose content (ie, glutinous or nonglutinous), as shown in Table 1. Two white rice accessions with either high or low grain amylose content were also included. The proposed multilayer screening procedure was then used to pinpoint regulatory genes for black color (ie, anthocyanin biosynthesis), amylose content, and heading date.
Statistics of identified SNPs and InDels.

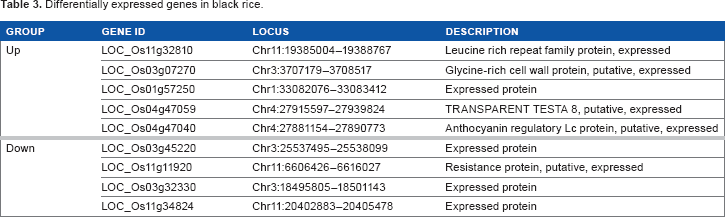
Differentially expressed genes in black rice.
Variation among the rice genomes
Genomic variation was determined across the eight rice accessions. On average, SNPs accounted for 88.6% of all polymorphisms, followed by deletions and insertions (Table 2). In terms of SNP and InDel genotypes, homozygous genetic variation (80.4%) was more abundant than heterozygous variation (Table 2). White rice accessions (Dongjin and DJ_chal) showed less genomic variation against the rice reference genome, compared with the six black rice accessions (Table 2). We focus here on the predominant type of genomic variation, SNPs, and not on InDels. We identified a total of 1,241,646 unique SNPs (Table 2). Most SNPs were located in intergenic regions, and 15.5% of the SNPs were located in coding sequence (CDS) regions (Supplementary Table 4). Among the latter, synonymous SNPs (ie, SNPs that do not change the protein sequence) were more common than nonsynonymous SNPs (ie, SNPs that change the protein sequence), and synonymous SNPs represented 52.1% of the total number of SNPs (Supplementary Table 4). Although the total number of SNPs was higher in black rice than in white rice, the number of nonsynonymous SNPs was not proportionately increased in black rice (Supplementary Table 4).
Inference of population structure
To accurately investigate rice population structure using variation in SNPs, we removed SNPs that were located in the genomic regions with low-depth sequencing coverage in each rice cultivar. From the 2,130,187 initial high-quality SNPs, we selected 981,808 SNPs for population analysis. We estimated the population structure of the individual rice cultivars using the FRAPPE program.
17
With the assumption that K clusters exist, individuals within populations were divided into K groups based on a maximum likelihood method. Here, ancestry was analyzed by increasing K from 2 to 6. From K = 4, white rice accessions (Dongjin and DJ_chal) were distantly separated from black rice accessions (Fig. 1A). Black rice cultivars with late heading dates (Heugnam and SH_chal) were clustered together (Fig. 1A). Although JH_chal and Heugseol differ in heading date and grain amylose content, the two black accessions formed a separated group from K = 3 (Fig. 1A). Phylogenetic tree analysis resulted in similar conclusions about population structure. The white accessions had the greatest distance from the black accessions (Fig. 1B). In addition, JH_chal, Heugseol, and SH_chal/Heugnam showed a high degree of relatedness (Fig. 1B).
Population structure of eight rice accessions and the rice reference genome. (A) Results of a population structure analysis using the FRAPPE program with 981,808 high-quality sNPs. Each accession is represented by a vertical bar. (B) A neighbor-joining phylogenetic tree of the rice genomes based on SNPs. The phylogenetic tree was generated with 1,000 bootstrap repetitions, and all nodes were clustered with bootstrap values.
To identify statistical associations between alleles at different loci, we estimated the LD for the distinct groups. For LD plots, we calculated the r 2 value, defined as the correlation coefficient of SNP frequencies, between pairs of SNPs. We observed that LD decayed more slowly in the white group than in the black group, and in the glutinous group than in the nonglutinous group. However, we did not obtain significant results for the population genetics analysis due to our small sample size. The genetic distance among rice accessions decreases with increasing sample sizes. The coefficient of variation for estimates of genetic distance decreases with increasing sample sizes. 25 Hence, accurate analyses of population genetics are not possible with a small sample size. 26
Detection of putative genes using selective sweeps
It has been suggested that genomic regions that confer agriculturally favorable traits have low levels of variation and biased allele frequency spectra, due to prolonged domestication and breeding.
2
Similarly, by comparing SNP levels, for example, between black and white rice, genomic regions that show low levels of single nucleotide variation only in black rice cultivars would be expected to contain genes that are favorably selected in black rice, such as anthocyanin biosynthesis genes. That is, they would show evidence of selective sweeps. To detect selective sweeps driven by artificial selection, we used SNPs to calculate the ROD score in every nonoverlapping window of 40 kb along the entire genome, with a step of 20 kb. We then plotted the scores only for the genomic regions that showed positive values for πblack, πwhite, and ROD (Fig. 2A). πblack and πwhite represent summary statistics for measuring genetic diversity in black and white rice populations, respectively. The significant outlier regions (ie, with a right tail π ≤ 0.01) were identified as our putative loci. The genomic regions in chromosome 10 showed the biggest differences in outlier genes between white and black rice accessions (Fig. 2A). Our catalogued regions possibly include either key genes responsible for black rice-specific characteristics or genomic regions selectively kept in black rice. The efficiency of this method was verified by conducting the same analysis with additional comparisons. Glutinous vs. nonglutinous black rice accessions were compared (Supplementary Fig. 1A), as were black rice cultivars with different heading dates (Supplementary Fig. 1B).
Variation in heterozygosity in selective sweep regions in chromosomes 1-12. (A) The ROD score was calculated for the rice group in chromosomes 1-12. The significant outlier regions (ie, with right tail π ≤ 0.01) are shown in blue for the white group and red for the black group. (B) The ZHp score for the black group against the white group is shown in this Manhattan plot. (C) The ZHp of the glutinous and nonglutinous groups against the white group is shown in this Manhattan plot.
In order to effectively present the regions showing evidence of selective sweeps across all chromosomes, the ROD distribution was replotted in a Circos diagram using 5-kb windows, along with gene density (Fig. 3). Comparison between black and white rice accessions showed that intensive selective sweeps occurred in chromosomes 3, 10, and 12 (Fig. 3). Amylose content was analyzed by comparing glutinous and nonglutinous black rice accessions with the respective white accessions (Supplementary Fig. 2). Glutinous rice showed a very strong signal for a selective sweep in chromosome 11, whereas nonglutinous rice showed evidence of selective sweeps of varying intensities across all chromosomes (Supplementary Fig. 2). Finally, black rice cultivars with a late heading date showed evidence of selective sweeps throughout all chromosomes, compared with their white control (Supplementary Fig. 3).
Circos diagram showing the ROD pattern among rice groups. The Circos diagram was generated with a 5-kb window. The outer ring shows gene density calculated across all chromosomes. Regions with significant ROD scores are shown in the next ring with their ROD values. ROD = 1 - (πblack/πwhite), where πblack is the π value of the black group and πwhite is the π value of the white group.
To detect the putative genes located in the genomic areas that showed evidence of selective sweeps, the distribution of ZHp was plotted along chromosomes 1-12 (Fig. 2B and C). Because the genes in the populations are complex and an extremely low ZHp value indicates a selective sweep, we focused on genomic windows with a ZHp score of -3 or lower. In the black rice population, we observed that LOC_Os04g25400, an uncharacterized protein, was the only locus that is located in the significant outlier regions (Fig. 2B). For glutinous and nonglutinous rice accessions, we found that 21 and 18 genes passed the threshold ZHp score, respectively (Fig. 2C and Supplementary Table 5). When the threshold score for ZHp was set to -4 (ie, ZHp ≤ -4), we did not find candidate genes that showed a strong selective sweep signal, except for some genes in the glutinous population. Presumably, the small population size resulted in the underestimation of the actual heterozygosity level. Because the detection of selective sweeps based on genomic SNP data is complicated by the intricacies of the schemes used to discover the SNPs, the possible mechanisms of the selective sweep, and the effects of the sample size, the small sample size in our analysis likely makes the results of the analysis flawed. 27 Those findings demonstrate that the selection pressures associated with crop–domestication regimes can exceed by one or two orders of magnitude than those observed for genes under even strong selection in natural systems. 28 Nevertheless, these selected gene candidates, found through selective sweep analysis, provide useful guidance for rapidly identifying genes with agronomic significance.
Functional association using gene expression data
We performed a total of 24 nonreplicated RNA-seq experiments with eight rice accessions at three developmental stages (ie, 5, 10, and 15 days after heading). Using TopHat/Cufflinks, the expression levels for 42,699 unique transcripts in rice were quantified with FPKM values for 24 samples. In order to globally compare the effects of four factors (rice grain colors, amylose content, natural heading date, and developmental stages) on gene expression, PCA was conducted using FPKM values. In the PCA, most of the samples were divided into three groups. Developmental stage (ie, 5, 10, or 15 days after heading) was the most important factor distinguishing the three groups (Fig. 4). Samples from the earliest developmental stage (five days after heading) were clearly grouped together, regardless of any other traits of the rice accessions, whereas those from other stages were somewhat intermixed together (Fig. 4), suggesting that developmental stage is the most significant factor that triggers global changes in gene expression.
Three-dimensional PCA with RNA-seq data. Global expression analysis resulted in 24 samples that were clustered into three groups. Each color represents a different rice accession. The shape represents different developmental stages (ie, square: 5 days, triangle: 10 days, circle: 15 days after heading date).
By a comparison between black and white groups, we identified differentially expressed genes (DEGs) with more than a two-fold change between groups. After DEGs in all developmental stages were searched separately in glutinous and nonglutinous subgroups, common DEGs in both analyses were identified (Supplementary Table 6). Of the 131 DEGs, we ultimately found five upregulated and four downregulated genes in black rice accessions (Table 3 and Supplementary Table 6). As expected, due to their high accumulation of anthocyanin, the LOC_Os04g47040 gene, which encodes anthocyanin regulatory Lc protein, was upregulated in black cultivars (Table 3).
To provide valuable insight into the functional associations of the 131 DEGs for black rice cultivars, enrichment analysis was conducted with FPKM values and GO categories using the SEA method (P value ≤ 0.05). Three GO terms – secondary metabolic process, biosynthetic process, and response to stimulus – were found to be significantly enriched in the upregulated genes in black rice accessions, while no enrichment was detected in the downregulated genes (Supplementary Table 7).
Comparison of SNP structure and gene expression
In order to integrate genome resequencing and RNA-seq data, we analyzed the expression levels of genes containing genetic variation in the form of SNPs. First, the number of CDS-located SNPs that were shared in rice subgroups with a particular feature was counted. For example, all of the black and all of the white rice accessions contained 496 and 1,127 SNPs in CDS regions, respectively. Second, SNPs were divided into synonymous and nonsynonymous SNPs. In black rice cultivars, the total number of synonymous and nonsynonymous SNPs was 248 (Supplementary Tables 8 and 9). In black and white rice cultivars, synonymous SNPs were more abundant in white rice varieties, whereas non-synonymous SNPs were more frequent in black rice varieties (Supplementary Tables 8 and 9). Although the above analysis for population structure revealed that the six black accessions were more distant from the reference rice than the two white rice accessions, counting SNPs that co-occurred in six cultivars but not in two cultivars would result in fewer synonymous SNPs in black accessions. Third, we analyzed the functional associations of genes with nonsynonymous SNPs, motivated by the significant influence that nonsynonymous SNPs can have on protein structure and function, and in turn, on phenotype. 29 With the SEA method, six GO terms were found to be enriched (P value ≤ 0.05) for the black rice group (Supplementary Table 10), while 21 relevant GO terms were enriched for the white rice group (Supplementary Table 11). Finally, we examined the transcript expression of genes with nonsynonymous SNPs in all eight rice cultivars during three developmental time points.
SNPs can be used in association analyses to identify candidate genes for use as functional markers of stress tolerance in rice. SNPs can also be used to define the genetic structure of populations as well as the diversity and differentiation between rice populations, particularly with regard to adaptation to different ecological habitats. 30 The public availability of genomic and expressed sequence tag sequences of multiple rice genotypes has enabled the identification of many SNPs. 31 Using whole-genome resequencing data and the RNA-seq data in rice, we identified candidate genes that might be related to macronutrient transport and flavonoid pathways including anthocyanidin biosynthesis. 32
When plotted with the normalized expression level, the LOC_Os01g43980 and LOC_Os01g43990 genes, which contained black rice-specific SNPs, were observed to be upregulated at the studied developmental periods in the black group (Supplementary Fig. 4A). Conversely, the LOC_Os03g44870, LOC_Os11g11770, and LOC_Os11g11810 genes were downregulated in the black group (Supplementary Fig. 4B). Among genes with white rice-specific nonsynonymous SNPs, the LOC_Os01g57310 and LOC_Os07g02490 genes were downregulated at all time points only in the white rice group (Supplementary Fig. 5). We did not detect any upregulated genes in the white rice group.
We identified seven DEGs with selected nonsynonymous SNPs in the black and white groups (Supplementary Table 12). Although hundreds of genes with nonsynonymous SNPs were detected in the black rice group, a relatively small number of genes exhibited the unique expression patterns shown in Supplementary Figures 4 and 5, whereby changes in amino acids did not change expression levels. Rather, genetic variation in protein-coding genes appears to have influenced posttranslational events, such as protein modification, protein–protein interaction, and turnover, which would cause the phenotypic differences between black and white rice accessions, such as in anthocyanin biosynthesis. Although we did not address SNPs located in intergenic regions, such as promoters, these likely play an important role in black and white rice phenotypic differences, both via the recognition of cis-acting elements in promoters by transcription factors and via changes in the transcription of black rice-specific genes.
Conclusion
We developed a multilayered screening method that combines both whole-genome resequencing and RNA-seq to identify genes that regulate specific phenotypes in plants. For eight rice accessions with differences in anthocyanin biosynthesis, amy-lose content, and heading date, we generated genome sequence and RNA-seq data at three developmental stages. A total of 98% of our preprocessed genome resequencing data could be uniquely mapped to the reference genome, producing an average coverage depth of 40.0×. The 24 nonreplicated RNA-seq experiments identified the 42,699 unique transcripts.
We were able to detect genomic variation, understand the population structure and LD, and detect genes that likely regulate the phenotypic differences between black and white rice varieties. Comparison between black and white rice cultivars showed that intensive selective sweeps occurred in chromosomes 3, 10, and 12. We identified three GO terms (secondary metabolic process, biosynthetic process, and response to stimulus) associated with 131 DEGs in the black rice cultivars. Our comparisons of the SNP structure and gene expression among the eight rice cultivars suggested that SNPs likely play an important role in determining the phenotypic differences between black and white rice cultivars. The expression patterns of genes containing selected nonsynonymous SNPs revealed two upregulated genes at three developmental time points and three downregulated genes at three developmental time points in the black cultivars and two downregulated genes at three developmental time points in the white cultivars. Integration of transcriptomic data further narrowed down the catalogue of genes involved in anthocyanin biosynthesis. Our method was additionally tested by searching for genes responsible for amylose content and heading date.
The three agronomic traits (rice grain colors, amylose content, and natural heading date) were clearly grouped together by the developmental stages, regardless of any other traits, suggesting that the developmental stage is the most significant factor that triggers global changes in gene expression. Especially, glutinous and nonglutinous black rice cultivars were identified by different heading dates. Although the identified genes require experimental validation and an increased sample size would be helpful for analyzing population structure, our study demonstrates the potential of this screening method to identify genes underlying biological phenomena.
Author Contributions
Developed and wrote the code for the manuscript: C-KK, Y-JS. Verified and advised on the design and features of manuscript: SYW, YS, J-YL. Provided overall scientific and technical guidance and assisted with the creation of the manuscript: J-SC, Y-KK. All the authors contributed to the writing and improvement of the manuscript and read and approved the final version.
Abbreviations
linkage disequilibrium
reduction of diversity
Z-transformed heterozygosity
principal component analysis
fragments per kilobase of transcript per million mapped reads
singular enrichment analysis.
Supplementary Material
Supplementary Table 1
Generation and preprocessing of raw sequencing data. Note: aThe percentage of reads left after preprocessing.
Supplementary Table 2
Preprocessing of raw sequencing reads.
Supplementary Table 3
Summary of genome resequencing and read mapping onto reference genome. Note: aThe rate of zero coverage on one site.
Supplementary Table 4
Statistics of genomic locations and types for SNPs found from genome resequencing of eight rice accessions. Notes: The synonymous SNPs in the CDS region. bThe nonsynonymous SNPs in the CDS region.
Supplementary Table 5
The list of genes with the significance level of ZHp ≤ -3.0 for glutinous and nonglutinous rice accessions.
Supplementary Table 6
The number of upregulated and downregulated genes in black rice groups.
Supplementary Table 7
Singular enrichment analysis with 73 upregulated genes in black rice accessions. Note: P, biological processes.
Supplementary Table 8
The number of genes with synonymous SNPs detected in each phenotypic category. Notes: 1* means the SNP exists, and 0 means the SNP does not exist.
Supplementary Table 9
The number of genes with nonsynonymous SNPs detected in each phenotypic category. Notes: 1* means the SNP exists, and 0 means the SNP does not exist.
Supplementary Table 10
Singular enrichment analysis with 248 black rice-specific genes containing nonsynonymous SNPs using GO terms. Notes: P, biological processes; F, molecular function.
Supplementary Table 11
Singular enrichment analysis with 80 white rice-specific genes containing nonsynonymous SNPs using GO terms. Notes: P, biological processes; F, molecular function; C, cellular component.
Supplementary Table 12
The list of differentially expressed genes with selected nonsynonymous SNPs in the black and white groups.
Supplementary Figure 1
The graph shows the ROD values that were calculated on chromosomes 1-12. (a) The significant outlier regions (ie, those with right tail π ≤ 0.01) for the glutinous and nonglutinous groups. (b) The significant outlier regions (ie, those with right tail π ≤ 0.01) for the early, medium, and late developmental-stage groups.
Supplementary Figure 2
Circos diagram of the ROD patterns between the glutinous and nonglutinous groups. Abbreviations: G, glutinous group; W, white group (control); N, nonglutinous group; ROD (G/W), ROD between glutinous and white groups; ROD (N/W), ROD between nonglutinous and white groups.
Supplementary Figure 3
Circos diagram of the ROD patterns between the late stages among three developmental time points in the rice groups.
Supplementary Figure 4
Patterns of gene expression determined with selected nonsynonymous SNPs in the black group. The X-axis represents the 24 rice samples. B1-B18: six black rice accessions with three developmental stages, W1-W6: two white rice accessions with three developmental stages. (a) The two upregulated genes are shown at three developmental time points in the black group. (b) The three downregulated genes are shown at three developmental time points in the black group. B, six black rice with three time stages; W, two white rice with three time stages.
Supplementary Figure 5
The graph of the specific pattern of gene expression using selected nonsynonymous SNPs of the white group. The two downregulated genes show three developmental time points in the white group. Notes: B, six black rice with three time stages; W, two white rice with three time stages.