
Abstract
Lineage-specific genes can contribute to the emergence and evolution of novel traits and adaptations. Tardigrades are animals that have adapted to tolerate extreme conditions by undergoing a form of cryptobiosis called anhydrobiosis, a physical transformation to an inactive desiccated state. While studies to understand the genetics underlying the interspecies diversity in anhydrobiotic transitions have identified tardigrade-specific genes and family expansions involved in this process, the contributions of species-specific genes to the variation in tardigrade development and cryptobiosis are less clear. We used previously published transcriptomes throughout development and anhydrobiosis (5 embryonic stages, 7 juvenile stages, active adults, and tun adults) to assess the transcriptional biases of different classes of genes between 2 tardigrade species, Hypsibius exemplaris and Ramazzottius varieornatus. We also used the transcriptomes of 2 other tardigrades, Echiniscoides sigismundi and Richtersius coronifer, and data from 3 non-tardigrade species (Adenita vaga, Drosophila melanogaster, and Caenorhabditis elegans) to help identify lineage-specific genes. We found that lineage-specific genes have generally low and narrow expression but are enriched among biased genes in different stages of development depending on the species. Biased genes tend to be specific to early and late development, but there is little overlap in functional enrichment of biased genes between species. Gene expansions in the 2 tardigrades also involve families with different functions despite homologous genes being expressed during anhydrobiosis in both species. Our results demonstrate the interspecific variation in transcriptional contributions and biases of lineage-specific genes during development and anhydrobiosis in 2 tardigrades.
Keywords
Introduction
New genes have frequently been associated with the evolution of taxon-specific traits and adaptations.1-3 For some time after their emergence, new genes are restricted to a single lineage and are often referred to as “lineage-specific genes” (LSGs). Such young genes are typically expressed at lower levels than older genes, with a high proportion expressed in specific tissues and developmental stages.2,4 In animals, new genes are often testis-biased,5 -9 and it has been suggested that LSGs play an important role in the developmental divergence between species.10,11 The analysis of expression profiles throughout development in C. elegans found an enrichment of younger genes in late embryogenesis, 11 while in slime molds LSGs were found predominantly biased during the middle stages of development. 12 But compared to tissue-specific expression, very little is known regarding expression bias of new genes across developmental stages and physiological states, or how this varies among species.
Tardigrade genomes have been found to possess different assemblages of stress-related gene pathways, suggesting the acquisition of species-specific molecular adaptations. 13 Tardigrade are known for displaying an impressive ability for cryptobiosis by entering an anhydrobiotic (“tun”) stage that allows them to tolerate extreme temperatures, 14 radiation, 15 and desiccation. 16 Species differ in their propensities and properties of anhydrobiosis, for example Hypsibius exemplaris needs some pre-conditioning in high humidity conditions for survival in tun, whereas the more resilient Ramazzottius varieornatus can quickly enter tun at low relative humidity.15,17,18 Genomic analyses have revealed tardigrade-specific genes associated with extreme stress tolerance such as extensive expansions of superoxide dismutases and peroxiredoxin families.13,17 But several previously identified tardigrade-specific genes are missing in some tardigrade lineages suggesting that additional genes are involved in cryptobiosis (anhydrobiosis) across the phylogeny or that different molecular machinery has evolved in different tardigrade lineages.13,19 While most of the focus on tardigrade-specific genes has been on their involvement in tolerance to environmental stresses, it remains unclear the degree to which lineage-specific genes are expressed throughout tardigrade development, and whether expression biases of LSGs converge among species.
In this study we characterize gene expression biases throughout tardigrade development and the tun stage in 2 tardigrade species with annotated genomes, H. exemplaris (formerly referred to as H. dujardini 20 ) and R. varieornatus, and test whether lineage-specific genes contribute to interspecific differences in ontological transcription. We identify lineage-specific and tardigrade-specific genes using publicly available transcriptomes from 2 other tardigrades, Echiniscoides sigismundi and Richtersius coronifer, as well as 3 non-tardigrade outgroup species. Expression levels and specificity are determined for each gene across 14 life stages: embryos (eggs) between 1 and 5 days after laying, juveniles between 1 and 7 days after hatching, and in mature adults both in active conditions and in tun state. Expression bias was compared among genes and between species to determine the transcriptional contributions of lineage-specific genes across development and during cryptobiosis.
Methods
Gene family identification
Protein sequences from 7 species were used to identify and classify orthologs, paralogs, and their corresponding gene families among tardigrade genomes. The species used were the 2 focal tardigrade species, Hypsibius exemplaris (He) and Ramazzottius varieornatus (Rv), 2 additional tardigrades Echiniscoides sigismundi (Es) and Richtersius coronifer (Rc), and 3 non-tardigrade outgroup species including the rotifer Adenita vaga (Av), the arthropod Drosophila melanogaster (Dm), and the nematode Caenorhabditis elegans (Ce). The list of proteins for He and Rv were downloaded from the Ensembl tardigrade server http://ensembl.tardigrades.org 17 in the summer of 2021 (20 076 proteins from He and 13 920 proteins from Rv), along with their genomes (Hd.3.1.5 and Rv101) and corresponding annotation (GFF3) files. The data from the 2 additional tardigrades Es and Rc were acquired from a previous study by Kamilari and colleagues. 13 The proteins for Av were downloaded from Ensembl Metazoa v52, 21 whereas UniProt was used for Dm (UP000000803) and Ce (UP000001940). Protein sequences were used to determine gene families (orthogroups) using Orthofinder v2.5.4 22 and to infer the species phylogeny using MAFFT 23 and IQ-TREE 24 within Orthofinder. 25 We used default values in Orthofinder, including an MCL inflation value of 1.5 that was also used in the first genomic comparison between tardigrades by Yoshida et al. 17 An inflation value of 3.0 was tested for comparison and results were reported below when there were differences with the default inflation value of 1.5.
Gene family classification
Based on the orthogroup information from Orthofinder, genes were categorized into age groups to identify lineage-specific genes and duplications from the point of view of the 2 tardigrades He and of Rv. First, genes were identified as being singletons or duplicated based on the presence of paralogs. Next, genes were sorted based on whether non-tardigrade outgroup species had orthologs (shared genes), whether only other tardigrades had orthologs (tardigrade-specific genes; TSG), or whether the gene had no orthologs detected (lineage-specific genes; LSG). Gene family expansions were assigned when a gene had more paralogs than it did orthologs in all 3 of the non-tardigrade outgroups combined.
Gene expression
Transcriptome data across developmental stages and physiological states were acquired for the 2 tardigrade species He and Rv from previous work17,26 describing transcription in embryos (eggs 1-5 days after laying), juveniles (1-7 days after hatching), active adults, and tun (anhydrobiotic) adults (Supplemental Table S1). In the original study by Yoshida et al, 17 Rv individuals were induced into anhydrobiosis by both fast and slow desiccation, but here we only used the slow desiccation data. The raw reads were trimmed using default settings in Trim Galore, 27 followed by mapping with STAR 28 against the respective tardigrade genomes. The number of reads mapping to genes was determined using featureCounts. 29 Data were imported in R v4.0.3, 30 where read counts were converted to transcript per million (TPM) by dividing the length-normalized transcript count for each gene (read counts divided by gene length) by the sum of length-normalized transcript counts across all genes multiplied by a million. The mean expression from 3 replicates was calculated for each developmental stage and adult condition (active vs tun) per species. Genes that had TPM < 1 in all samples were excluded from analyses. Gene expression variation was assessed across developmental stages and physiological states. Plots in R were generated using ggplot2. 31
Gene expression specificity, bias, and differential expression
Gene expression specificity was calculated using the tissue-specificity measure tau, 32 here adopted for specificity across developmental stages and adult physiological states. Genes with tau values in the top 5% of all genes were labeled as biased in the stage or state where they were most highly expressed. In each species, 95% of these biased genes had at least twofold the expression in the biased stage or state as any other developmental stage or state. Differential gene expression between tun and active adults was carried out using DESeq2 33 on the read counts from featureCounts. Genes were identified as differentially expressed (DE) based on FDR-adjusted P-value < .01 and an absolute fold change >2.
Gene ontology enrichment analysis
Gene ontology (GO) terms for tardigrade genes were acquired with Blast2GO v6.0.3 34 using the full list of protein sequences, resulting in 11 744 He genes and 10 465 Rv genes with associated GO terms. GO enrichment analysis of gene groups (biased genes, lineage-specific genes, gene family expansions, and differentially expressed genes) was assessed using topGO v2.42.0, 35 with significantly enriched GO terms identified from the weight01 algorithm with a FDR-corrected P-value < .05.
Results and Discussion
Gene orthogroup analysis across 4 tardigrade species and 3 non-tardigrade outgroups agrees with the results from Yoshida et al. 17 that Hypsibius exemplaris (He) has a greater number and proportion of lineage-specific genes and gene duplications than does Ramazzottius varieornatus (Rv), but both species have about the same number of singleton genes belonging to orthogroups (Table 1).
Orthogroup membership of genes in Hypsibius exemplaris (He) and Ramazzottius varieornatus (Rv) using an Orthofinder clustering inflation value of 1.5.

Almost one-third of all genes (31%) belong to tardigrade-specific orthogroups, whereas species-specific (herein called lineage-specific) genes make up 34% of genes in He compared to 21% in Rv. We categorized genes into 6 categories, first whether they were singletons versus duplicated genes (paralogs), and then according to whether the gene had orthologs in at least 1 of the 3 non-tardigrade outgroups (shared), only orthologs in other tardigrades (tardigrade-specific genes; TSGs), or no orthologs (lineage-specific genes; LSGs). After excluding genes with low expression in all developmental stages and adult physiological states (TPM < 1), which filtered numerous LSGs and tardigrade-specific paralogs that did not meet these expression thresholds, He had about 3000 more expressed genes than Rv that were included in our analyses (Table 2).
Number of expressed genes according to their orthologs and paralogs in Hypsibius exemplaris (He) and Ramazzottius varieornatus (Rv).

Singletons and paralogs were identified from Orthofinder with an inflation value of 1.5 and divided into genes with orthologs in non-tardigrade species (shared), orthologs in only tardigrade species (TSG), or no orthologs (LSG).
Lineage-specific genes differ in their developmental stage-specificity between species
Low levels of gene expression and high expression specificity are often observed in new genes, rapidly evolving genes, and diverged duplicated genes that have evolved new functions.5,6,9,36 Meanwhile, older genes tend to be more highly and broadly expressed, which is a feature of genes with conserved expression across species. 37 In tardigrades, we found that LSGs were lower expressed than tardigrade-specific and shared genes (Mann-Whitney U-test P-value < 2.2e-16). Lineage-specific genes also had higher expression specificity (tau) than tardigrade-specific and shared genes in both species (Mann-Whitney U-test P-value < 2.2e-16). Paralogs consistently had lower average expression levels than singletons in each age category (Figure 1A) and higher overall expression specificity compared to singletons (Mann-Whitney U-test P-value: He = 5.9e-15 and Rv < 2.2e-16). However, lineage-specific paralogs had either lower (He) or the same (Rv) levels of expression specificity as lineage-specific singletons (Figure 1B). When separating by the developmental stage and physiological state in which a gene is most highly expressed, LSGs had narrower expression than non-LSGs in both species in all but one case (Mann-Whitney U-test FDR-corrected P-value < .05 in all comparisons except P = .062 in day 6 juveniles in Rv). This is in agreement with high expression specificity of LSGs during the development of Dictyostelid slime molds. 12 This trend is mostly driven by the broad expression of shared genes: LSGs were always significantly more narrowly expressed compared to shared genes (Mann-Whitney U-test FDR-corrected P-value < .05) but only sometimes compared to tardigrade-specific genes (Figure 2). LSGs were significantly more narrowly expressed than TSGs in both species in 4 comparisons: first day egg, first day juveniles, and in both active and tun adults.
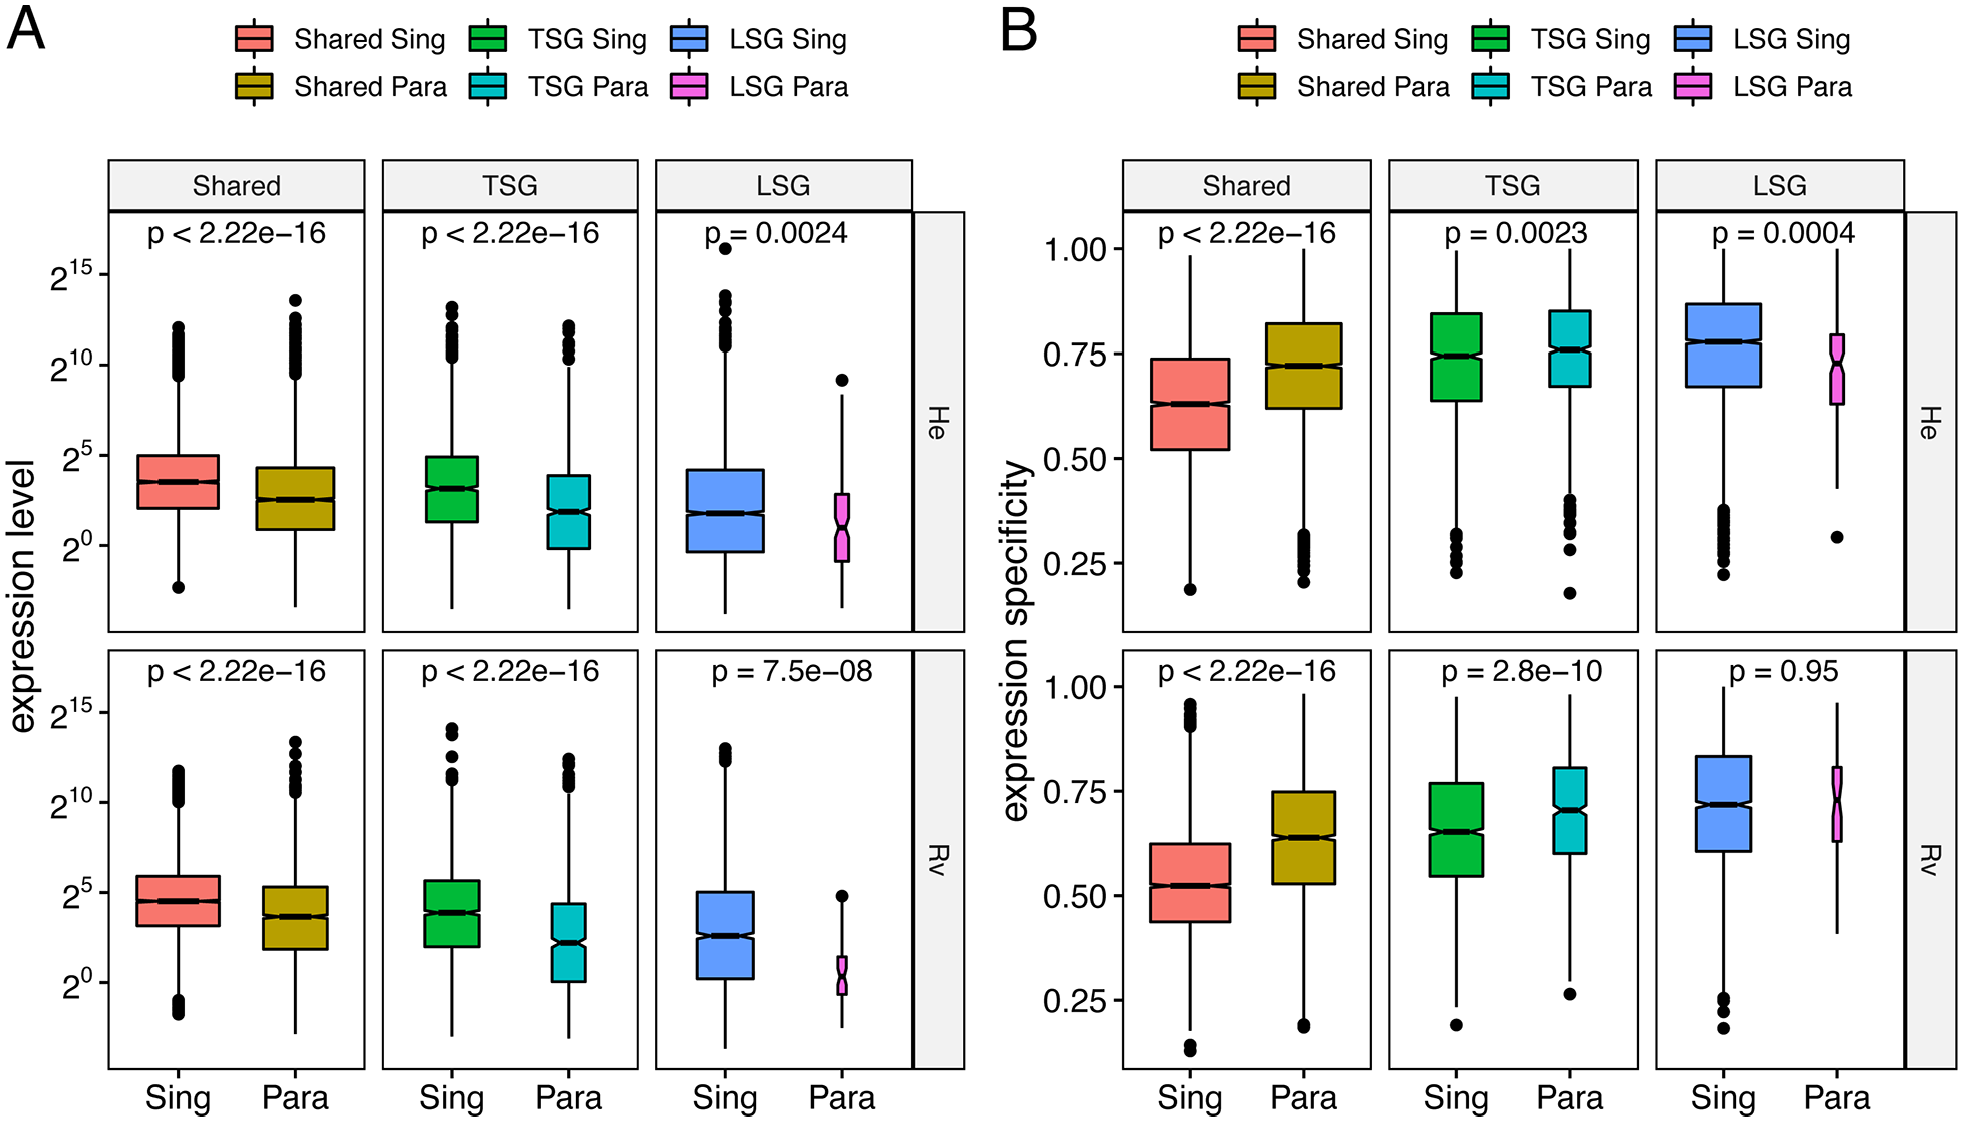
Expression profiles across gene categories in H. exemplaris (He) and R. varieornatus (Rv): (A) average expression level and (B) expression specificity differences between singletons (Sing) and paralogs (Para) within shared genes, tardigrade-specific genes (TSGs) and lineage-specific genes (LSGs). The boxplot notches indicate the median, and Mann-Whitney U-test P-values are shown for pairwise tests.

Expression specificity of genes measured across all developmental stages. Genes were assigned to the developmental stage or physiological state in which they are most highly expressed. The data are from embryos (eggs) 1 to 5 days after laying, juveniles 1 to 7 days after hatching, and adults (active and tun stages). The boxplot notches indicate the median, and Mann-Whitney U-test FDR-corrected P-values < .05 are shown with asterisks for pairwise tests between LSGs and shared genes, and between LSGs and TSGs.
Across all gene categories, we observed that genes expressed highest in early embryogenesis and in adults have relatively high expression specificity in both species, for both singleton and duplicate genes (Supplemental Figure S1). In other words, genes most highly expressed in juveniles tended to have broader expression throughout development, although the middle of the juvenile stages of development (fourth day and fifth day after hatching) also displayed high specificity in both species followed by a drop in specificity levels. The similarity in these trends between tardigrade species was somewhat surprising given that they are known to differ in both hatching timing and transcriptional initiation of conserved molting pathways during development, as determined using this same transcriptomic dataset. 26 But the species did differ in how gene age groups contributed to the developmental transcriptome. In He, shared singletons were overrepresented with expression specificity at the extremes of developmental stages, and lineage-specific singletons were overrepresented in the middle period of development (Supplemental Figure S2). In comparison, proportional representation of gene age categories among Rv developmental stages was less pronounced, with generally more shared singletons and fewer LSGs that were stage-specific at most time points. The variation in the extent to which gene age is associated with expression across developmental stages among species has also been found in other animals and fungi.4,38,39 Our findings suggest that LSGs in He play different roles during development than LSGs in Rv.
Developmental gene expression bias differs by gene age and by species
Expression specificity was used to identify “biased genes” that were predominantly expressed in a single developmental stage or physiological state. Among the most extreme biased genes, as defined as genes in the top fifth percentile of expression specificity (tau), the majority were specific to embryo and adult stages while underrepresented among juveniles (Table 3; Supplemental Table 2).
Number of biased genes (tau in the 95th percentile) per developmental stage and state.

As the level of gene expression specificity increased, both species had relatively consistent proportions of stage- and state-specific genes within gene categories, with the exception of lineage-specific paralogs that displayed variable distributions of expression specificity across developmental stages (Supplemental Figure S3). However, when a MCL inflation value of 3.0 was used instead of the default of 1.5 to generate orthogroups in Orthofinder, the expression specificity of LSG paralogs across development was similar to LSG singletons. With the focus on biased genes, there were marked differences between He and Rv; biased genes in the 3 earliest embryo stages and tun adults in He made up over 80% of all biased genes, whereas Rv had comparatively more biased genes in active adults (17%) and the latest embryonic stage (19%). However, since He eggs hatch on average 2 days earlier than Rv eggs, 26 the observed difference in timing when biased genes are most highly expressed might in fact reflect matching ontogenetic expression between species. Similarly, Rv active adults likely already express genes important for anhydrobiosis,15,17 unlike He, therefore enrichment of biased genes in He tun adults and Rv active adults might not be biologically different. However, none of the biased genes in He tun adults belonged to the same orthogroups as biased genes in Rv active adults, and only 13% (He) and 18% (Rv) of biased genes overall share orthogroups across species indicating that most biased genes are different among the species. In He, the high expression bias in the first 3 embryo stages was found in all gene categories except for lineage-specific paralogs, where biased LSG paralogs are enriched in tun (Figure 3A) despite having on average lower expression specificity than LSG singletons (Figure 1B). In contrast, expression bias in Rv was more scattered across developmental stages, in which singletons had high proportions of biased genes in active adults, and LSGs were particularly biased in the first embryonic stage (Figure 3B). Lineage-specific singletons in He but not Rv were found to be the main contributors to expression bias in juvenile developmental stages (Supplemental Figure S4A). In both species, shared singletons are largely underrepresented among biased genes (Chi-Square test P-value < 2.2e-16), whereas LSG singletons are highly overrepresented (Chi-Square test P-value < 2.2e-16) but to a lesser extent in Rv (Supplemental Figure S4B). When an inflation value of 3.0 was used to generate orthogroups, LSG paralogs also contributed to expression bias in juvenile stages in addition to LSG singletons, and were significantly overrepresented among biased genes in both species (Chi-Square test P-value < 2.2e-16). These results support recent findings from slime molds, in which shared singletons were underrepresented among biased genes whereas LSGs (as well as shared paralogs) were enriched among biased genes. 12 The differences in expression bias of LSG paralogs between He and Rv (Figure 3; Supplemental Figure S4B) suggest that the evolution of expression specificity of recently duplicated genes in the 2 species targets different developmental pathways.

Biased gene expression by gene category and developmental stage in (A) He and (B) Rv.
Biased genes largely displayed different enriched gene ontology (GO) terms between tardigrade species, except for juvenile-biased genes that were enriched with chitin binding genes (Figure 4). Chitin involved in tardigrade cuticle formation, remodeling and the molting cycle. 40 Interestingly, genes associated with chitin-binding functions were also enriched among tardigrade-specific gene (TSG) expansions, as defined as genes with more paralogs than the combined number of orthologs in all 3 non-tardigrade outgroup species. The expansion of gene families coding for proteins with chitin binding properties in tardigrades might have evolved to help regulate physiological responses to environmental stresses.41,42 Numerous other GO terms were found enriched among TSGs and TSG expansions including functions related to DNA binding, peptidase activity, and G protein-coupled receptor activity (Figure 4), which have been previously reported in Yoshida et al 17 based on analyses of only He and Rv (before data from Echiniscoides sigismundi and Richtersius coronifer were available). Lineage-specific genes and expansions (ie, genes specific to either He or Rv) showed little overlap in enriched GO terms between species, suggesting species-specific emergence and duplications of unrelated gene families that code for proteins with distinct functions. This is in line with previous analyses that found divergence in stress-response genes among tardigrades. 13

Gene ontology enrichment among gene lists including biased genes in embryos (egg), juveniles (juv), active adults (adu), and tun, as well as tardigrade-specific genes (TSG), lineage-specific genes (LSG), tardigrade-specific gene expansions (TSGexp), and lineage-specific gene expansions (LSGexp). The size of the bubble represents the fold difference between the observed versus expected occurrence of the gene ontology term, and the color represents the FDR-corrected P-value from the topGO weight01 algorithm.
Young and duplicated genes contribute to differential expression during anhydrobiosis
Previous transcriptomic analysis between the active and tun states in H. exemplaris compared to R. varieornatus revealed species-specific responses to anhydrobiosis with nearly 5 times more differentially expressed (DE) genes in He compared to the more resilient Rv. 17 In our differential expression analyses between active and tun adults using the same data but different methods, we find similar results detecting 1386 differentially expressed genes in He (651 upregulated in tun; 735 downregulated in tun; Supplemental Table 3), and 126 differentially expressed genes in Rv (8 upregulated in tun; 116 downregulated in tun; Supplemental Table 4). Despite these differences, we found more overlapping orthogroups among He and Rv DE genes than expected by chance based on 10 000 permutations (n = 27; P = .0033). This suggests that there is a core set of tun-related genes that share homology, in addition to numerous gene families that are upregulated by anhydrobiosis in He but constitutively highly expressed in Rv. 17 Gene ontology analysis only detected 9 enriched GO terms among DE genes, all in He downregulated genes, including GO categories that are enriched with LSGs like semaphoring signaling and receptor activity (Supplemental Table 5). Accordingly, we found that LSG singletons were enriched among DE genes in both He (Chi-square test, P = 1.272e-13) and Rv (Chi-square test, P = 2.524e-04), particularly in genes that are downregulated in tun (Figure 5). With an inflation value of 3.0, LSG paralogs were also enriched among DE genes in both He (Chi-square test, P < 2.2e-16) and Rv (Chi-square test, P = 2.524e-04). This enrichment in downregulated genes suggests that these LSGs have not evolved specialization in anhydrobiosis, but rather are involved in other processes in active adults. On the other hand, shared singleton genes are underrepresented among differentially expressed genes (Chi-square test, P < 2.2e-16 in He, P = 9.388e-14 in Rv), suggesting that evolutionarily younger genes tend to play disproportionately larger roles during this physiological transition. Furthermore, tardigrade-specific paralogs were also enriched among DE genes in both species (Chi-square test, P = 7.324e-12 in He, P = 1.209e-05 in Rv), and gene family expansions were proportionally more frequent among DE genes; while expansions make up 26% (He) and 18% (Rv) of shared paralogs overall, they make up 39% (He) and 30% (Rv) of shared paralogs that are DE. These findings support the idea that duplicated genes and recently emerged genes in tardigrades are important contributors to physiological changes occurring between active and tun states.

Gene categories of differentially expressed genes between tun and active adults in: (A) He and (B) Rv. Genes identified as differentially expressed were separated into those that were higher expressed (UP) and lower expressed (DOWN) in tun versus active adults. The number of genes is listed at the top of each bar, and the proportions represented by different gene categories are reported by color.
Conclusions
We described the contributions of lineage-specific genes to developmental expression bias in 2 tardigrade species. Results suggest species-specific transcriptional regulation throughout development and anhydrobiosis, wherein LSGs display expression bias during different developmental stages and physiological states. Accordingly, the sets of singleton and duplicate LSGs from different tardigrades code for proteins that are enriched in different functions. While this suggests that LSGs are involved in largely species-specific processes, we find them to be enriched among genes that transcriptionally respond to anhydrobiosis in both species. As the identification of lineage-specific genes is influenced by the accuracy of gene annotations 43 and homology detection methods, 44 our LSG estimates might artificially be inflated. It is therefore possible that the signal of expression bias among LSGs are caused not by recently emerged genes within a lineage, but by extremely diverged genes among species that have rapidly evolved and diversified both in their molecular sequences and expression. In either case, our findings show that tardigrade genes that have little homology in other species tend to have species-specific transcriptional roles during development and anhydrobiosis.
Research Data
sj-xlsx-2-evb-10.1177_11769343221140277 – Supplemental material for Diversity in Expression Biases of Lineage-Specific Genes During Development and Anhydrobiosis Among Tardigrade Species
Supplemental material, sj-xlsx-2-evb-10.1177_11769343221140277 for Diversity in Expression Biases of Lineage-Specific Genes During Development and Anhydrobiosis Among Tardigrade Species by Jean-Christophe Metivier and Frédéric J J Chain in Evolutionary Bioinformatics
Supplemental Material
sj-zipx-1-evb-10.1177_11769343221140277 – Supplemental material for Diversity in Expression Biases of Lineage-Specific Genes During Development and Anhydrobiosis Among Tardigrade Species
Supplemental material, sj-zipx-1-evb-10.1177_11769343221140277 for Diversity in Expression Biases of Lineage-Specific Genes During Development and Anhydrobiosis Among Tardigrade Species by Jean-Christophe Metivier and Frédéric J J Chain in Evolutionary Bioinformatics
Footnotes
Acknowledgements
We thank Bethany Weinberg for discussions, and Natalie Steinel for her support and enthusiasm for all things water piglets.
Funding:
The author(s) disclosed receipt of the following financial support for the research, authorship, and/or publication of this article: This work was supported by the Immersive Scholar program (JCM) and start-up funds from the University of Massachusetts Lowell (FJJC).
Declaration of Conflicting Interests:
The author(s) declared no potential conflicts of interest with respect to the research, authorship, and/or publication of this article.
Author Contributions
JCM and FJJC collected and analyzed the data. FJJC wrote the manuscript. All authors approved the submitted version.
Supplemental Material
Supplemental material for this article is available online.
References
Supplementary Material
Please find the following supplemental material available below.
For Open Access articles published under a Creative Commons License, all supplemental material carries the same license as the article it is associated with.
For non-Open Access articles published, all supplemental material carries a non-exclusive license, and permission requests for re-use of supplemental material or any part of supplemental material shall be sent directly to the copyright owner as specified in the copyright notice associated with the article.