
Abstract
Purpose
Equivalent cross-relaxation rate (ECR) imaging (ECRI) is a measurement technique that can be used to quantitatively evaluate changes in structural organization and cellular density by MRI. The aim of this study was to evaluate the correlation between the ECR value and cellular density in the rabbit VX2 tumor model.
Materials and Methods
Five rabbits implanted with 10 VX2 tumors in the femur muscles were included in this study. We adopted the off-resonance technique with a single saturation transfer pulse frequency of 7 ppm downfield from water resonance. The ECR value was defined as the percentage of signal loss between the unsaturated and saturated images. ECR images were constructed based on the percentage of the ECR value. Pathological specimens were divided into 34 areas and classified into two groups: the viable group and the necrotic group. ECR values were measured and compared between groups. The correlation between the ECR value and cellular density was then determined.
Results
The mean ECR value was significantly higher in the viable group than in the necrotic group (61.2% vs. 35.8%). The area under the curve that calculated by receiver operating characteristic curve was 0.991 at 7 ppm. The regression graph showed a linear relationship between the ECR value and cellular density; the correlation coefficient (r) was 0.858.
Conclusion
There is a strong association between the ECR value and cellular density in VX2 tumors and so ECRI could be a potentially useful technique for accurately depicting viable and necrotic areas.
Introduction
It is of crucial importance to determine tumor cellularity in the evaluation of treatment effects for malignant tumors. In particular, it is important to accurately differentiate between viable and necrotic tumors when evaluating tumor response to chemotherapy and determining treatment strategies for malignant tumors.
Equivalent cross-relaxation rate (ECR) imaging (ECRI) is a means of noninvasive assessment of tumor cellularity. 1 ECRI is reported to be a feasible technique that does not require contrast injection for the detection of axillary lymph nodes in breast cancer, and is able to quantitatively distinguish the changes in structural organization of the node; cellular components show high ECR values using MRI parameters.2–4 Therefore, ECRI is potentially useful as a cellular density imaging technique in assessing the metastatic status of axillary lymph nodes in patients with breast carcinoma. 1 The aim of this study was to evaluate the correlations between the ECR value and cellular density in a rabbit VX2 tumor model.
Materials and Methods
Animal model
All experiments were conducted with the approval of the laboratory animal center at our institution. Five Japanese white rabbits (weight, 1.96–2.72 kg) with 10 VX2 tumors (SLC, Shizuoka, Japan) implanted into the femur muscles were included in this study. Namely, a VX2 tumor was implanted in a femur muscle of a rabbit. Tumors were implanted by embedding 1-mm tissue cubes for 14 days. 5
MRI and ECR techniques
Imaging was performed using a Signa 1.5 T clinical scanner (GE Medical Systems, Milwaukee, WI, USA). VX2 tumors were confirmed based on coronal T2-weighted images with fat saturation (FST2WI). MRI parameters were as follows: field of view, 30 cm; Bandwidth, 31.25 kHz; slice thickness, 5 mm; overlap location, 0; matrix, 512 × 256; TR/TE, 3000/12.5 ms.
In order to determine the ECR values and to perform ECRI, VX2 tumors were observed using a head coil. Coronal images were obtained by 3-dimensional spoiled-gradient recalled acquisition in the steady state (3DSPGR) and saturation transfer prepared 3DSPGR (ST-3DSPGR). The 3DSPGR and the ST-3DSPGR pulse sequences were standard GE sequences. We adopted the off-resonance technique for preferential saturation of the immobile protons in order to evaluate the ECR values. MRI parameters were as follows: field of view, 30 cm; slice thickness, 5 mm; overlap location, 0; locations per slab, 8; matrix, 512 × 192; TR/TE, 40/6.9 ms; flip angle, 30°; magnetization transfer pulse, 3.6 μT. The single saturation transfer pulse frequency was 5 and 7 ppm downfield from water resonance.
ECR was defined as follows:

where M0 is signal intensity in unsaturated 3DSPGR images and Ms is signal intensity in saturated ST-3DSPGR images. ECR images were constructed using the ECR value of each pixel, based on the percentage of signal loss between unsaturated and saturated images. We used OsiriX, 6 a Mac OS X-based open source program, to construct ECR images.
Image analysis
All images were evaluated by two radiologists: one constructed ECR image based on the ECR value at each pixel and the other measured the ECR values. The regions of interest (ROI) for signal intensity measurements were selected from red, yellow, yellowish green and blue areas in ECR images. ECR images were constructed based on the percentage of the ECR value, with each color representing a different value. ROI was measured at three points in each area; means were assumed to be the ECR value in each area. The ROI had a rectangular sampling area of 10 mm2.
Histopathologic analysis
Animals were sacrificed by administering a lethal dose (100 mg/kg) of intravenous sodium pentobarbital. Subsequently, the VX2 tumor was enucleated and then visualized by MRI. Pathologic specimens were fixed in 10% formalin for subsequent embedding in paraffin and analysis. Histologic sections were obtained in a plane parallel to that of MRI. Staining was performed using hematoxylin and eosin (HE).
Win Roof ver. 5 (Mitani Corporation, Fukui, Japan) software was used to analyze the cellular density for morphometry. In measurements of cellular density, the number of nuclei was obtained using a threshold setting for nuclear color extraction in pathological specimens stained with HE. In this study, we assumed that the number of nuclei was similar to the number of cells and defined cellular density as the number of cells per mm2 (/mm2). The ROI had a rectangular sampling area of 0.17 mm2 of a fixed view in the ×200 microscopic fields. The cellular density in HE-stained specimens was measured in 5 ROI for each area; means were determined for each area.
Statistical analysis
Statistical analyses were conducted using Dr. SPSS II version 11.0.1J (SPSS Inc., Chicago, IL, USA). The correlation between ECR value and cellular density was determined at frequencies 5 and 7 ppm downfield from water resonance. A regression graph for the ECR value and cellular density was plotted, and correlation coefficients (r) were calculated. The relationship between ECR values and cellular density was analyzed using Pearson product-moment correlation analysis. The 10 VX2 tumors were divided to 34 areas by the basis on the color map (red, yellow, yellowish green and blue) of ECR image. The viable and necrotic areas were confirmed by seeing pathological specimens. We contrasted pathological specimen with ECR image and classified into two groups: the viable group and the necrotic group. At the frequency values with the highest correlation rates, the ECR value was measured and compared between the two groups. For each parameter, sensitivity and specificity were plotted as a function of cutoff criterion, receiver operating characteristic (ROC) curves were constructed, and the areas under the curve (AUC) were calculated. The Mann–Whitney U-test was employed to determine significant differences between ECR values in viable areas and those in necrotic areas. P values of less than 0.05 were considered to be statistically significant.
Results
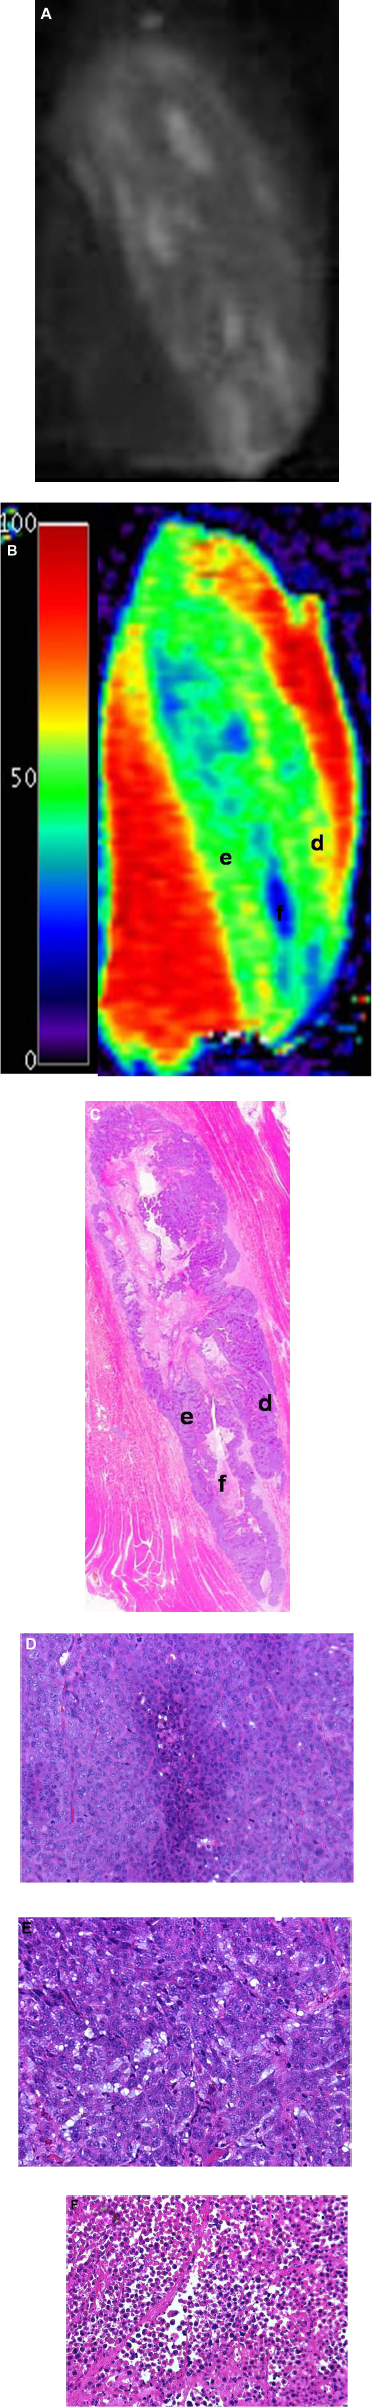
All implantations were successful, and in all 5 rabbits, tumors developed. Among the 34 measured areas, 5 were red, 10 were yellow, 10 were yellowish green and 9 were blue. Blue areas were found to be necrotic areas and the other areas were viable on comparison between ECR images and pathological specimens [Fig. 1A–F].
(
ECR value and cellular density
The cellular density in the red, yellow, yellowish green and blue areas was 4.54 ± 0.34 (×104)/mm2, 4.38 ± 0.80 (×104)/mm2, 3.32 ± 0.36 (×104)/mm2 and 1.76 ± 0.46 (×104)/mm2, respectively. The cellular density in the viable and necrotic groups was 3.99 ± 0.79 (×104)/mm2 and 1.76 ± 0.46 (×104)/mm2, respectively. The regression graph showed a linear relationship between ECR values at 5 and 7 ppm and cellular density; the correlation coefficients (r) and P value were 0.818, 0.858 and 0.000, 0.000, respectively [Fig. 2A and B]. The correlation coefficient was strongest for the ECR values at 7 ppm. The mean ECR value at 7 ppm in the red, yellow, yellowish green and blue areas was 73.3% ± 5.3%, 63.4% ± 2.5%, 50.6% ± 2.5% and 35.4% ± 9.7%, respectively.

(
ECR value (coefficient of variation) of viable and necrotic groups
The mean ECR value (coefficient of variation; CV (%)) in the viable group at 5 and 7 ppm was 76.2% ± 13.7% (CV; 15.7) and 60.2% ± 9.5% (17.9), respectively. The mean ECR value (CV) in the necrotic group at 5 and 7 ppm was 45.0% ± 15.2% (CV; 27.4) and 35.4% ± 9.7% (33.7), respectively. Mean ECR values were significantly higher in the viable group than in the necrotic group (P = 0.000), while the CV was higher at 5 ppm than at 7 ppm [Table 1]. The AUC that calculated by ROC curve was 0.991 at 7 ppm.

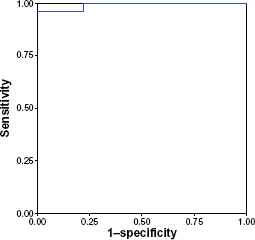
Receiver operating characteristics curve for ECR value and Cellular density. For each parameter the relation of sensitivity and 1-specificity is plotted. The area under the curve (AUC) for each parameter indicates its diagnostic accuracy. The AUC was 0.991.
Discussion
The treatment response for malignant tumor is generally evaluated by tumor size, and the Response Evaluation Criteria in Solid Tumors (RECIST) criteria 7 is commonly used to evaluate treatment effects. However, tumor response often involves the formation of necrosis without immediate size changes. Recently, diffusion-weighted MRI (DWI) and PET have been used to quantitatively evaluate tumor response and have been applied to the early response for chemotherapy.8–10 DWI evaluates the random motion of water molecules within the extracellular space, and can thus be used to indirectly evaluate tumor cellularity. 11
In contrast, ECRI can be used to quantitatively evaluate changes in protein-water interactions and is able to directly provide information regarding the cell content when the offset frequency of the magnetization transfer pulse is less than 10 ppm.1,4 Earlier studies refined this technique and demonstrated that the cross-relaxation rate can be calculated using a simple equation; this was termed the ECR. In ECRI, the contrast obtained in breast cancer tissue is correlated with the malignant potential of cells and the extent of fibrosis.2,12,13 It may be possible to evaluate the presence or absence of axillary lymph node metastases and to confirm the cellular density of axillary lymph nodes using the ECRI technique.3,4
In our study, we could clearly visualize the organization of VX2 tumors by color-mapped ECRI. The blue areas were necrotic tissue, and the yellowish green, yellow and red areas were viable tissue. The cellular density and ECR value in necrotic areas were significantly lower than those in viable areas, and so the AUC showed that ECR value had the high diagnostic accuracy in tumor viability (0.991 for tumor cellularity). These results support the notion that ECRI is useful in assessing tumor necrosis. The cellular density and ECR value in viable areas were ranked as follows: red areas, yellow areas and yellowish green areas. This observation is due to the fact that the ECR value increases in accordance with cellular components.
The correlation coefficient at 7 ppm (0.858) was stronger than that at 5 ppm (0.818). However, the coefficient of variation (CV) at an offset frequency of 7 ppm was lower than that at 5 ppm. The ECR value at an offset frequency of 7 ppm was suitable for the evaluation of tumor necrosis. In contrast, it is possible to demonstrate various properties regarding cellular organization by the ECR value at the offset frequency 5 ppm. We expect that ECRI will be useful for evaluating tumor necrosis and the response to chemotherapy in malignant tumors in clinical settings.
This study has several limitations. First, our study group was relatively small, and further studies with a larger sample size are needed in order to confirm our conclusions. Second, we performed ECRI for removed tumors.
In conclusion, There is a strong association between the ECR value and cellular density in VX2 tumors and so ECRI could be a potentially useful technique for accurately depicting viable and necrotic areas.
Disclosures
Author(s) have provided signed confirmations to the publisher of their compliance with all applicable legal and ethical obligations in respect to declaration of conflicts of interest, funding, authorship and contributorship, and compliance with ethical requirements in respect to treatment of human and animal test subjects. If this article contains identifiable human subject(s) author(s) were required to supply signed patient consent prior to publication. Author(s) have confirmed that the published article is unique and not under consideration nor published by any other publication and that they have consent to reproduce any copyrighted material. The peer reviewers declared no conflicts of interest.
Footnotes
Acknowledgment
This work was supported by Grant-in-Aid for Young Scientists (B) (No.20790905) from the Ministry of Education, Science, Sports, and Culture.