
Abstract
The tumor, node, metastasis (TNM) staging system has been regarded as one of the most widely used staging systems for solid cancer. The “T” is assigned a value according to the primary tumor size, whereas the “N” and “M” are dependent on the number of regional lymph nodes and the presence of distant metastasis, respectively. The current TNM model classifies stages into five crisp classes. This is unrealistic since the drastic modification in treatment that is based on a change in one class may be based on a slight shift around the class boundary. Moreover, the system considers any tumor that has distant metastasis as stage 4, disregarding the metastatic lesion concentration and size. We had handled the problem of T staging in previous studies using fuzzy logic. In this study, we focus on the fuzzification of N and M staging for more accurate and realistic modeling which may, in turn, lead to better treatment and medical decisions.
Introduction
Cancer is a broad group of various diseases, all of which involve unregulated cell growth. In cancer, cells divide and grow uncontrollably, forming malignant tumors, and invading nearby parts of the body. The cancer may also spread to more distant parts of the body through the lymphatic system or bloodstream. There are over 200 different known cancers that affect humans. 1 Cancer can be detected in a number of ways, including via the presence of certain signs and symptoms, screening tests, or medical imaging such as computed tomography (CT) scan and magnetic resonance imaging (MRI). Cancer is treated using many methods such as chemotherapy, surgery, radiation therapy, or a combination of these therapies. Choosing the right therapy depends on measuring the prognostic values of the disease for each patient, which includes determining the chances of surviving the disease. The chances of surviving the disease vary greatly by the type and location of the cancer, and the extent of disease at the start of treatment. The chances of survival, or prognostic values, are determined via staging systems. The current staging systems are divided according to whether they stage solid or nonsolid tumors (blood cancer). The tumor, node, metastasis (TNM) system is by far the most commonly used system for staging solid tumors. 2 The TNM cancer staging system provides a classification scheme for cancer that describes the primary tumor, regional lymph nodes, and metastasis. Various categories with similar prognostic value may be grouped together to define the stages of the disease (for example, stage 1, stage 3, and so on). 3 To determine the stage, each of the three components (T, N, and M) has to be assigned to a category first. T is divided into four main categories according to the size and/or extent of the tumor. N is divided into four main categories according to the degree of spread to the regional lymph nodes. M is divided into two categories according to the presence of distant metastasis.
Many revisions have been applied to the TNM staging system. The revisions were prompted by the realization that previous criteria for TNM categorization have become obsolete in view of up-to-date standards of care and modes of practice. 2 However, According to Thor 4 and Veronesi et al, 5 a call to redesign the TNM staging system so it is more analytical and fine-tuned is needed in order to improve its utility for individual cancer treatment. After studying the system, it has been recognized that even the most recent revision for the TNM staging still lacks a very important aspect, which is granularity. There is no gradation for the start and the end of each class that represents each stage in the TNM system. For instance, if a patient was diagnosed as stage 2, given that the size of the tumor is based on the largest diameter (4.9 cm), then the patient will undergo the treatment strategy used for all patients categorized as stage 2, even though the patient's case reflects stage 3 more than it does stage 2. In our study, we contend that the patient's case should be diagnosed as stage 2 and 3, but with different certainty values for both stages. This could highly affect treatment decisions for the patient. The patient can then undergo a combination of treatment strategies prescribed for stage 2 and stage 3 tumors. While studying the latter problem, it was noticed that the T staging is based on measuring the longest diameter of the tumor from MRI or CT scans. Prior studies have shown that when tumors develop into shapes in which the width is more than twice the length, which often occurs after treatment because of scarring, bidimensional measurements such as volume provide more accurate classification of the treatment response than diameter alone. 6 Most of the literature assumes that the tumor is a perfect sphere, 5 which explains why T staging is based on measuring the largest diameter of the tumor. However, this should not be the case, since the structure of a tumor is rarely a fixed geometrical shape; rather, it is mostly irregular. This intrinsic irregularity signifies the importance of using tumor volume in determining the T stage instead of using the diameter. In our previous studies 7 we investigated the effect of estimating the volume of the tumor from MRI images based on different degrees of tumor concentration. This was done by using a fuzzy segmentation algorithm to segment the tumor from MRI images and calculating the volume of the tumor at different degrees of certainty or alpha cuts. The study showed how the volume can vary greatly at different alpha cuts. This proved that it is very inaccurate to determine the T stage of the tumor on the assumption that the tumor shape is a perfect sphere. Additionally, in another study, 8 we showed how to modify the T stage model of the TNM system for breast cancer into fuzzy sets instead of dividing stages into crisp classes according to the tumor's diameter. The proposed modification can handle gradation such that the tumor can be categorized to different T stages with different degrees of certainty. Moreover, we transformed the model to be based on tumor volume and not tumor diameter for more accurate T staging.
In this study, we answer the question of whether it is possible and feasible to apply fuzzy approaches to determine the N and M stages of a tumor for accurate stage estimation and treatment decisions.
The T and N stages are divided into many classes, unlike the M stage. The M stage refers to whether there is distant metastasis or not, so the patient is categorized as either MO or Ml. This is why M is divided into only two classes, unlike T and N, which have many classes each. When distant metastasis is present, the overall stage is categorized as T4. At this stage, the main goal is not the treatment of the cancer, but rather of prolonging life and maintaining the patient's quality of life. 9 One of the main factors affecting treatment options in this stage is the size and location of the metastasis. 9 Since the size can be determined from medical images, it is possible to use the method introduced in Yones and Moussa 7 to determine the most dominant tumor concentration and to accurately estimate the volume of the metastasis. This will lead to choosing a treatment option that will most likely ensure the patient's quality of life. For instance, radiation therapy is most often administered by medical doctors in cases of bone or brain metastases. 10 The main aim of radiation therapy is to relieve pain or other symptoms caused by metastatic disease. It may also be given to reduce the size of a tumor in order to reduce symptoms. Figure 1 shows an MRI image of a metastatic brain tumor in the deep right parietal lobe that resulted from lung cancer. 11 The diameter of this tumor is around 1.3 cm. For medical doctors, this would most likely be considered a large lesion, and since it is metastatic, radiation therapy would be chosen. However, the volume of the tumor might be large, but the concentration of the tumor might be low or scarce. In other words, the area that is 90% cancerous might be very small compared to the overall confined area (with the white border). In that case, surgical resection would be a better choice, and it would save the patient from the side effects of radiation while ensuring a better quality of life.

MRI image of a metastatic brain tumor from lung cancer in the deep right parietal lobe. Has been reproduced. 11
Although the patient would be categorized as stage 4, if any distant metastatic lesions are discovered, we can still add gradation to the borders of T4 or stage 4 classes, according to the volume and concentration of the metastatic lesion, as proposed by Yones and Moussa, 7 as well as by Moussa and Yones. 8 This would give the medical doctors an insight as to how much the patient is categorized as T4. Accordingly, doctors can support their decisions when selecting the most optimum treatment in this case.
The remainder of the paper is divided into four sections. Section 2 introduces an approach for the fuzzification of N staging. Section 3 suggests an approach for M staging. Section 4 presents the results and discussion, and Section 5 offers concluding remarks.
Applying Fuzzy Set Theory to the Regional Lymph Node Stage (N)
Unlike T staging, the Lymph node, or N staging, depends on many different factors. The factors affecting Lymph node staging in TNM includes: 1) whether the diagnosis was done clinically or pathologically; 2) the location of the infected regional lymph nodes; 3) the number of infected lymph nodes; and 4) the size of tumor cells in the malignant lymph nodes (in the event that the diagnosis was made based on pathology).
Infected regional lymph nodes are not easily determined using imaging techniques; this is usually determined by surgical resection. Hence, it was crucial to use real data collected from patients following tumor resection or needle biopsy. The Surveillance, Epidemiology, and End Results (SEER) Program of the National Cancer Institute (Bethesda, MD, USA) is an authoritative source of information on cancer incidence and survival in the United States.
12
The SEER Program registries routinely collect data on patient demographics, primary tumor site, tumor morphology, stage at diagnosis, first course of treatment, and follow-up for vital status. Since the SEER Program data were available for public use over the Internet, and given that they were used by thousands of researchers (which renders them benchmark data), we decided to use them in this research. SEER codes and processes all reportable cases diagnosed between January 1, 2012 onward under the Collaborative Stage (CS) Data Collection System version 0204.
13
The CS Data Collection System is a carefully selected, medically relevant, set of data points that describe how far a cancer has spread at the time of diagnosis. The CS Data Collection System is based on, and is compatible with, the terminology and staging in the sixth edition of the American Joint Committee on Cancer's (AJCC)
While studying the system for breast cancer (since the T was also applied in breast cancer) and SEER codes, it was observed that in order to calculate a regional lymph node stage using the CS data collection system, the values from three data items and two tables (according to whether the diagnosis was pathological or clinical) were mostly used. Data items include:
CS lymph nodes:
This code indicates the type and part of the breast where infected regional lymph nodes were found. CS lymph node evaluation:
This code represents how the code for the item “CS lymph nodes” was determined based on the diagnostic methods employed, as well as on their intent (pathological or clinical). CS site-specific factor 3 (SSF3): this identifies the additional information needed to generate the stage or prognostic factors that have an effect on stage or survival.
Tables included:
Lymph Node Pathologic Evaluation Table Lymph Node Clinical Evaluation Table
Depending on the value of the CS lymph node evaluation one can decide whether to use the pathological or clinical evaluation tables to assign the N stage to a certain case. Determining an N stage using pathological or clinical evaluation tables depends on the values of two variables: the CS lymph nodes, which codes the type and part of the breast where infected regional lymph nodes were found; and CS SSF3, which codes the number of infected lymph nodes that were found. Table 1 shows the lymph node pathological evaluation table.
Lymph node pathological evaluation table. 16

It was observed that SSF3, which represents the exact number of infected lymph nodes, is divided into four crisp classes. This is where fuzzy set theory and fuzzy logic were applied.
The pathological evaluation table resembles a fuzzy rule base that is used in fuzzy logic systems. In order to assign the stage with a certain value, it was crucial to first determine the fuzzy variables. The two input variables in this case are the CS lymph node code and the value of SSF3, which represents the exact number of lymph nodes. The CS lymph node code is not divided into crisp classes, so it cannot be transformed into a fuzzy variable. However, SSF3 can be transformed into a fuzzy variable, since it is already divided into crisp classes. In order to assign the lymph node stage using fuzzy logic, three steps have to be carried out:
Mapping each of the crisp inputs into a fuzzy variable (fuzzification); Determining the output of each rule given its fuzzy antecedents; and Determining the aggregate output(s) of all of the fuzzy rules.
Fuzzification.
Figure 2A and Figure 2B show the transformation of the crisp sets for SSF3 into fuzzy sets based on the number of infected lymph nodes. The fuzzy sets were chosen to be trapezoidal since in each class there was a wide range of values that could take a certainty value equal to 1. With the proposed fuzzification, a border point in any of the crisp classes belongs to two different fuzzy sets due to the gradation, overlapping, and gap elimination. The fuzzy sets were constructed such that the border points have higher membership values in their corresponding crisp classes than in the neighboring ones. For example, in Figure 2A × = 3 is an upper border point in the second class. After constructing the fuzzy sets (Fig. 2b), the μ(second class) (3) = 0.8, while μ(third class) (3) = 0.2 where μ(second class) (3) represents the membership value of × = 3 in the second class, and μ(third class) (3) similarly represents the membership value of x = 3 in the third class. Figure 3 shows how to calculate the fuzzy membership value for any point when the fuzzy set is trapezoidal.

Transforming the crisp sets (
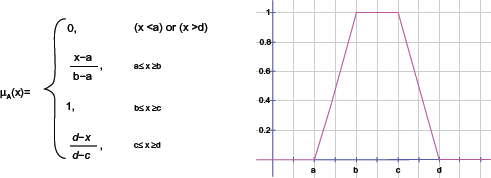
How to calculate the fuzzy membership value for any point when the fuzzy set is trapezoidal. Has been reproduced. 17
Determining the Output of Each Rule Given Its Fuzzy Antecedents.
Using the membership values determined during fuzzification, the rules are evaluated according to the compositional rule of inference. The result is a fuzzy set output that is a clipped version of the user-specified fuzzy set output. The height of this clipped set depends on the minimum height of the antecedents. Another alternative is to use any of the intersection operators on fuzzy sets. The original classical intersection operator on the fuzzy sets was used in this research. For example, if two of the inputs are half true and the other two inputs are a quarter true, then by using the intersection operator, the output will be a quarter true (choosing the minimum value). Table 2 shows some of the extracted rules from the lymph node pathological evaluation table, which serve as the rule-base for determining the N stage output and its degree of certainty.
Some of the extracted rules from the lymph node pathological evaluation table.

Possibility of Modifying Distant Metastasis Staging to Handle Gradation.
According to the sixth edition of the AJCC's TNM staging system and the CS Data Collection system, the M stage is assigned based on whether there is distant metastasis in another organ or not. For T staging, the size is the main factor affecting the stage, and for N staging, the number of infected lymph nodes is the main factor affecting the stage. In both cases, the TNM system classified these factors into crisp classes. Transforming them into fuzzy sets was possible, as explained and illustrated in sections 3 and 4. However, this is not the case with distant metastasis M staging. The only factor determining the M stage is whether there is clinical or radiographic evidence that metastasis is present at any other organ besides the primary tumor. In this case, the M stage is M1, or else it is M0. As mentioned in the Introduction, it is well known that there is no cure if a person is categorized as T4. Nevertheless, treatment choice can ensure that the patient's life is prolonged, and it can help maintain the best possible quality of life for the patient. It was explained how the concentration of the metastatic lesion and its volume can affect the choice of treatment in this stage. It is possible to determine the concentration of distant metastasis from MRI images using the same method introduced by Yones and Moussa. 7 Figure 4 shows a simple flow chart of this approach. This can be done by segmenting the metastatic lesion using the fuzzy connectedness algorithm. The fuzzy affinity matrix output is then used to determine the most dominating alpha cut in each MRI slice. The percentage of an alpha cut's dominance is calculated by counting the number of instances with which the alpha cut appears in the fuzzy affinity matrix and dividing that number by the number of pixels that have values greater than 0. This is done for each alpha cut between 0.1 and 0.9. The percentage of dominancy for each alpha cut is averaged for all the slices using equation 1. The alpha cut that has the highest percentage is considered the fuzzy value of the T4 stage in this case.
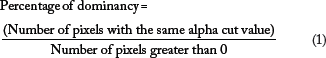

Flow chart for calculating the percentage of dominancy.
This method can be used if the MRI images for the distant metastatic lesions are available. However, these data were not available to carry out the latter proposed method.
Results and Discussion
Results of Modifying Regional Lymph Node (N) Staging to Handle Gradation.
In this study, the “SEER 18 Regs Research Data + Hurricane Katrina Impacted Louisiana Cases (1973–2010) varying” database was used. SEER Stat, which is a tool that provides a convenient, intuitive mechanism for the analysis of SEER and other cancer-related databases, was used. Four variables were chosen to create a relevant view:
Primary site labeled CS lymph nodes 2004+ CS SSF3 (2004+) CS reg node evaluation (2004+)
Cases were first filtered according to values associated with the “Primary site labeled” variable in order to choose the breast cancer cases. Subsequently, the cases were filtered according to the “CS lymph nodes 2004+” values. The codes were chosen based on the codes present in Table 1 (250, 258, 260, 280, 500, 510, 520, 600, 610, 620, 630, and 720). These codes were used to construct the fuzzy rules in Table 2. Codes for pathological cases were chosen (2, 3, and 6). Tables 3, 4, 5, and 6 show the results of the chosen cases.
Results of N staging for cases such that CS lymph nodes 2004+ = 520 and CS reg node eval = 2.

Results of N staging for cases such that CS lymph nodes 2004+ = 600 and CS reg node eval = 2.

Results of N staging for cases such that CS lymph nodes 2004+ = 520 and CS reg node eval = 3.

Results of N staging for cases such that CS lymph nodes 2004+ = 600 and CS reg node eval = 3.
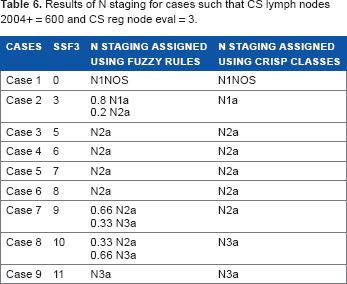
It is obvious that after determining the output of each rule using Table 4, some of the cases were assigned to two N stages with different degrees of certainty. This could affect the final cancer staging and, subsequently, treatment decisions.
Conclusion
One of the main TNM staging system disadvantages is that it divides the parameter, N, into crisp classes in order to stage regional lymph nodes. Crisp classes cannot provide an adequate representation of biological systems. Furthermore, a slight change between two neighboring stages regarding class boundaries can lead to unnecessary or erroneous changes in treatment. In this paper, a technique was presented to use fuzzy overlapping classes, which allows for intermediate overlapping ranges to represent the areas of uncertainties between the specific stages. The results have shown that some of the cases were assigned to two N stages with different degrees of certainty, which would positively affect treatment decisions and final cancer stage assignment. Moreover, we discussed the problem of static treatment choice for metastatic cancer. Even though metastatic cancer is categorized as incurable, the choice of treatment is essential for ensuring a good quality of life for the patient. In order to optimally choose a treatment, the extent and size of the metastatic lesion has to be measured. An approach was presented in this paper that quantifies the severity of the metastatic cancer and estimates its size. This approach used a fuzzy segmentation algorithm from the MRI images of the metastatic lesion, and it calculated the most dominant level of certainty (or alpha cut) from all the MRI slices. This degree of certainty represents the severity of the metastatic cancer.
Author Contributions
Proposed the fuzzy approach: AM. Conceived and designed the experiments: SY. Analyzed the data: SY. Wrote the first draft of the manuscript: SY. Contributed to the writing of the manuscript: SY, AM. Agree with manuscript results and conclusions: HH, NH. Jointly developed the structure and arguments for the paper: SY, AM. Made critical revisions and approved final version: AM, NH, HH. All authors reviewed and approved of the final manuscript.
Disclosures and Ethics
As a requirement of publication the authors have provided signed confirmation of their compliance with ethical and legal obligations including but not limited to compliance with ICMJE authorship and competing interests guidelines, that the article is neither under consideration for publication nor published elsewhere, of their compliance with legal and ethical guidelines concerning human and animal research participants (if applicable), and that permission has been obtained for reproduction of any copyrighted material. This article was subject to blind, independent, expert peer review. The reviewers reported no competing interests.
Footnotes
Acknowledgements
The authors are grateful to Dr Maha Hussein Helal for her radiological consultancy.